Unlocking Business Insights By Analyzing API Payloads
APIs are now the de facto way businesses can break down corporate silos by enabling data sharing across both internal departments and external customers and partners. According to Cloud Elements, over 50% of B2B collaboration now happens over APIs and is continuing to grow. Your business can deploy APIs to deliver additional value to partners and customers by enabling them to connect your services programmatically to enable automation and data sharing. At the same time, your business can build new products and services by piecing together a collection of APIs from other companies.
APIs are becoming the de facto digital supply chain for modern enterprises connecting vendors to customers. Because of this, the data flowing through your APIs is a good representation of the health of your business. Yet, there is a lack of tooling around leveraging this data.
Today, business analytics tools today have either focused on either:
- Offline transactional data sitting in databases and warehouses such as Redshift or Snowflake
- Online usage metrics sitting in tools like Mixpanel and Amplitude to understand how consumers interact with web and mobile interfaces.
This has left a gap for companies trying to extract insights on not only their web and mobile assets, but any digital asset that is API-driven whether it’s on partner integrations, vendor APIs, or APIs being served to customers. With APIs being standardized around common design patterns like REST, JSON, and GraphQL, it’s becoming easier for companies to collect and analyze that data without building elaborate custom solutions.
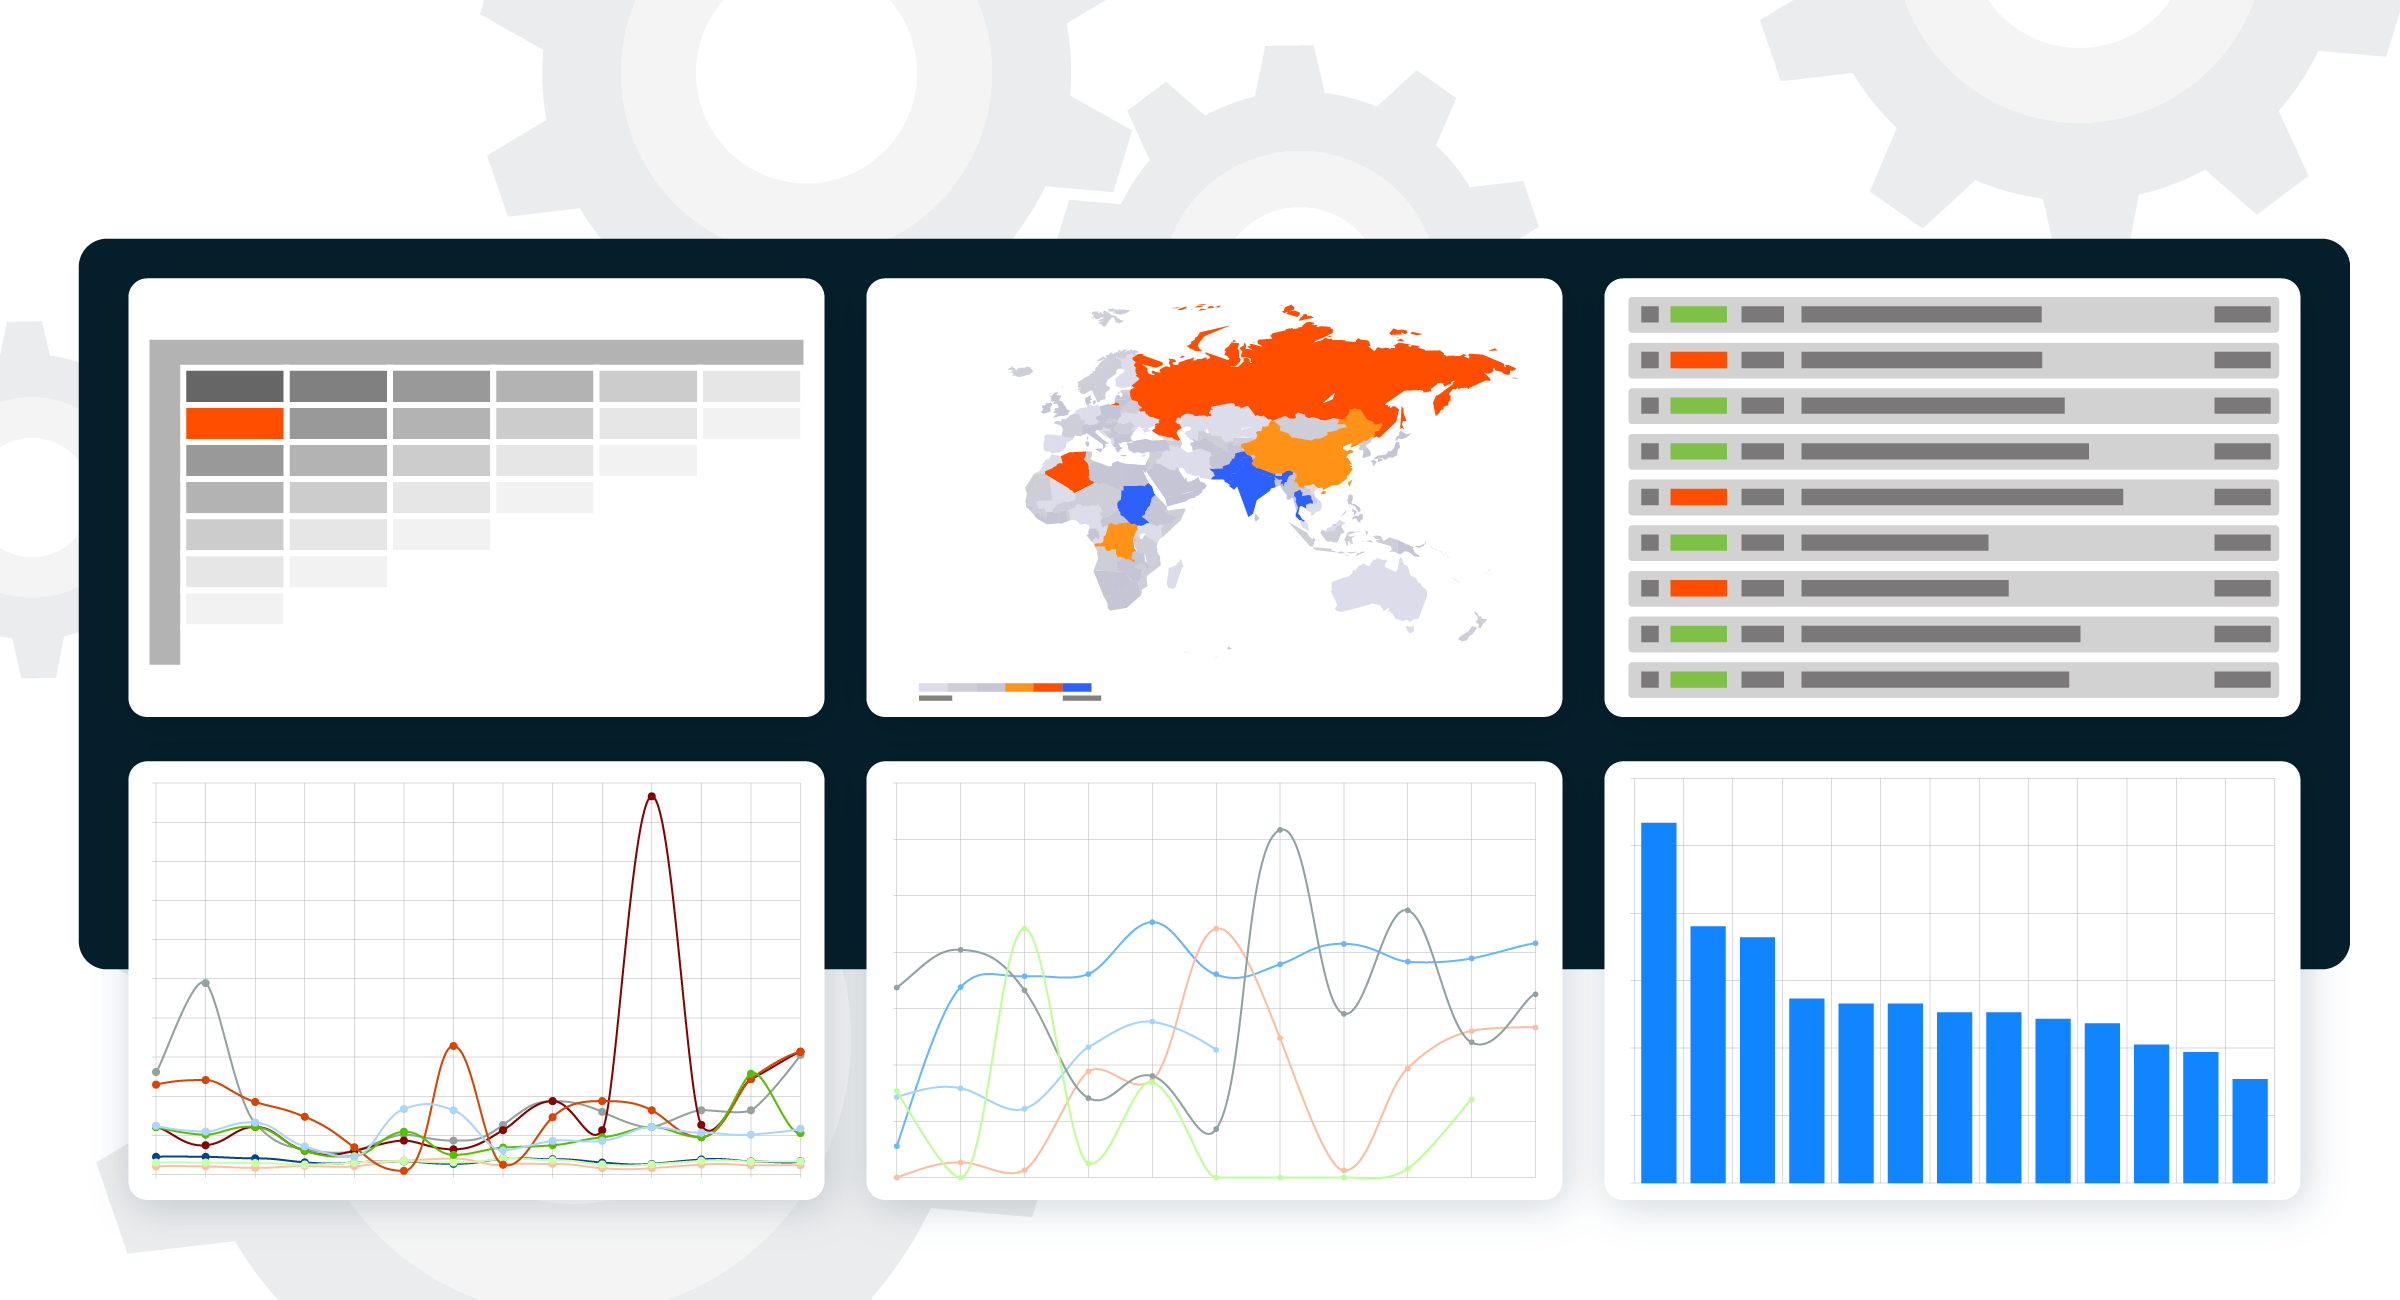
Architecture of API analytics solution
Baseline API Analytics for technical users
To start, an API analytics system should capture basic info around the API such as HTTP verb, path or route, and HTTP headers. Additional metadata should also be tracked such as status code and authentication information and latency. Such attributes enables technical metrics such as 90th percentile latency broken down by endpoint and discovering any outliers.
Expanding API Analytics to business users
Tracking only performance and functional API metrics is not enough for a system to be leveraged by business users. For an API analytics system to be useful, requests need to be tied back to business concepts such as what an API transaction means, the direction in which money or value flowed, and who the user of the API is. Because APIs are technical in nature, adding context such as a transaction description and which teams own the API is paramount. For example, if we were to see the top endpoints being used by the largest customers, one might do a top k aggregation like so:
| Endpoint | Daily Event Count |
|---|---|
| GET /items | 545451 |
| GET /items/:id/categories/ | 454151 |
| POST /comments | 3488 |
| POST /purchase | 101 |
However, API analytics for business users may tag API transactions with an easy description. Today, this can be done automatically via popular API markup languages like Swagger/OpenAPI to generate a report like so:
| Endpoint | Daily Event Count |
|---|---|
| Get a List of Items | 545451 |
| Get a List of an Item’s Categories | 454151 |
| Create a Comment | 3488 |
| Create a Purchase | 101 |
Analyzing request and response body
Capturing the entire payload enables drilling into not just which endpoints are called or latency it takes, but what are actual customers of your API querying or posting to the API. This enables tracking business entities like sales and orders. Additional metadata should also be tracked such as status code and authentication information and latency. The below image shows the number of API calls grouped by the “label” field in the response JSON, them grouped by customer name.

By looking at the actual data over the wire, we are able to see when our API was responding with Out of Stock as a Label or Type.
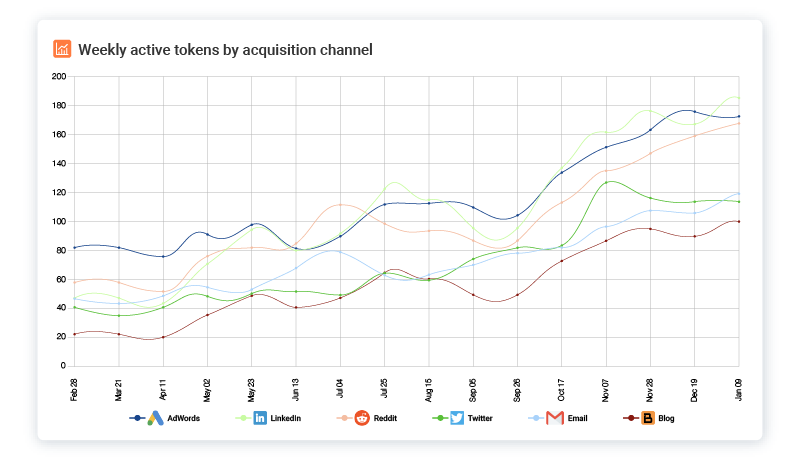
Adding customer demographic information
By pulling customer information in systems like Salesforce and internal user tables, business users can slice and dice the API data by customer name, employee count, and marketing attribution. This enables business users to understand which types of users are adopting and successfully using APIs the most while investing in the right sales and marketing initiatives that drive results. For example, the below chart shows unique API users broken down by marketing channel.
How can business users leverage API analytics?
By adding customer demographic information, a well-designed API analytics system can answer questions like:
- Track the customer journey from initial touch to fully activated / integrated accounts, while finding which marketing initiatives drive higher activation rates.
- Discover whether a specific API program is healthy by looking at product retention rates.
- Plan a better product strategy by knowing which API features are used or not used.
- Monitor when a new account activates or has struggles and preempt any hard discussions.
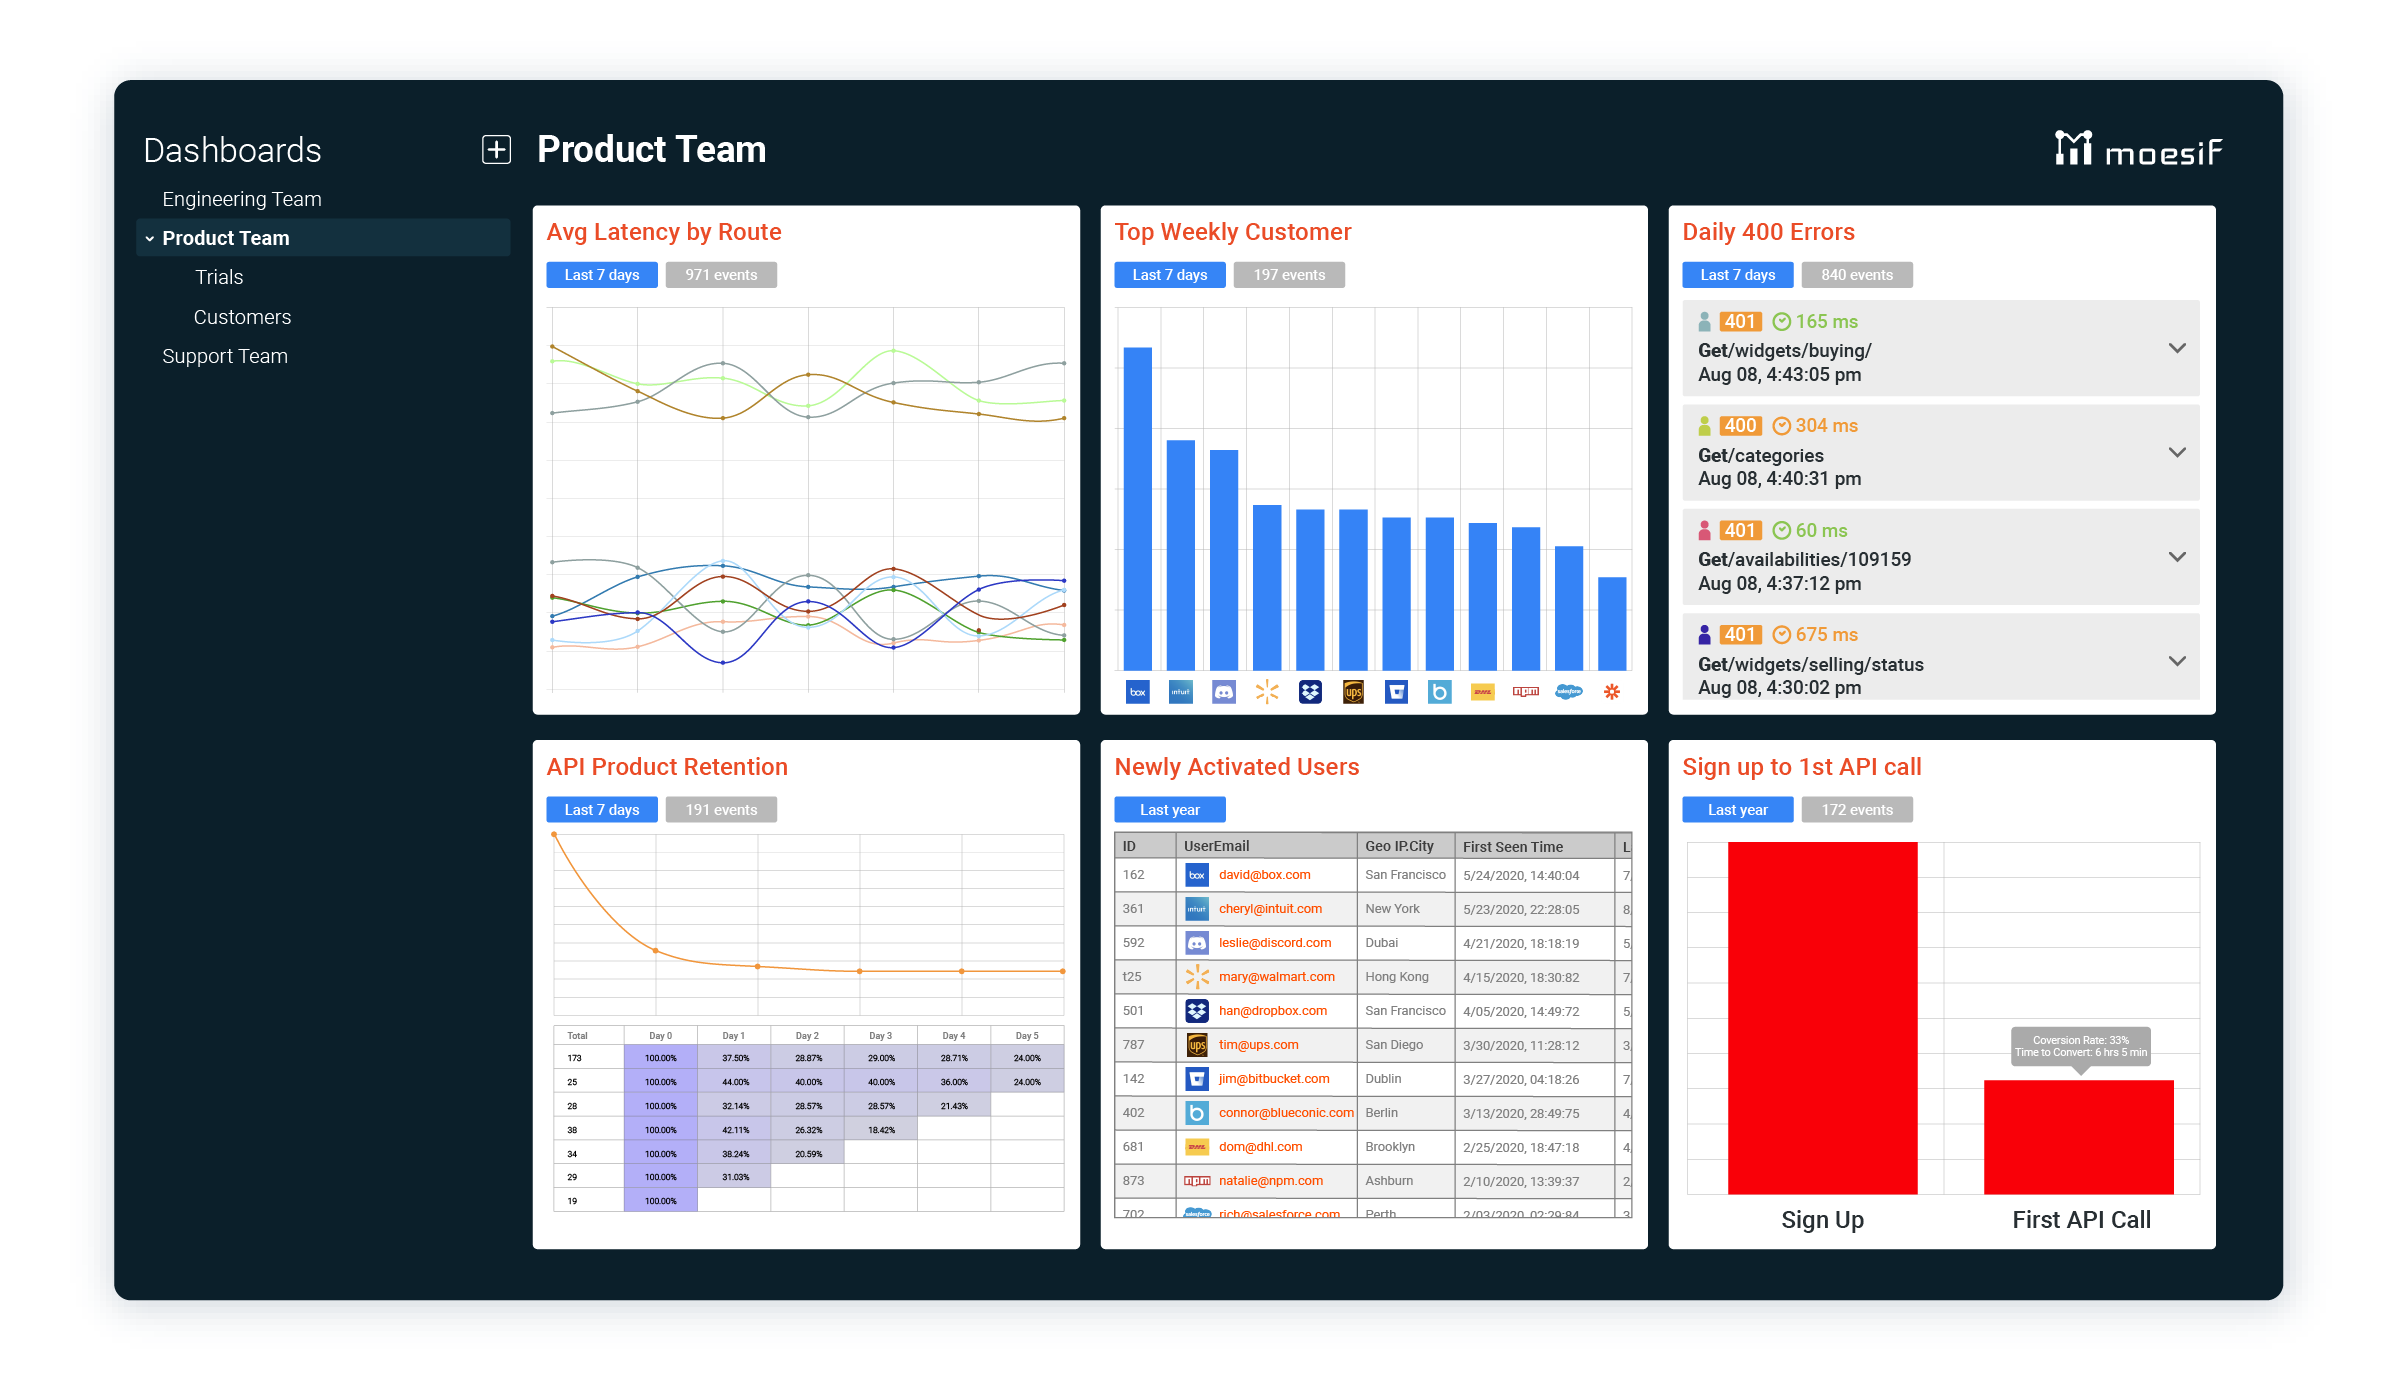
In the below image, we are able to track the customer journey and understand where they dropped. For this, we need to define criteria such as Time to First Hello World and Time to Valuable Action

Making API analytics actionable
In order to be actionable, end-users need the ability to created actions and workflows when specific criteria is reached. For example, an account exec or customer success manager can create an alert whenever a specific new user has a change in API traffic. A product manager can create a dashboard showing various metrics on unique active users and feature usage whereas a Chief Marketing Officer may want a dashboard showing which marketing channels are driving the most activations and how is conversion rates trending. This means an API analytics system should have an ability to create dashboards for each team consuming the service including sales, customer success, support, product, and marketing.
Obstacles to deploying API analytics
While deploying API analytics can have a tremendous impact to the growth trajectory of an organization deploying APIs, there are issues that organizations need to think about.
Maintenance cost
High-volume APIs can heavily tax a poorly designed analytics system. Teams are always oversubscribes which means shortcuts are taken when creating internal systems that are not exposed to customers, whether on scalability, security or both.
Compliance risk
Analytics systems can potentially track PII or sensitive information that is subject to regulation such as GDPR and CCPA. Having the correct processes and workflows in place to expire and remove data is critical when storing such data. In addition, robust access control should be in place to safeguard user data.
Ease of use
While technical users may be fine directly parsing logs and digging into time-series metrics in APM tools like Splunk and Datadog, the productivity of business users will drop if they are forced to adopt such tools. In such cases, extra burden is placed on engineering and data science teams to generate reports. Self-serve analytics is critical for any organization serious about agile development and speed of innovation.


Related Articles

API Development
Step-by-Step Blueprint to Create RESTful APIs for Efficient Web Services
Learn from server setup to securing data, ensuring your APIs are scalable and efficient.Dive into the details for a comprehensive understanding of designing,...
API Development
The AI API Gold Rush: How to Turn Your Models into Revenue With Moesif
Monetize your AI model by transforming it into an AI API, creating new revenue streams by integrating your AI capabilities into other applications. This guid...
API Development
Securing Access: A Guide to Implementing API Keys in AWS API Gateway
Discover how to generate, apply, and manage API keys in AWS API Gateway, ensuring effective authentication and robust access control for your services. Gain ...
API Development
Mastering API Gateway Auth: Proven Methods for Secure Connectivity
Secure your API gateway and protect your digital assets. Let’s cover essential authentication methods, challenges, and best practices for API gateway security.