Introducing Custom Functions and Formulas
At Moesif we are always looking for ways for our users to derive even more valuable insights from their data. We pride ourselves on the fact that there is something for everyone on the platform, whether it’s engineering, marketing, customer success, or even sales departments. Recently we added a new way to drill even further into your metrics: Custom Functions and Formulas!
Using custom formulas and functions can unlock new ways of looking at metrics. For instance, by using the Rolling Window custom function you can more easily plot engagement across various time intervals. You can also use the Rolling Average function to smooth out noisy metrics, making things more readable and digestible. Custom formulas can allow users to use different metrics in equations and plot them. Both new functionalities used together unlock many data science use cases that were previously unavailable. Let’s take a deeper dive into the specifics of what each new functionality is and how to use it in Moesif.

What are Custom Functions?
Custom Functions allow users to further augment their Custom Metrics within Time Series and Segmentation reports. Once you have created a custom metric, you are now able to apply even even functions against the selected metric. This includes applying common data science functions to the data such as a Rolling Window or Rolling Sum. You can also shift the data for a metric and further customize the custom function once you’ve added it. Available custom functions and their usages are listed below:
Rolling Window
Returns the metric for X previous windows. For example, use this when you want to see a 7-day rolling window of unique users.
Rolling Sum
Returns the sum of X previous intervals. For example, use this when you want to see the sum of the 2 previous periods.
Rolling Max
Returns the rolling maximum value of the metric for each overlapping window.
Rolling Min
Returns the rolling minimum value of the metric for each overlapping window.
Rolling Unweighted Average
Returns the rolling average for each overlapping window. For example, You may use this function to see how your customers; usage is trending vs their trend line. You could use the formula to subtract a customer’s daily event count from their 7-day rolling average to see how their usage is trending.
Rolling Linear Weighted Average
Returns the weighted average for each overlapping window where older data points contribute a linearly less amount to the total average.
Rolling Standard Deviation
Returns the standard deviation of a rolling average for each overlapping window. The averaging function can be either the unweighted average or the linear related average.
Exponentially Weighted Rolling Average
Returns the single exponential rolling average for each overlapping window where older data points become exponentially less important.
Double Exponentially Weighted Rolling Average
Returns the double exponential rolling average for each overlapping window where older data points become exponentially less important.
You can also shift the metric as well. The options for shifting the metric window include None, Shift Forward 1, and Shift Forward 2.
What are Custom Formulas?
Creating a Custom Formula allows you to use the values from other metrics or segments that you’ve defined and combine them into another metric via a formula. Now in Moesif Time Series and Segmentation reports, when you select the metrics you want to plot, each is assigned a letter to represent it. This can be used in the formula to create a new metric.
When you create a metric or segment in Moesif, it will be assigned a Letter value which would allow it to be referenced in a custom formula. For example, if you wanted to plot the average event count per unique user you would want to divide the overall event count by the number of unique users.
Average event count per user = event count / unique users
This could then be plotted to see if each unique user is trending up or down in usage and allow you to follow that trend over time. Of course, this is an extremely simple example but simple and even extremely complex formulas can now be added and plotted in Moesif. We believe that many data scientists and users looking for deeper support of formulas will rejoice at this addition to the platform!
Using Custom Functions and Formulas in The Real World
In the real world, a common use case for this new functionality would be for measuring DAU/WAU or DAU/MAU. What do these acronyms mean for those who are unfamiliar? Let’s break it down quickly:
DAU = Daily Active Users
DAU is the number of unique users who did some action each day
WAU = Monthly Active Users
WAU measures the unique users who completed an action each week
MAU = Monthly Active Users
MAU is the number of unique users who completed an action within a month
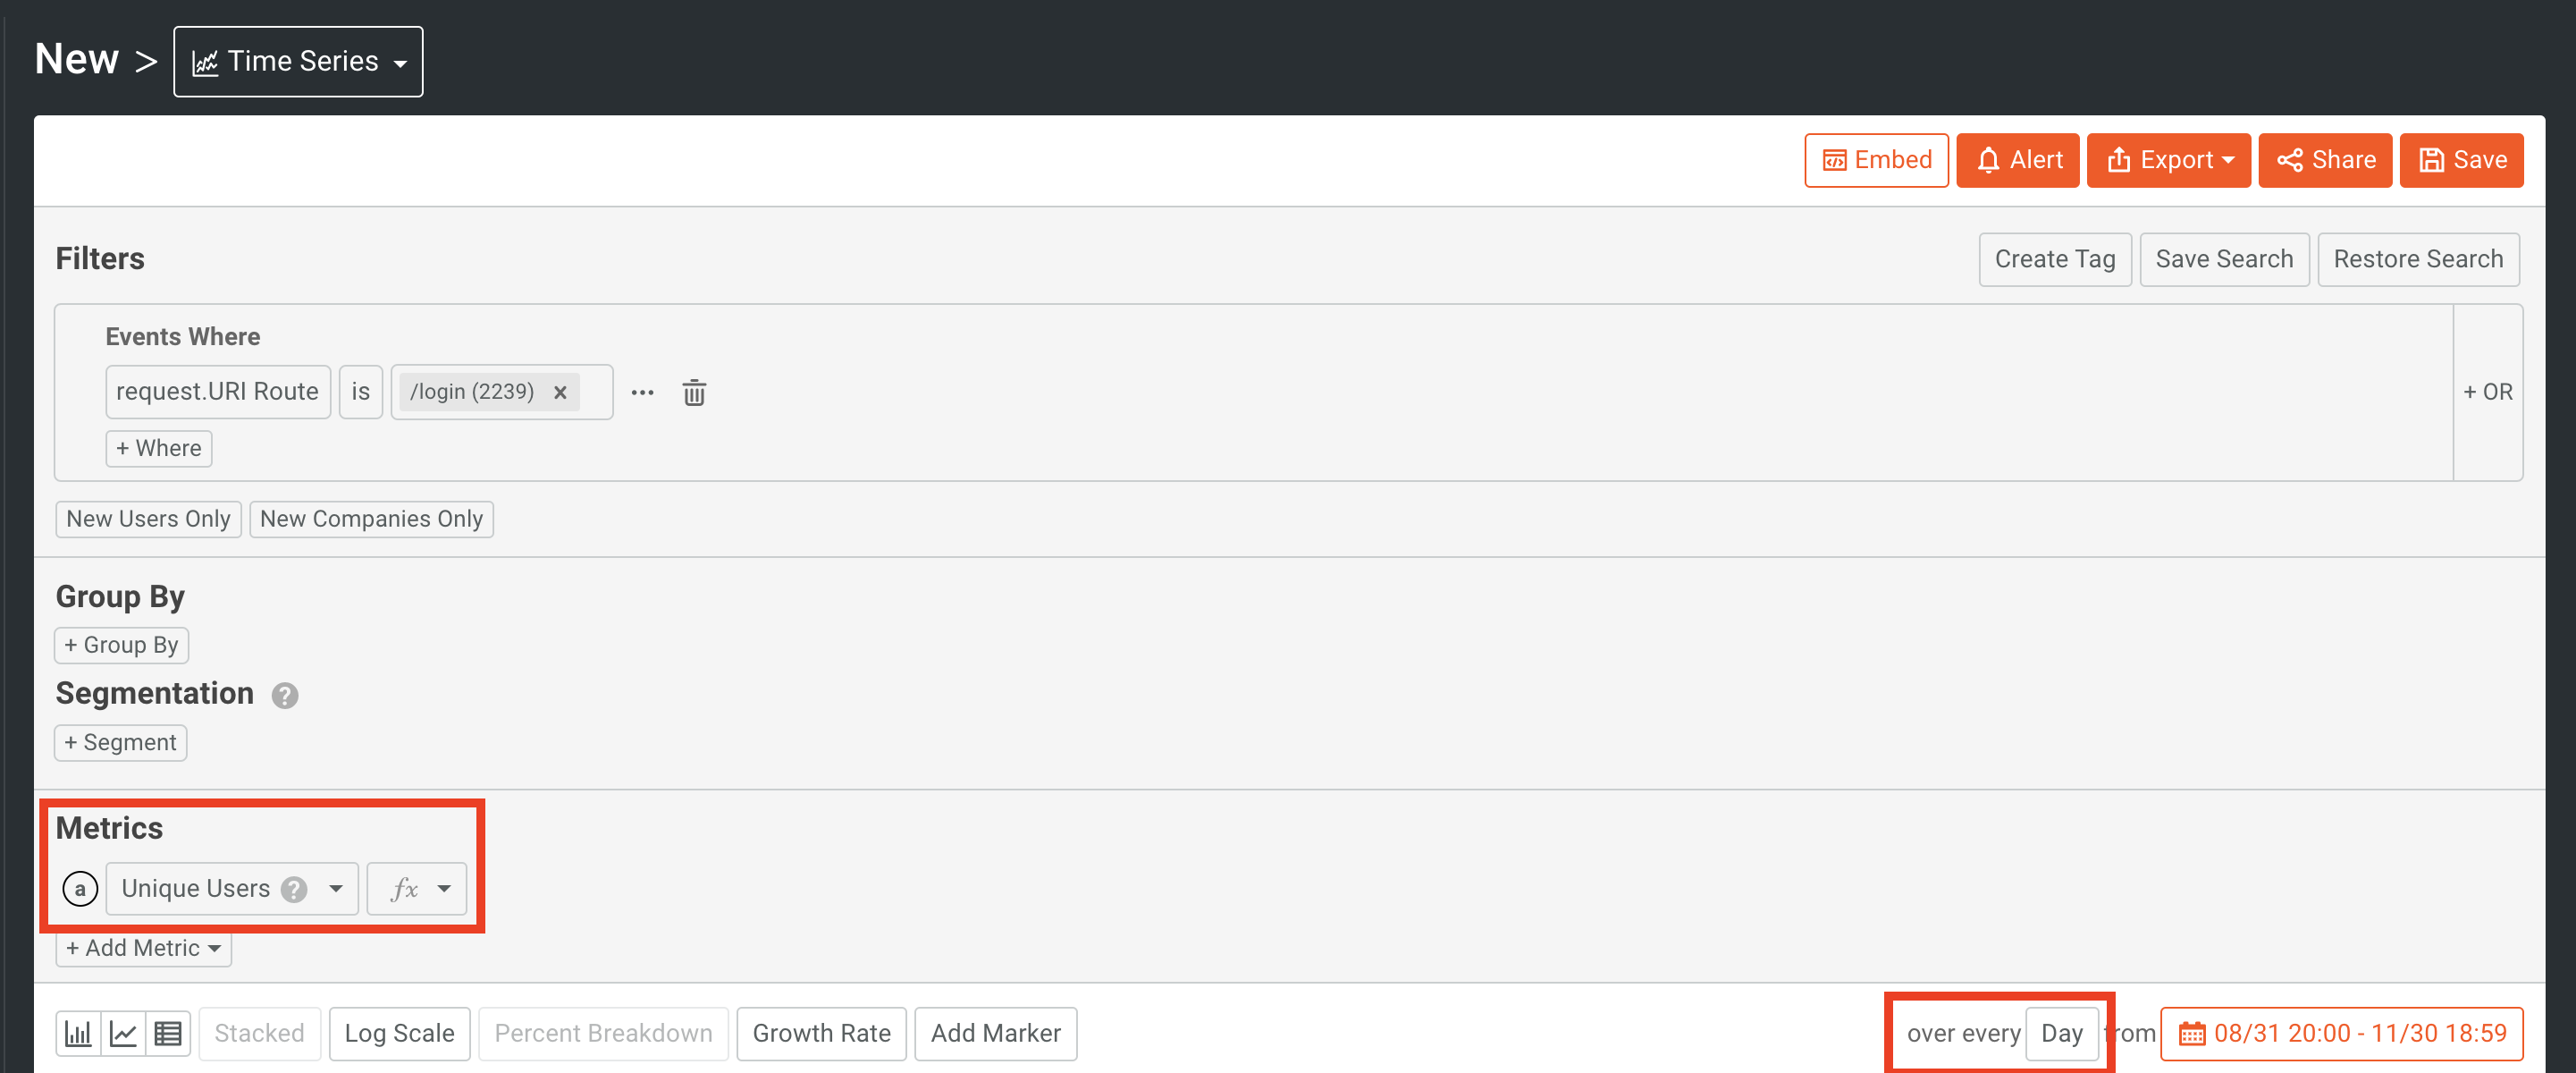
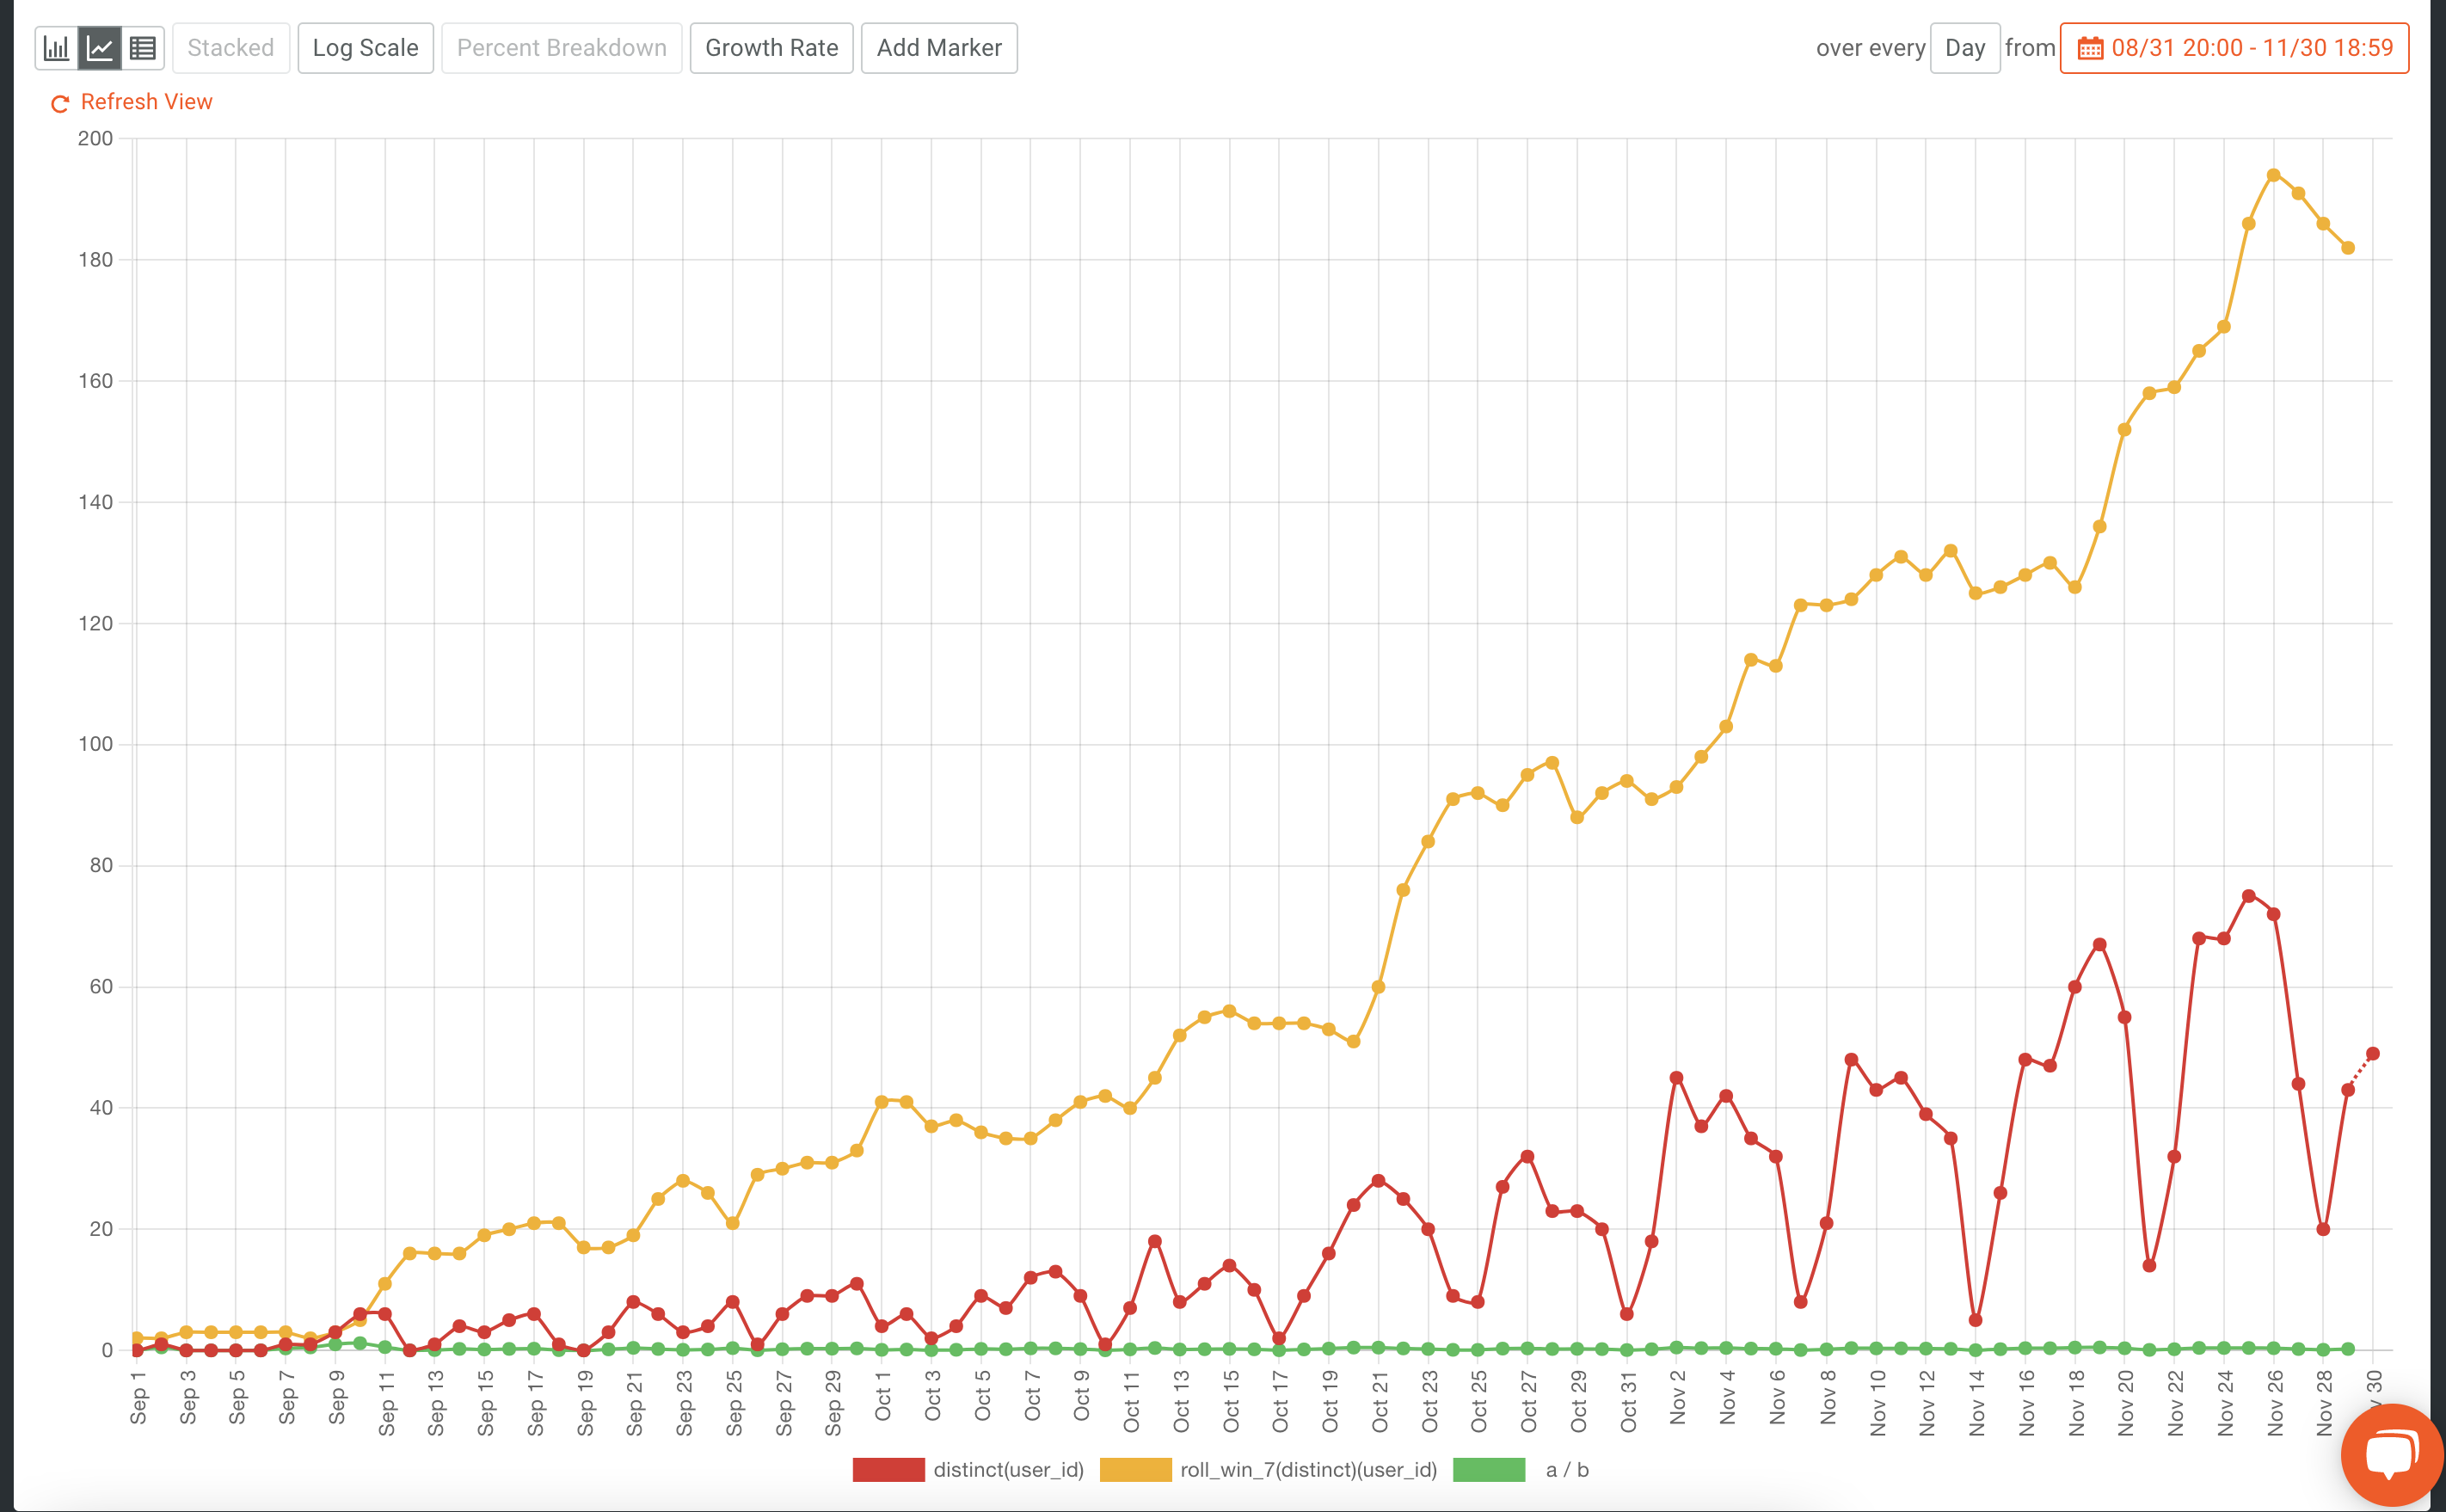
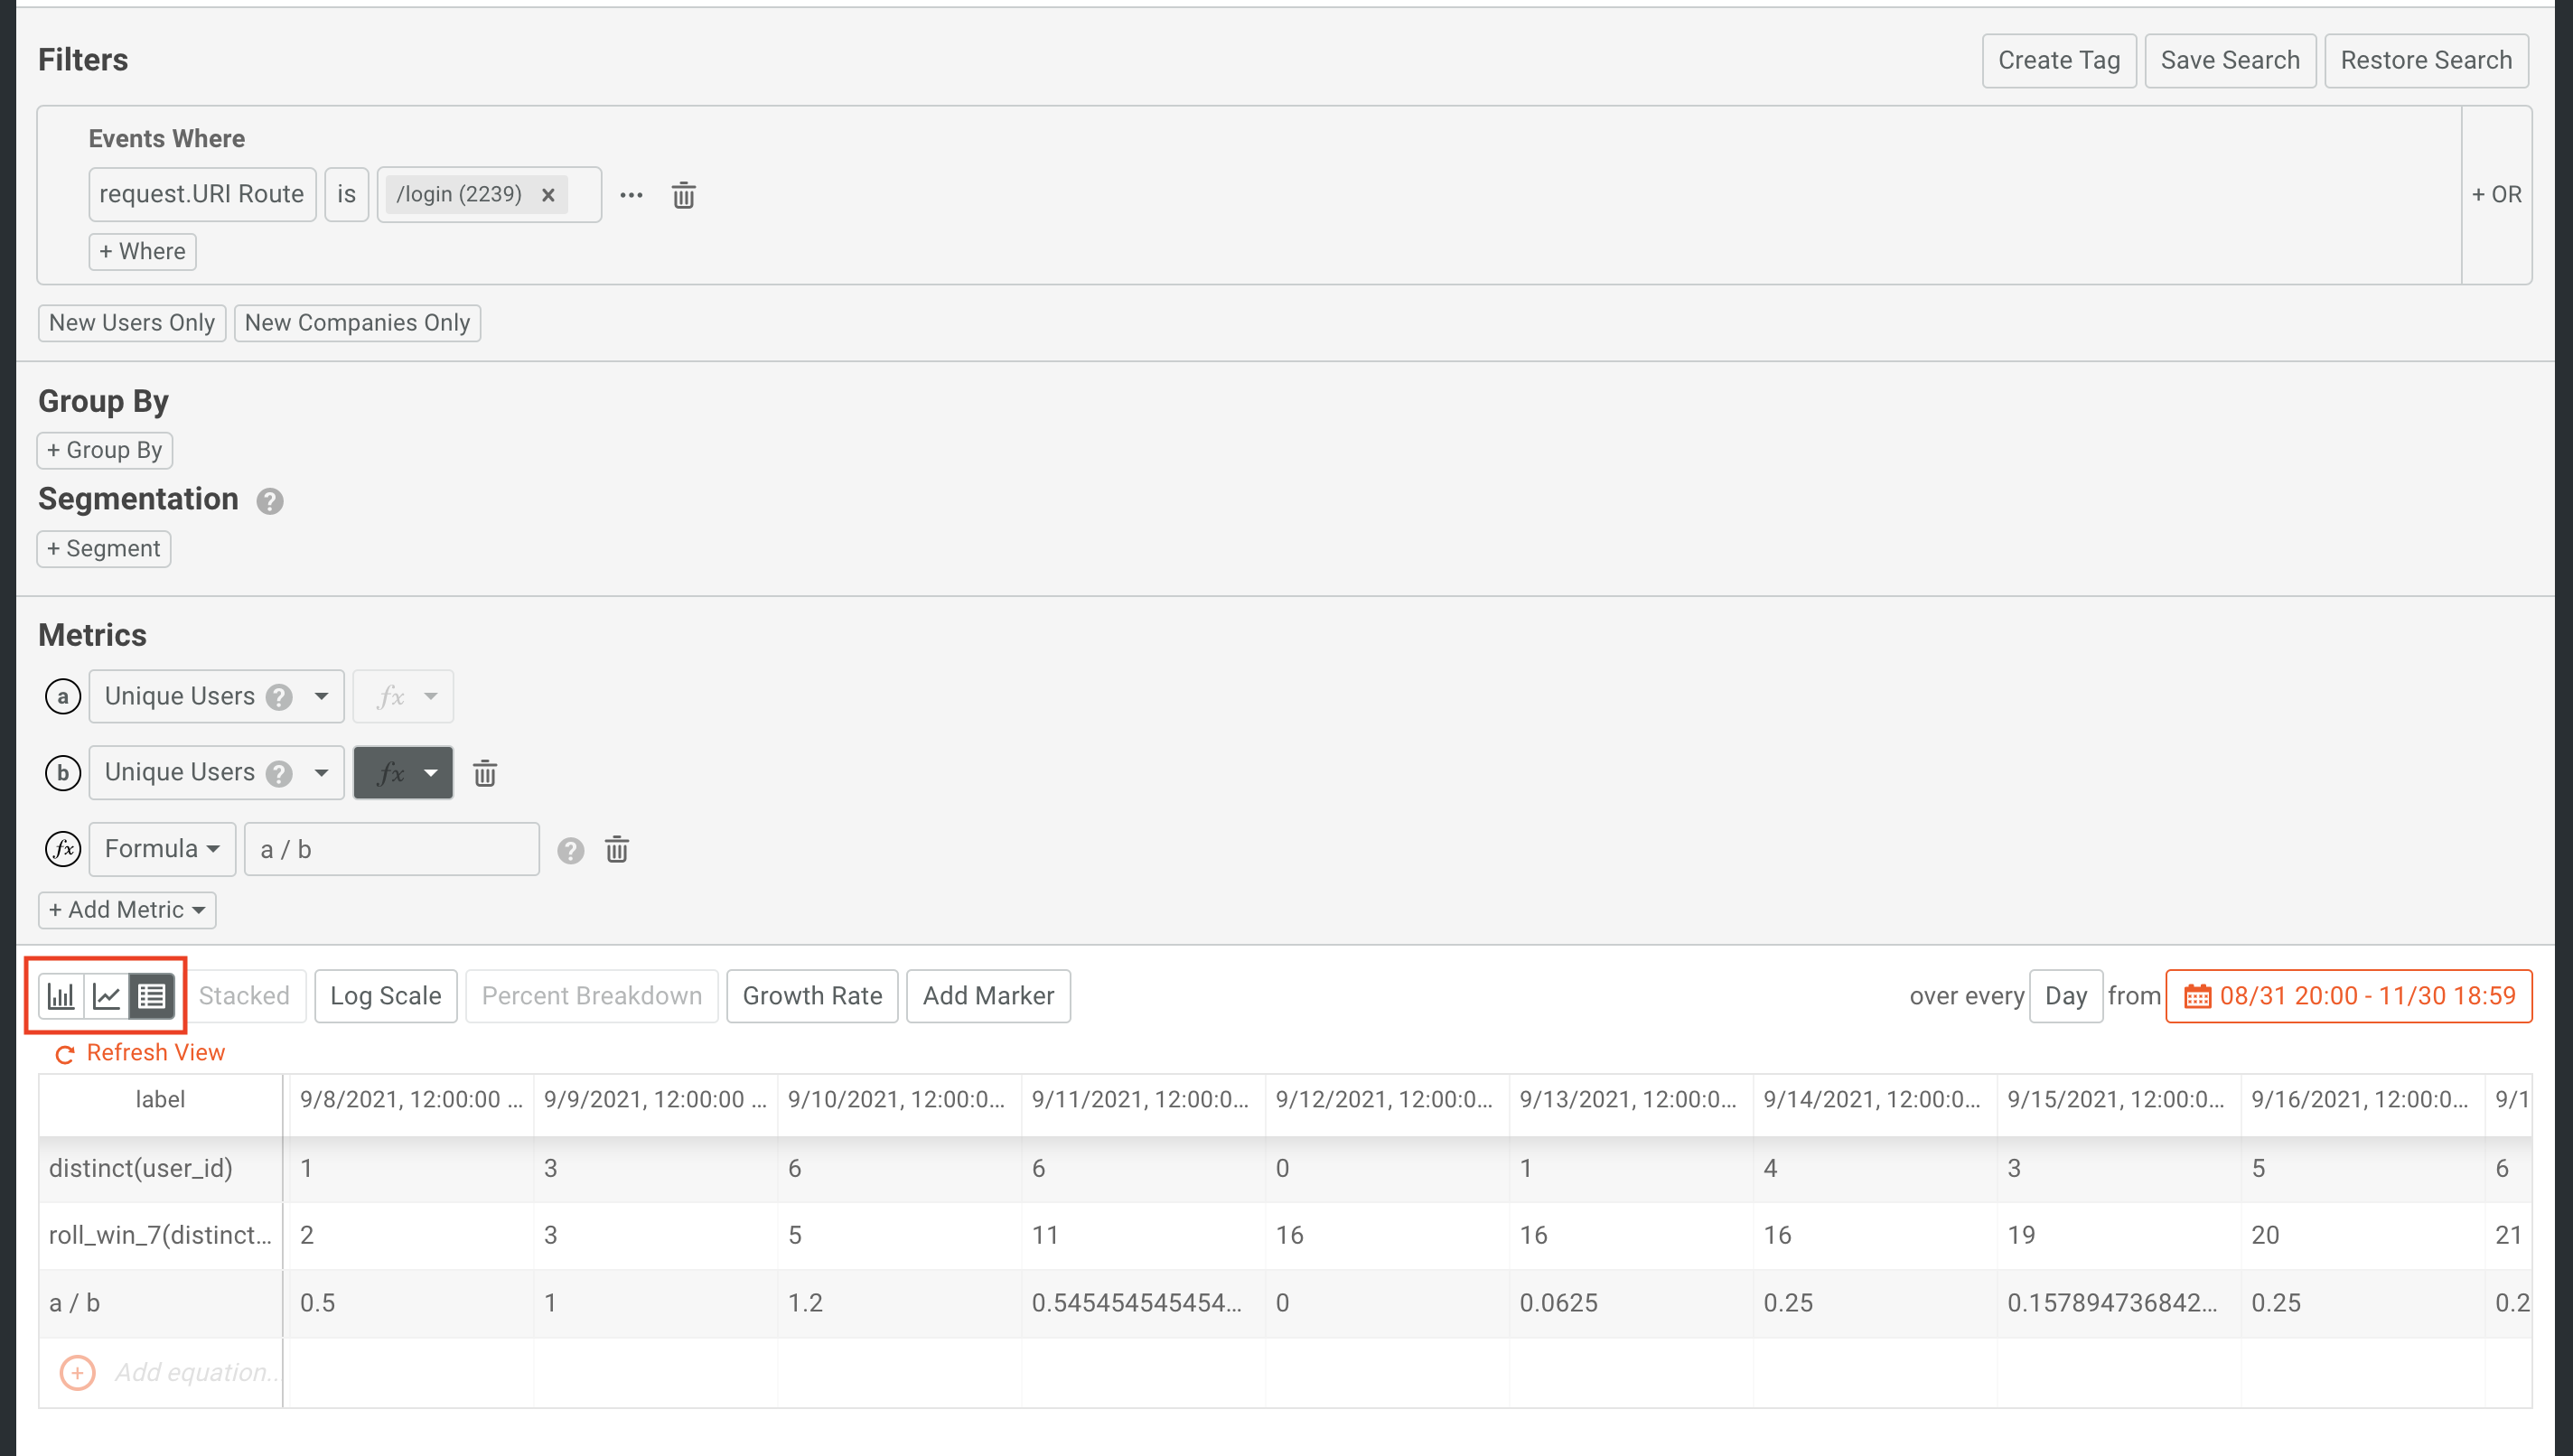
Now, let’s create a chart in Moesif to display a comparison between DAU and WAU. To do this, create a new Time Series chart. In this example, we will use the /login endpoint as a marker for a user being active. This will be the filter and pick the metric as Unique Users. Ensure Daily is selected as the interval.
Next, add a 2nd metric and pick Unique Users again. This time, also select the Rolling Window function from the Function dropdown and set the interval to 7 days. Setting it this way will plot the weekly unique users on a rolling basis for each day. if you want to compare DAU with MAU, you can simply change the rolling window to a 30-day interval.
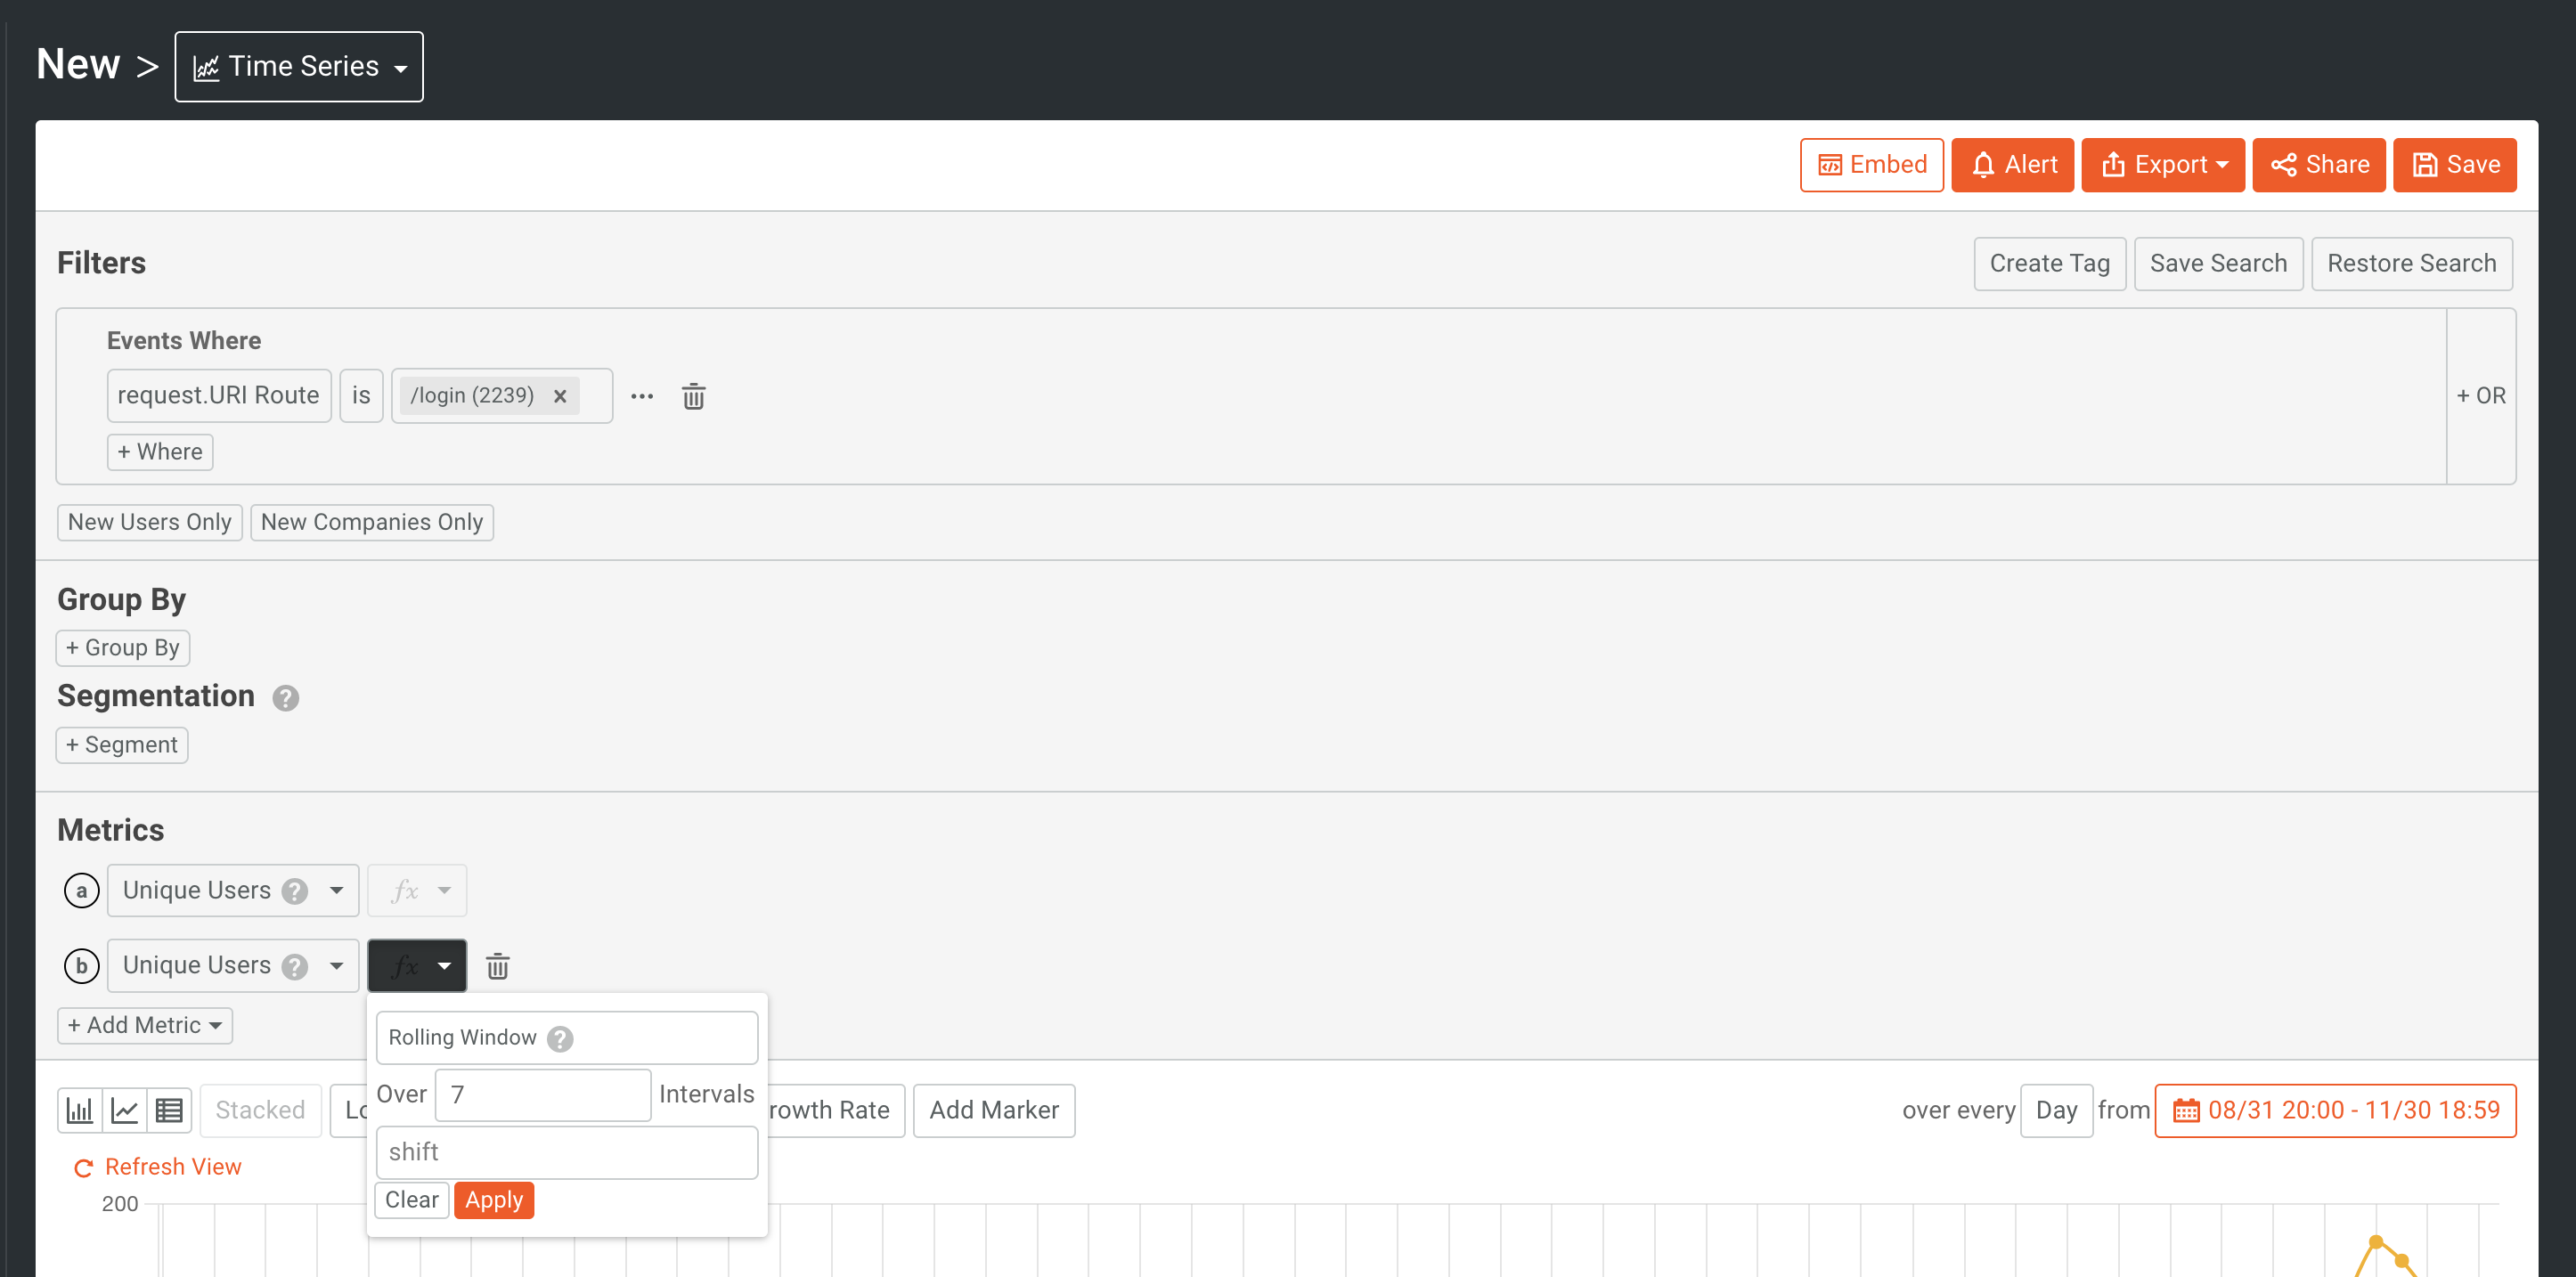
You can also select if you’d like to shift the metric at this time as well. The options for shifting the metric window include None, Shift Forward 1, and Shift Forward 2. For this example, we will keep the shift equal to the default value of None. Once input, click Apply.
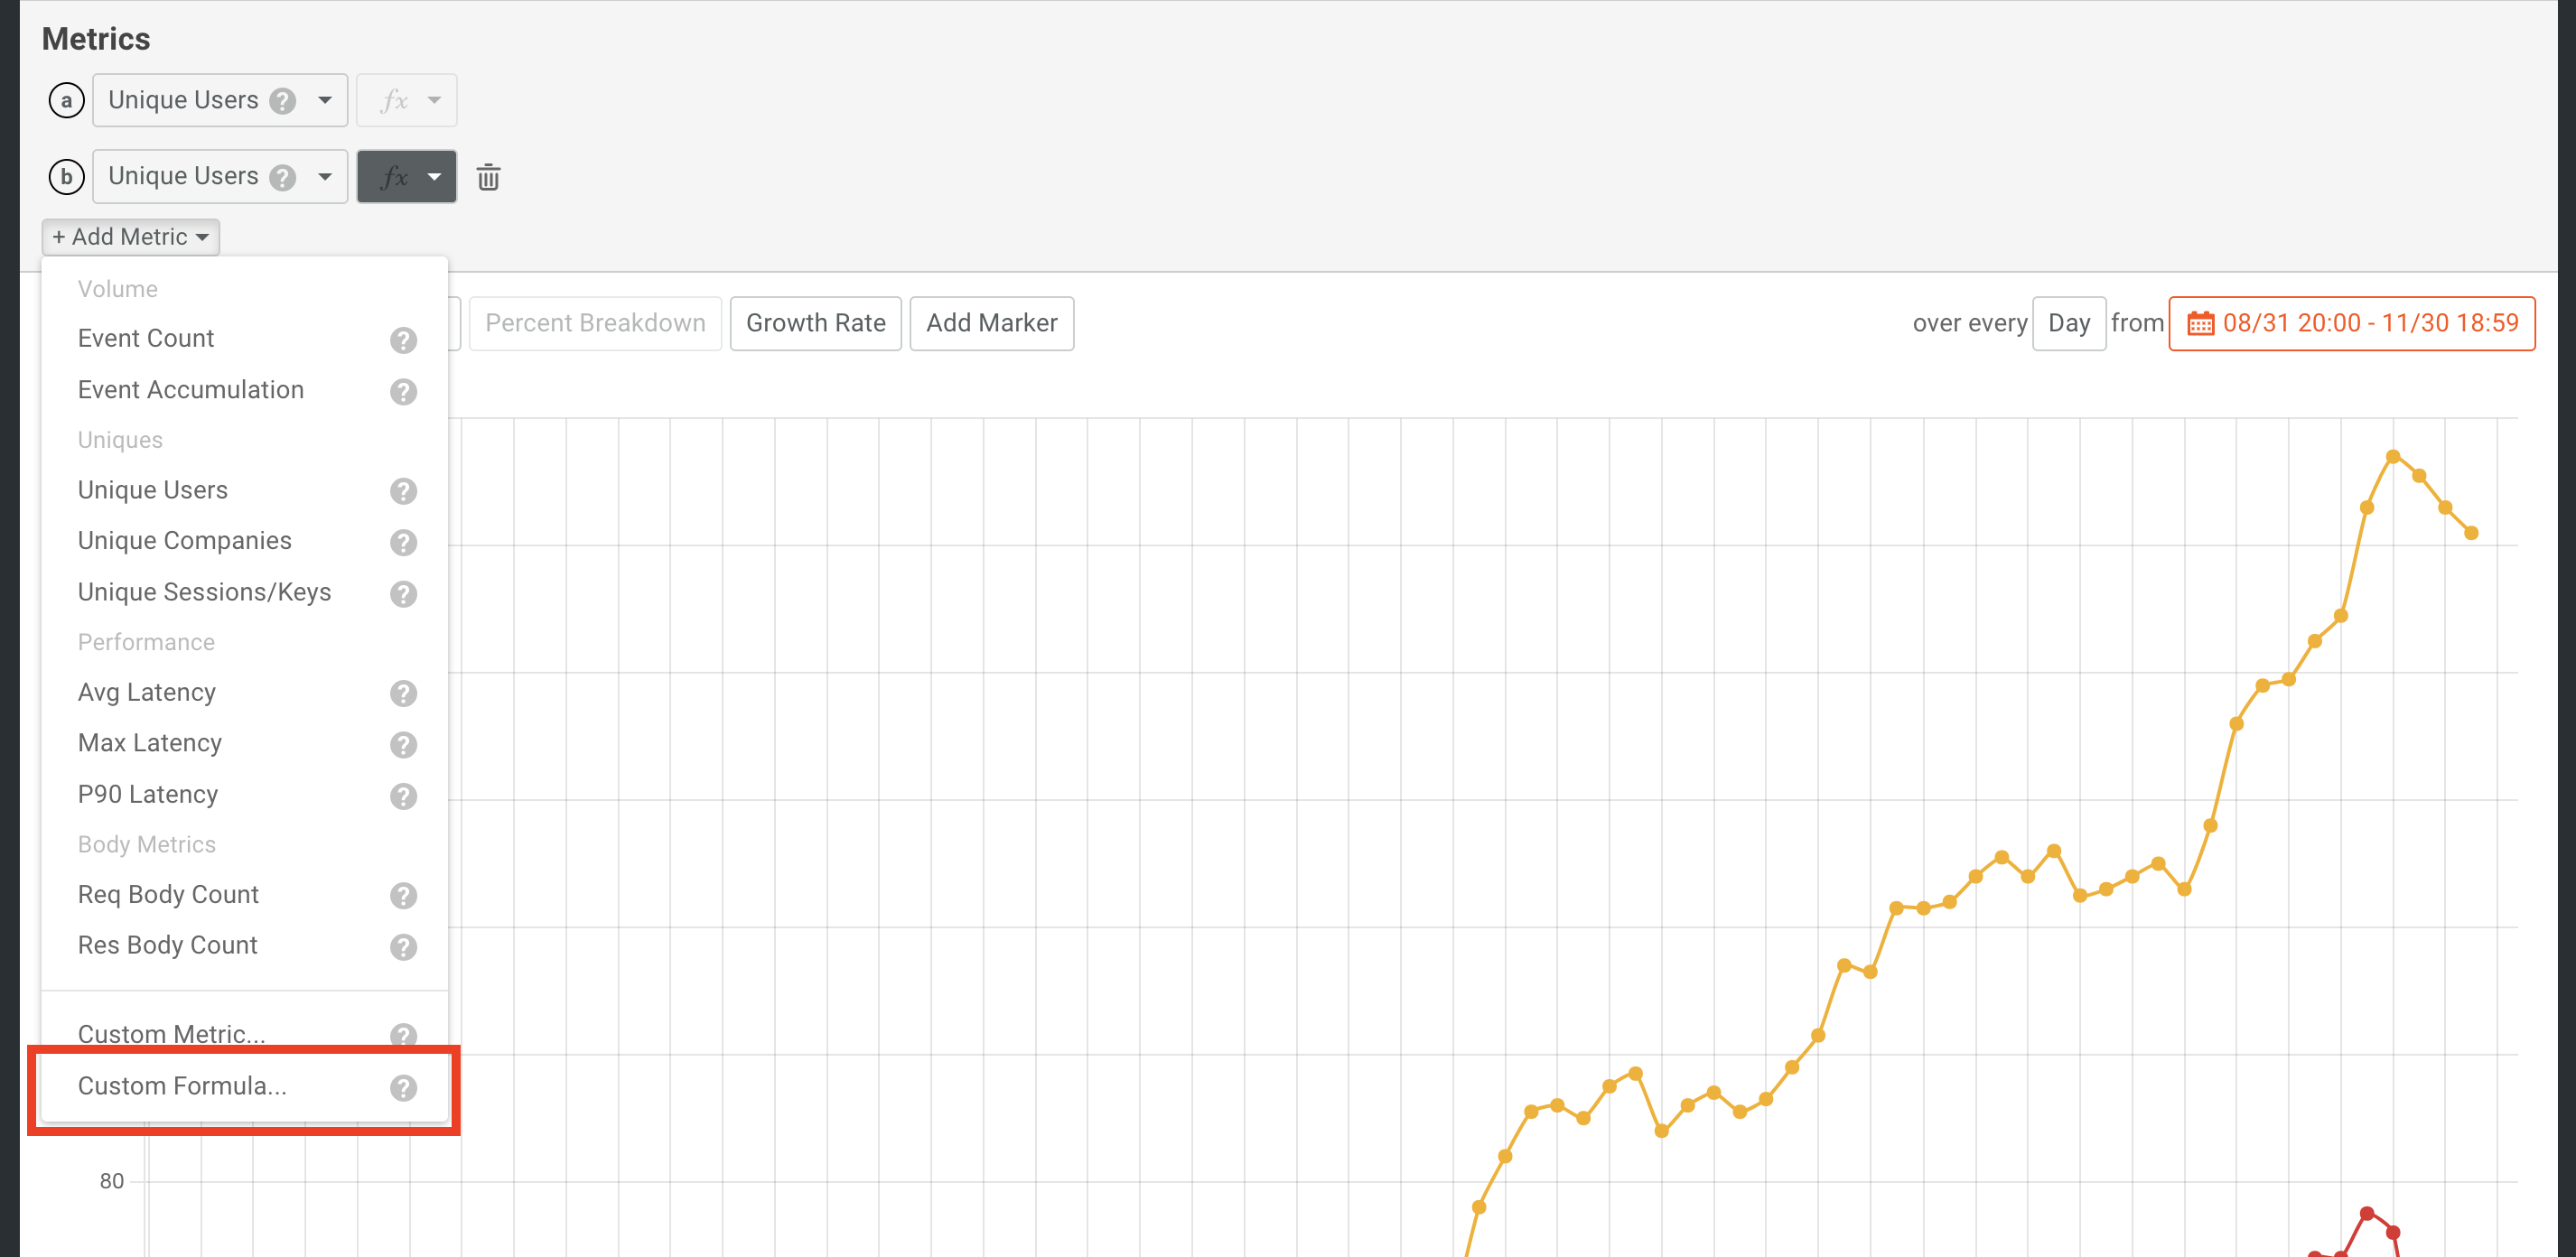
Lastly, add a Custom Formula by clicking Add Metric again and selecting Custom Formula.
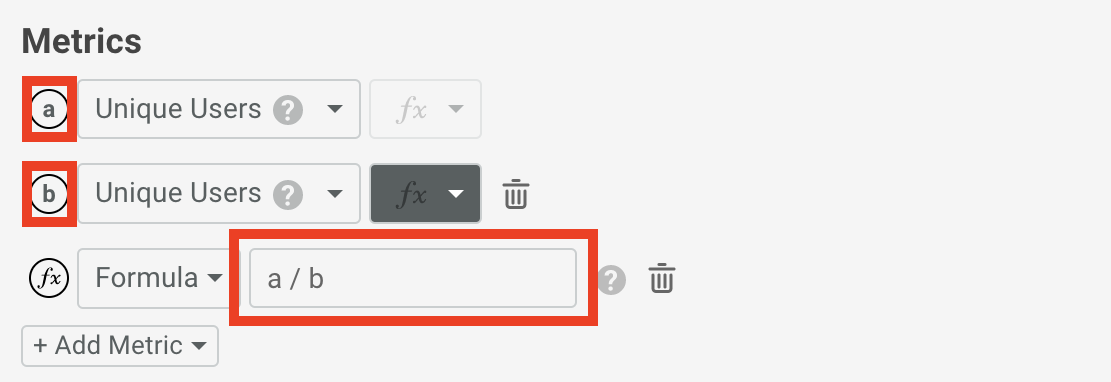
In the formula input, you will want to divide the DAU by the WAU. You can do this by inputting a / b. The letters used in the formula reference the letters assigned to each metric, shown to the left of each.
You can also refer to Segments in the custom formula as well by using the Segment Name. To use Segments as part of your formula, use the following syntax:
[SEGMENT_NAME].[METRIC_LETTER]
Once all of these filters and inputs are set, the results will be shown on the time series.
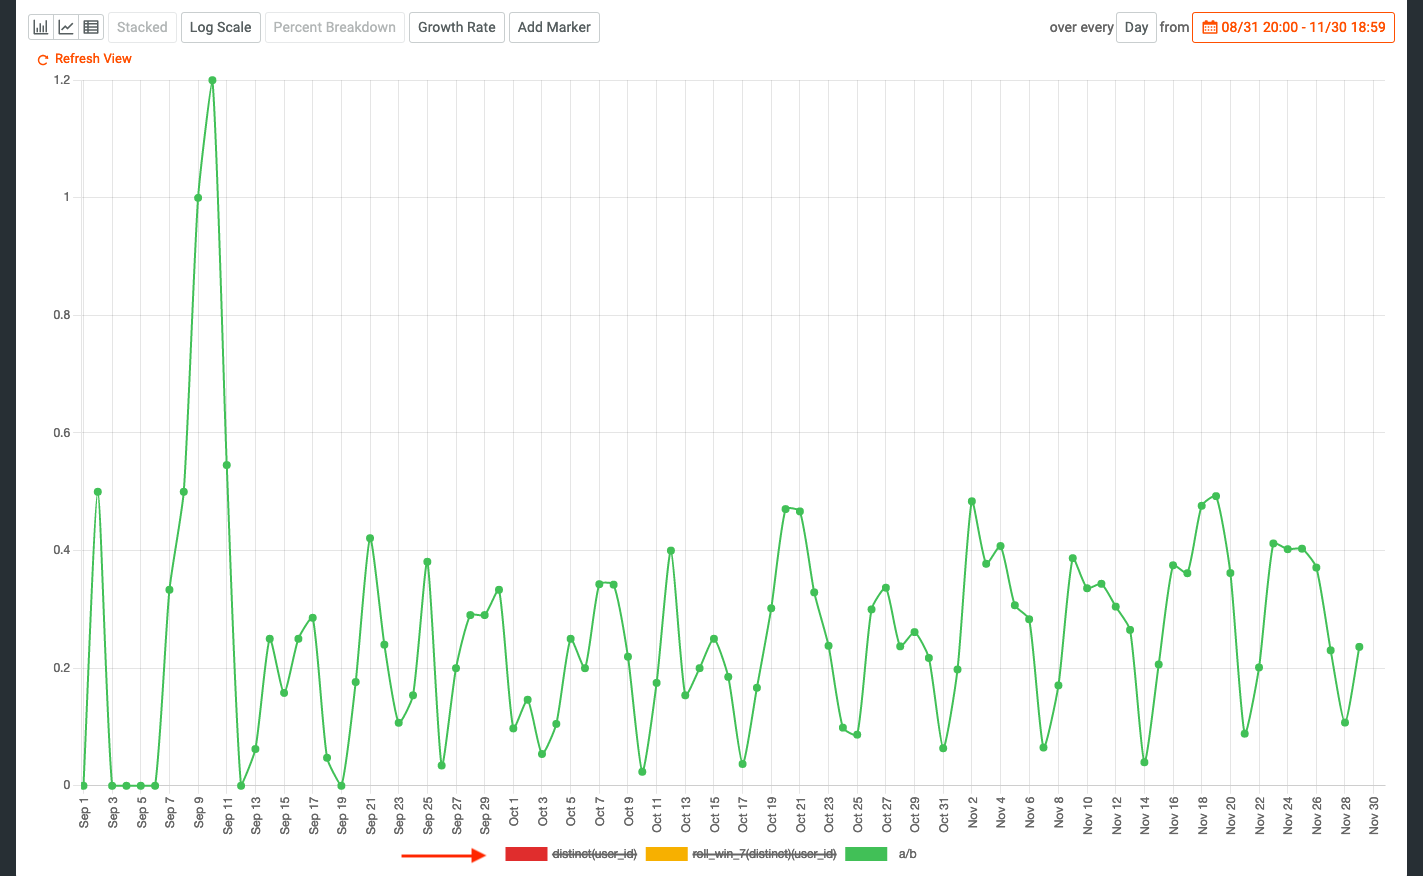
The DAU and WAU bars can be hidden by deselecting them on the bottom of the graph allowing the green bar, the results of our DAU/WAU calculation, to be meaningfully presented.
You can also flip over to the table view so that the amounts can be interpreted in another way.
At this point, we can now use the results to interpret trends. By using both custom functions and custom formulas, we have created some new metrics to track. The possibilities are endless and many new variations can be created to explore new metrics and trends in your API and business data.
Try It Out Today
This feature is now fully available on the Moesif platform and ready for our users to try out! If you want to dig into things a bit further you can check out our docs that show how to use the new functionality in a Time Series or Segmentation report. Using Custom Functions and Formulas can help you to derive insights and enhance your reporting capabilities. Don’t have a Moesif account? Sign up today to get started!
«««< Updated upstream

=======


Stashed changes

Related Articles

API Strategy
Leveraging AI For a Better API Strategy
Learn how to leverage AI to build and fortify your API strategy. Improve design, governance, documentation, and align APIs with business outcomes.
API Strategy
The 5 Best Mixpanel Alternatives of 2025
Learn about the best Mixpanel alternatives to determine the right analytics solution for your use case.

API Development
How to Leverage Moesif Effectively for API Observability
Effectively leverage Moesif for API observability through best practices for integration, event enrichment, custom actions, and engineering workflow integrat...
API Strategy
How to Build an Internal Chargeback Model for Your API and AI Usage Using Moesif
Use Moesif to implement internal chargebacks and enable precise API and AI cost attribution for better transparency and resource optimization.