How Can Moesif Help You Understand API Usage?
Are you looking to grow your business? Deliver more value to your customers? Well, understanding API usage should be at the top of your priority list, right after the ability to track API usage metrics and API monitoring.
By using Moesif for understanding your customer’s API usage, you can unlock many different insights, such as
- Your most popular APIs
- Which APIs are having the most errors
- How individual users and companies are using your APIs
- And much more…
Understanding these key insights can help make informed business and engineering decisions. With Moesif, there are many different ways you can slice and dice API analytics to reveal multiple angles of API usage. Not only that, but you can also use certain features to take action to improve retention and drive even more usage from users while driving down errors.
Let’s take a look at some of the features in Moesif that can help with understanding and improving API usage.
Charts
Docs for exploring different Metric reports can be found here
Being able to visualize API usage is a great way to bring context to the data and make it more digestible. A core focus of Moesif is to provide easily configurable charts which enable users to really drill down into specifics with custom metrics. This is done by applying filters to the data to get the exact output you want. For example, you may want to see a Time Series chart that shows error trends for the last 2 weeks across all your APIs. You may want to dig even further and look at 401 errors that occurred when users from a specific company tried to access a certain endpoint in the last 12 hours. Being able to dial in precisely what you need is what Moesif does best.
Although lots of different charting styles are available, let’s review the 2 most popular ones that can help to understand key API metrics and improve API retention.
Live Event Log
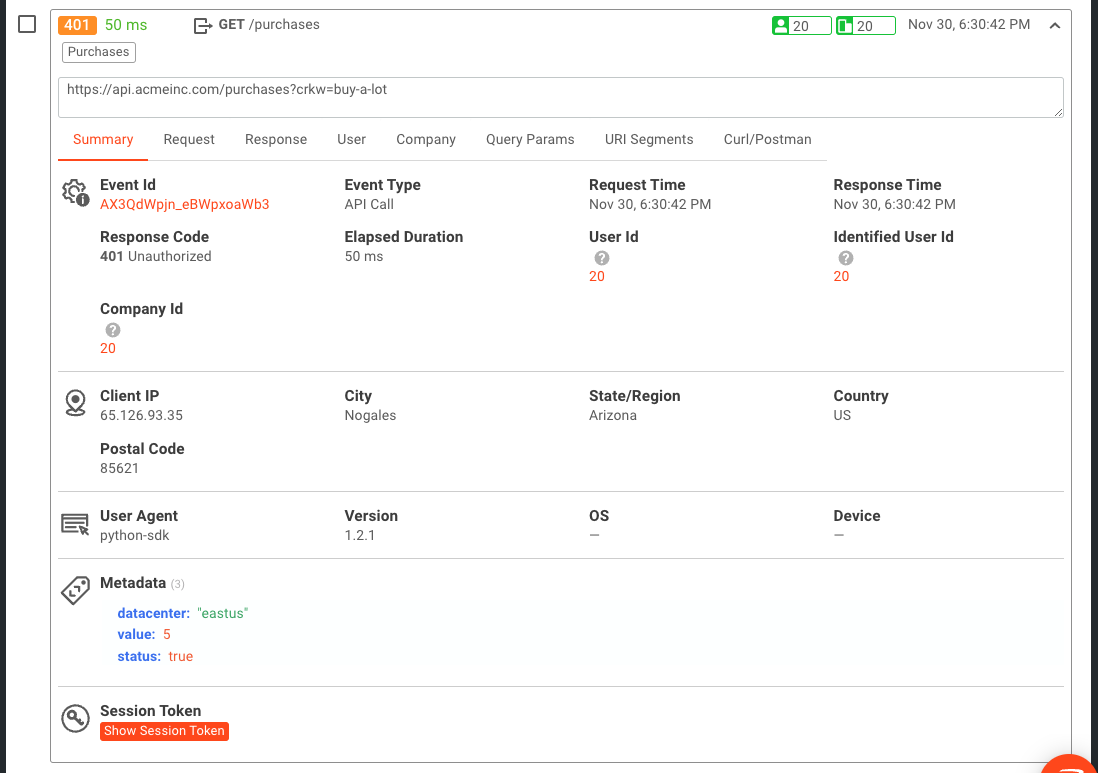
The Live Event Log is a great way to see and dive into each individual event coming into Moesif. By clicking on each event, you can explore all the details about the request and response. This is much more efficient than looking through plain-text API logs.
You can also easily dig into the user and company profile attached to the event if you have User and Company tracking set up and enabled. To show a quick example of how the Live Event Log can be used, let’s filter some demo data to identify unsuccessful API calls that are occurring on the /purchase route.
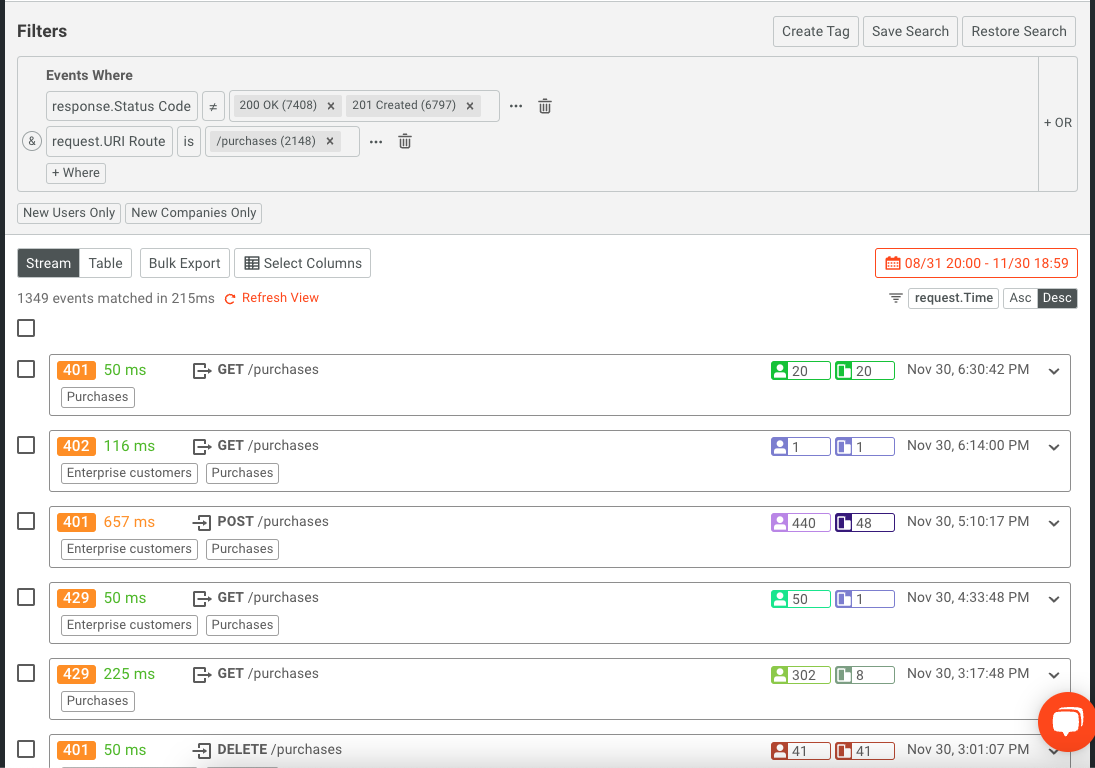
You can see here that we can easily see which calls are erroring out and can even inspect or generate a sample API request to replay the request for troubleshooting or testing purposes.
The benefit of using the Live Event Log to understand API usage metrics is that each event can be seen and interacted with. It’s a great way to troubleshoot issues and see trends that need to be explored at the most fine-grained levels.
Time Series
For looking at trends over time, a Time Series chart is the best way to visualize this. With a Time Series, you will determine which events you want to track and then let Moesif display the trends over a set period of time. An example of this might be that we want to look at the top 5 endpoints where unsuccessful API calls are happening and view that trend over time. Here is an example of what that may look like below.
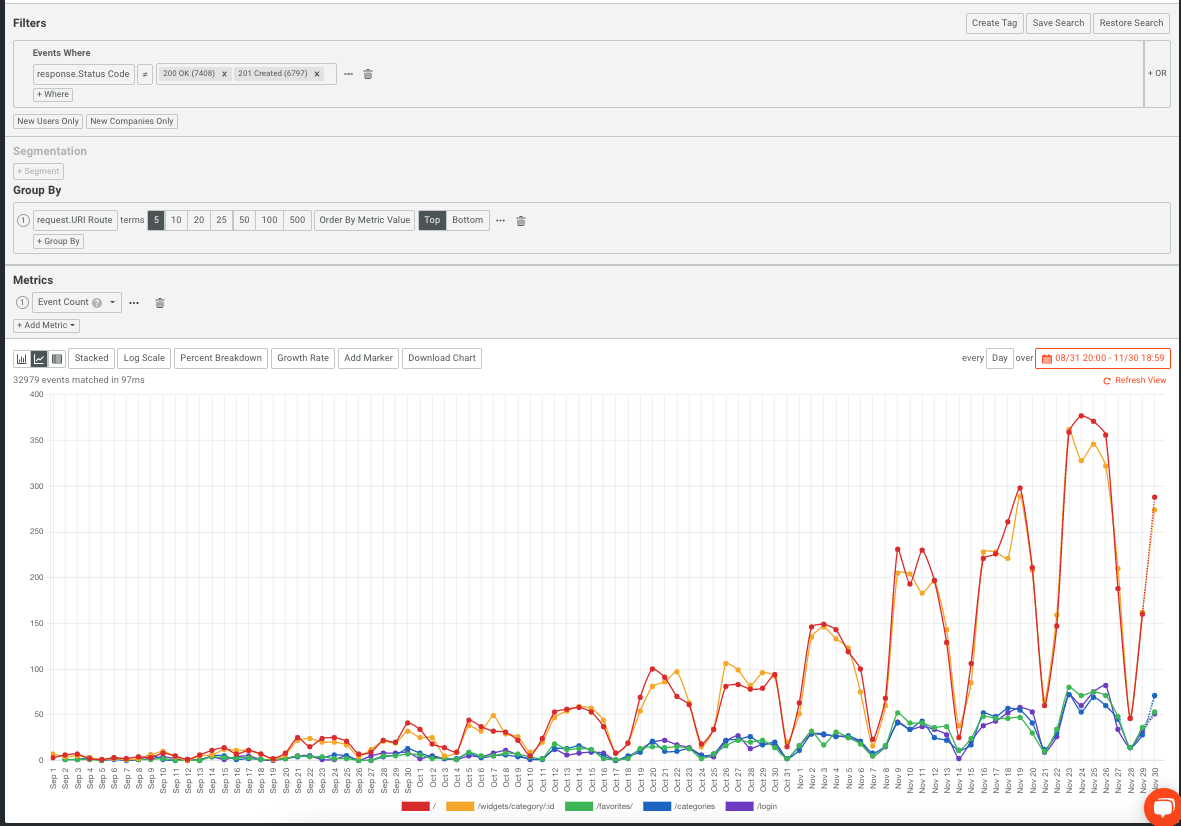
The Time Series chart allows you to visually see trends more easily while the Live Event Log allows you to dig into each individual API call. Both charts can be extremely useful in understanding your API usage data and exploring each call in detail.
Dashboards
Docs for Dashboards can be found here
Now that you’ve found some charts that are helping you look deeply at API metrics within your organization, let’s bring them all into one place. Dashboards within your API monitoring tool allow you to bring all of your favorite charts together in one spot for easy viewing and management. If you have multiple aspects of API product metrics that you’d like to view in a single place, a dashboard is the way to do it.
Default dashboards
When you first create your Moesif account, your Moesif instance will be populated with a few dashboards out of the box. These dashboards cover the core areas of most businesses and are prepopulated with workspace tiles that may be helpful in each area. The areas include:
- Product
- Engineering
- Security
- Customer Success
- Sales
- Marketing
As an example, in the Product dashboard that comes by default, we can see the included workspace tiles.
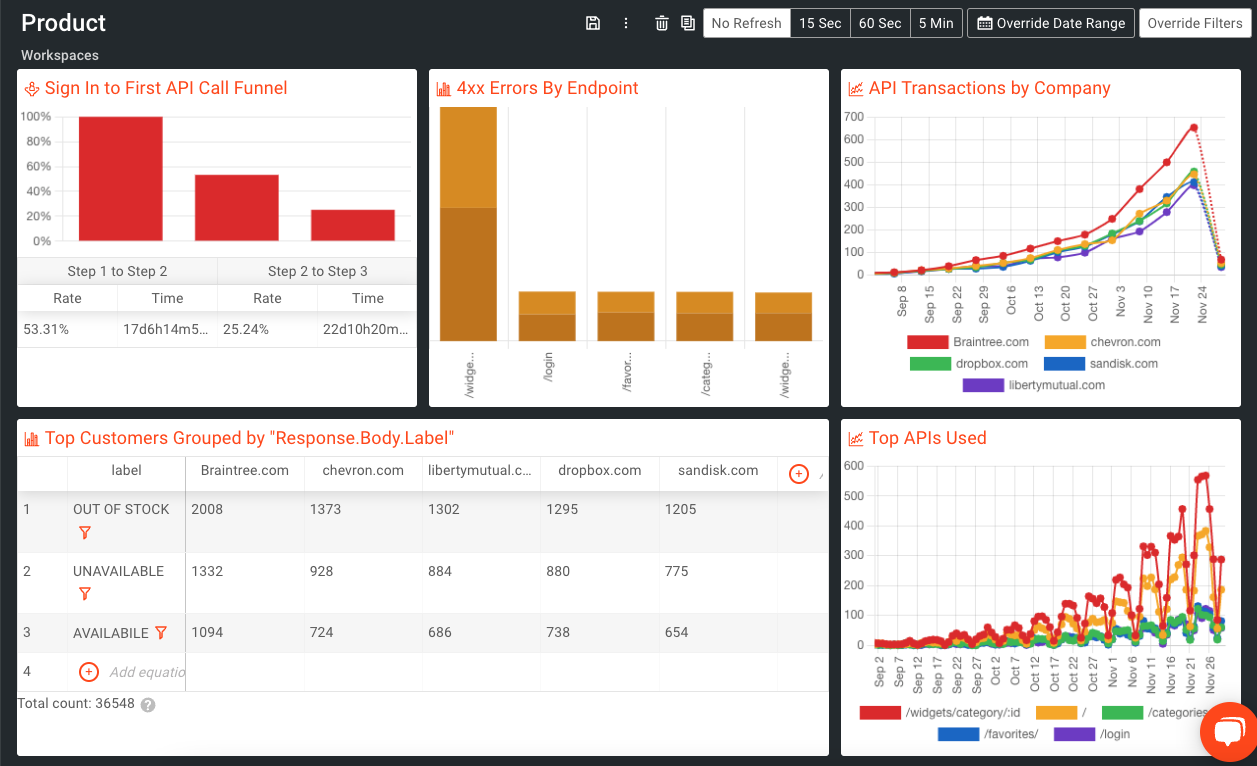
These can act as a great starting point where you can add more workspace tiles based on the charts and reports you like or you can edit each of the tiles to be more tailored to your specific use case.
Custom dashboards
If the dashboards included by default with Moesif are not exactly what you need or you just feel like creating something from scratch, custom dashboards can also be created. Custom dashboards are a great way to create streamlined ways to access your favorite charts and reports that are more tailored to your exact needs. For specifics on creating Dashboards, including custom ones, check out our docs.
User and company tracking
Docs for User and Company tracking features can be found here
A major differentiator between Moesif and other analytics platforms is the ability for Moesif to tie every event to a user and/or a company with real user monitoring. This opens up a lot of deep analytics use cases that are not possible when looking at large data sets which are only looking at events anonymously.
Two of the most popular features to use with User and Company tracking are Funnel and Retention analysis. Both can provide answers about how customers are using the product, how effective your onboarding is, current user performance, and if users are leaving your product. Let’s take a closer look at both of these features.
Funnels
Funnels allow Moesif users to see how each step in their conversion funnel is working. For most businesses, this can give very important hints about what should be improved and how the latest improvements are improving or hindering the conversion process.
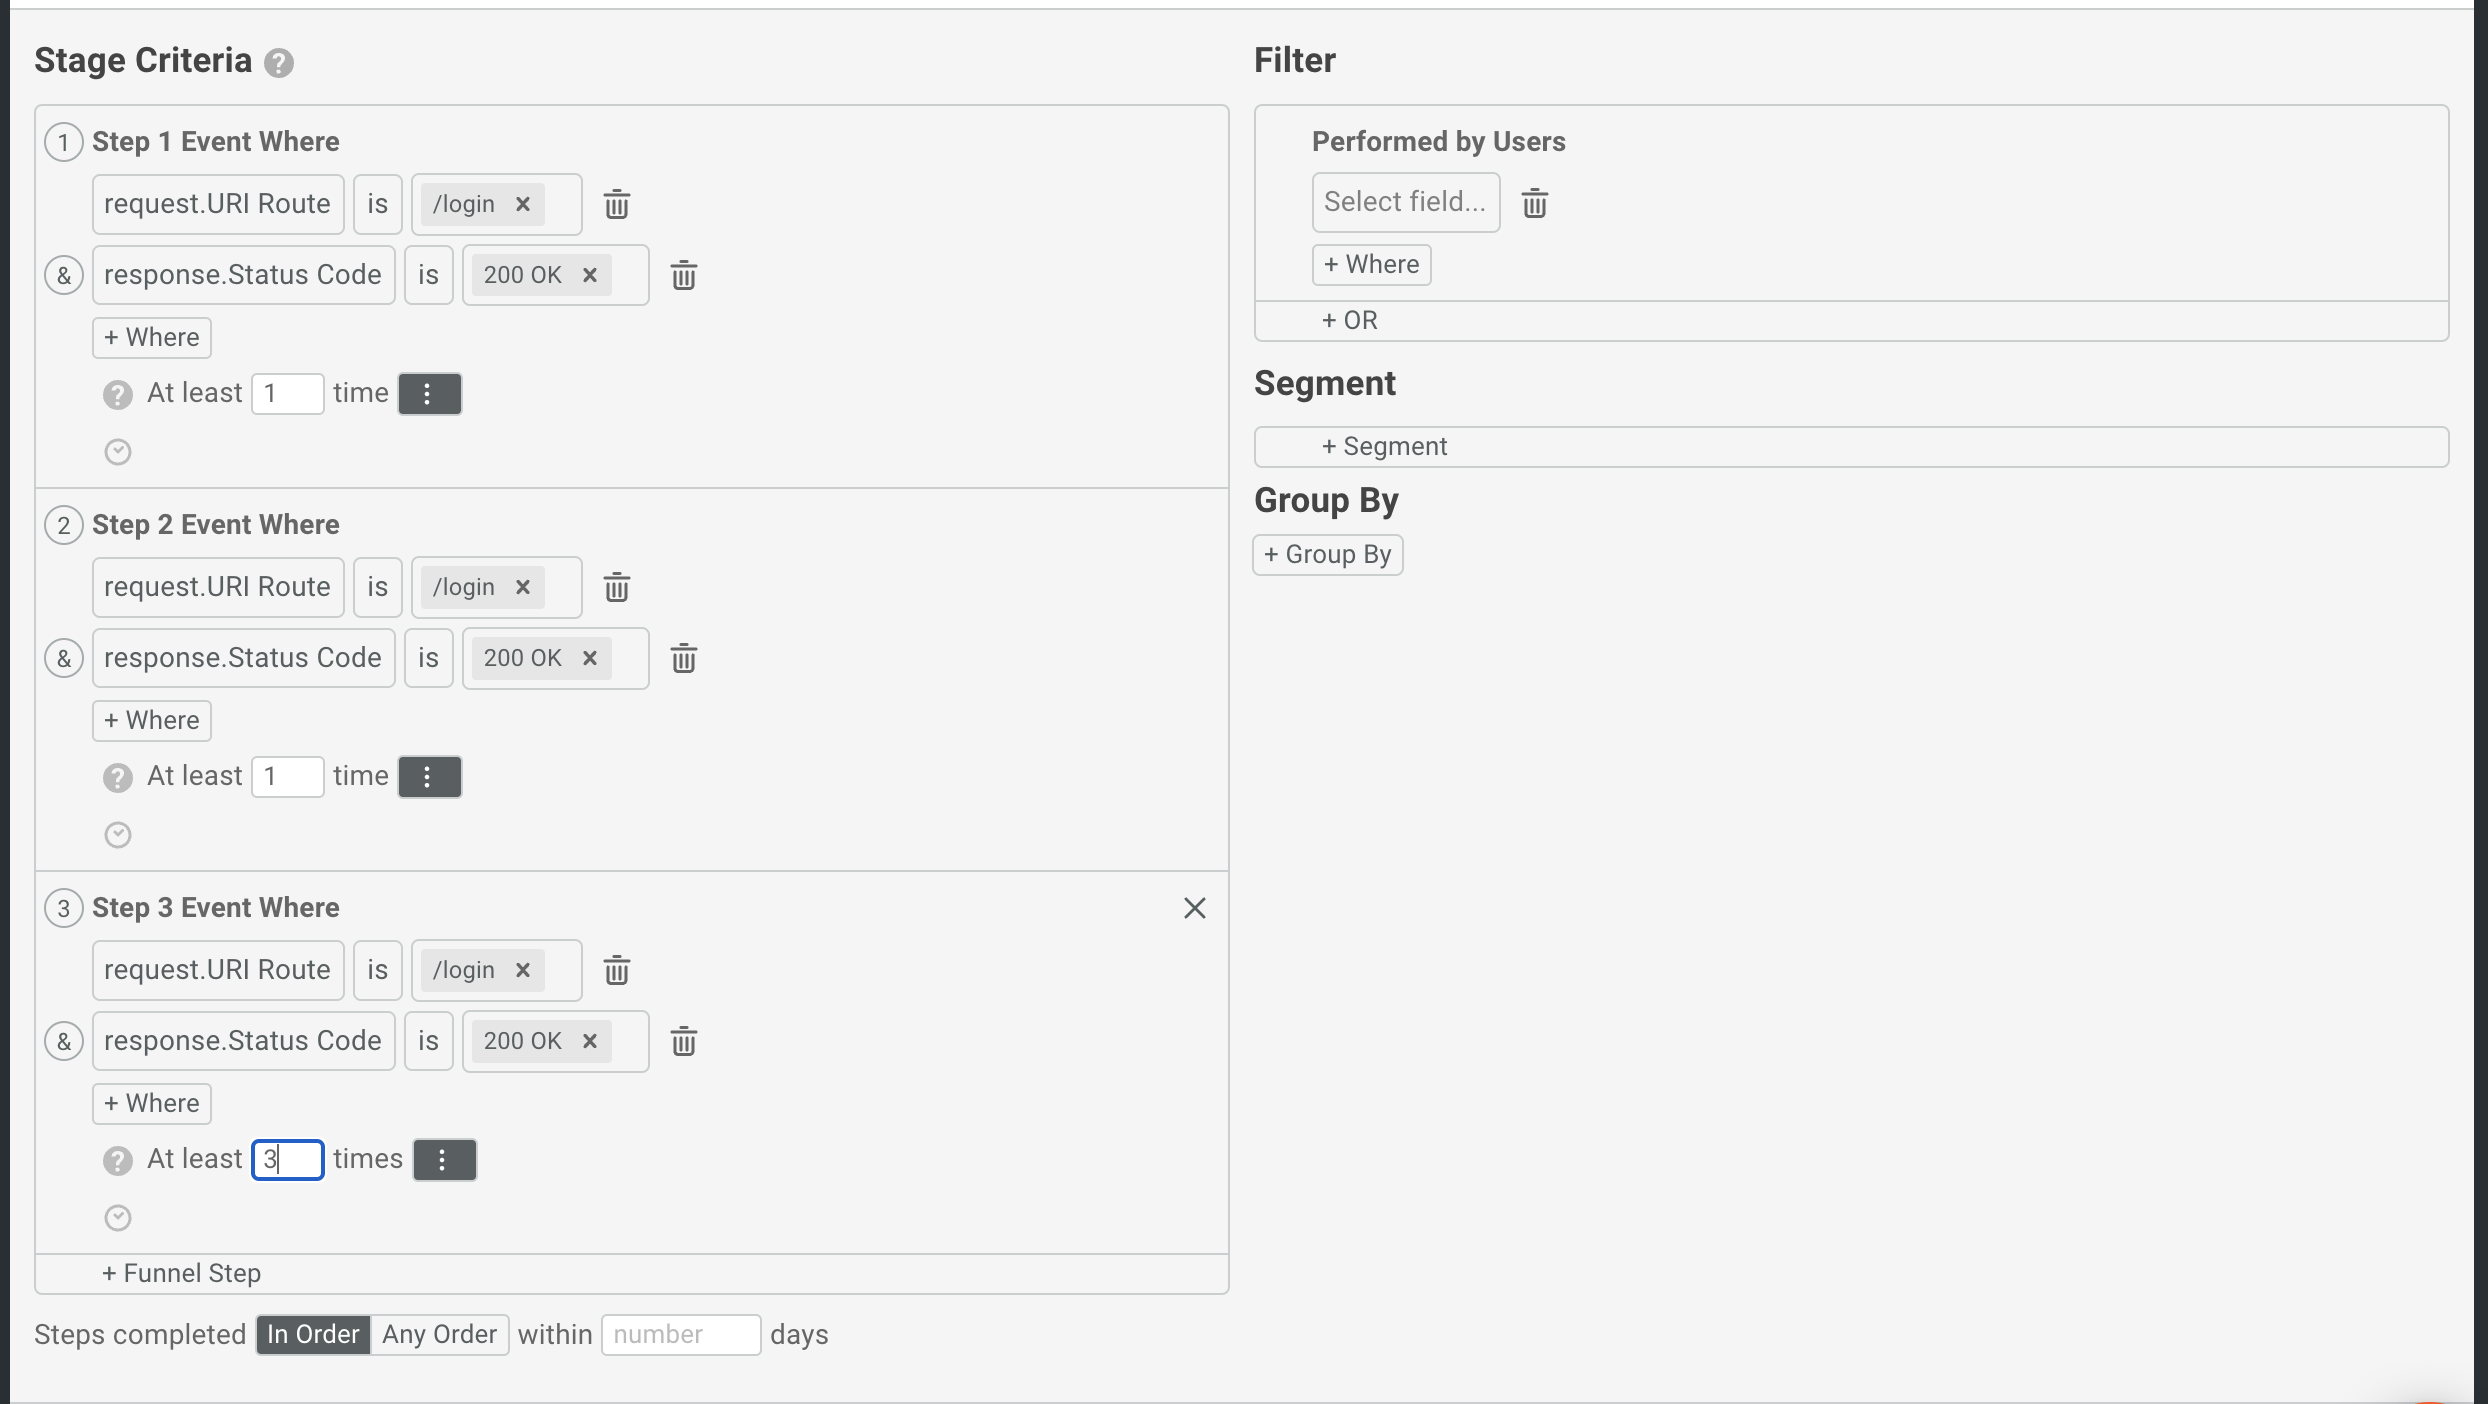
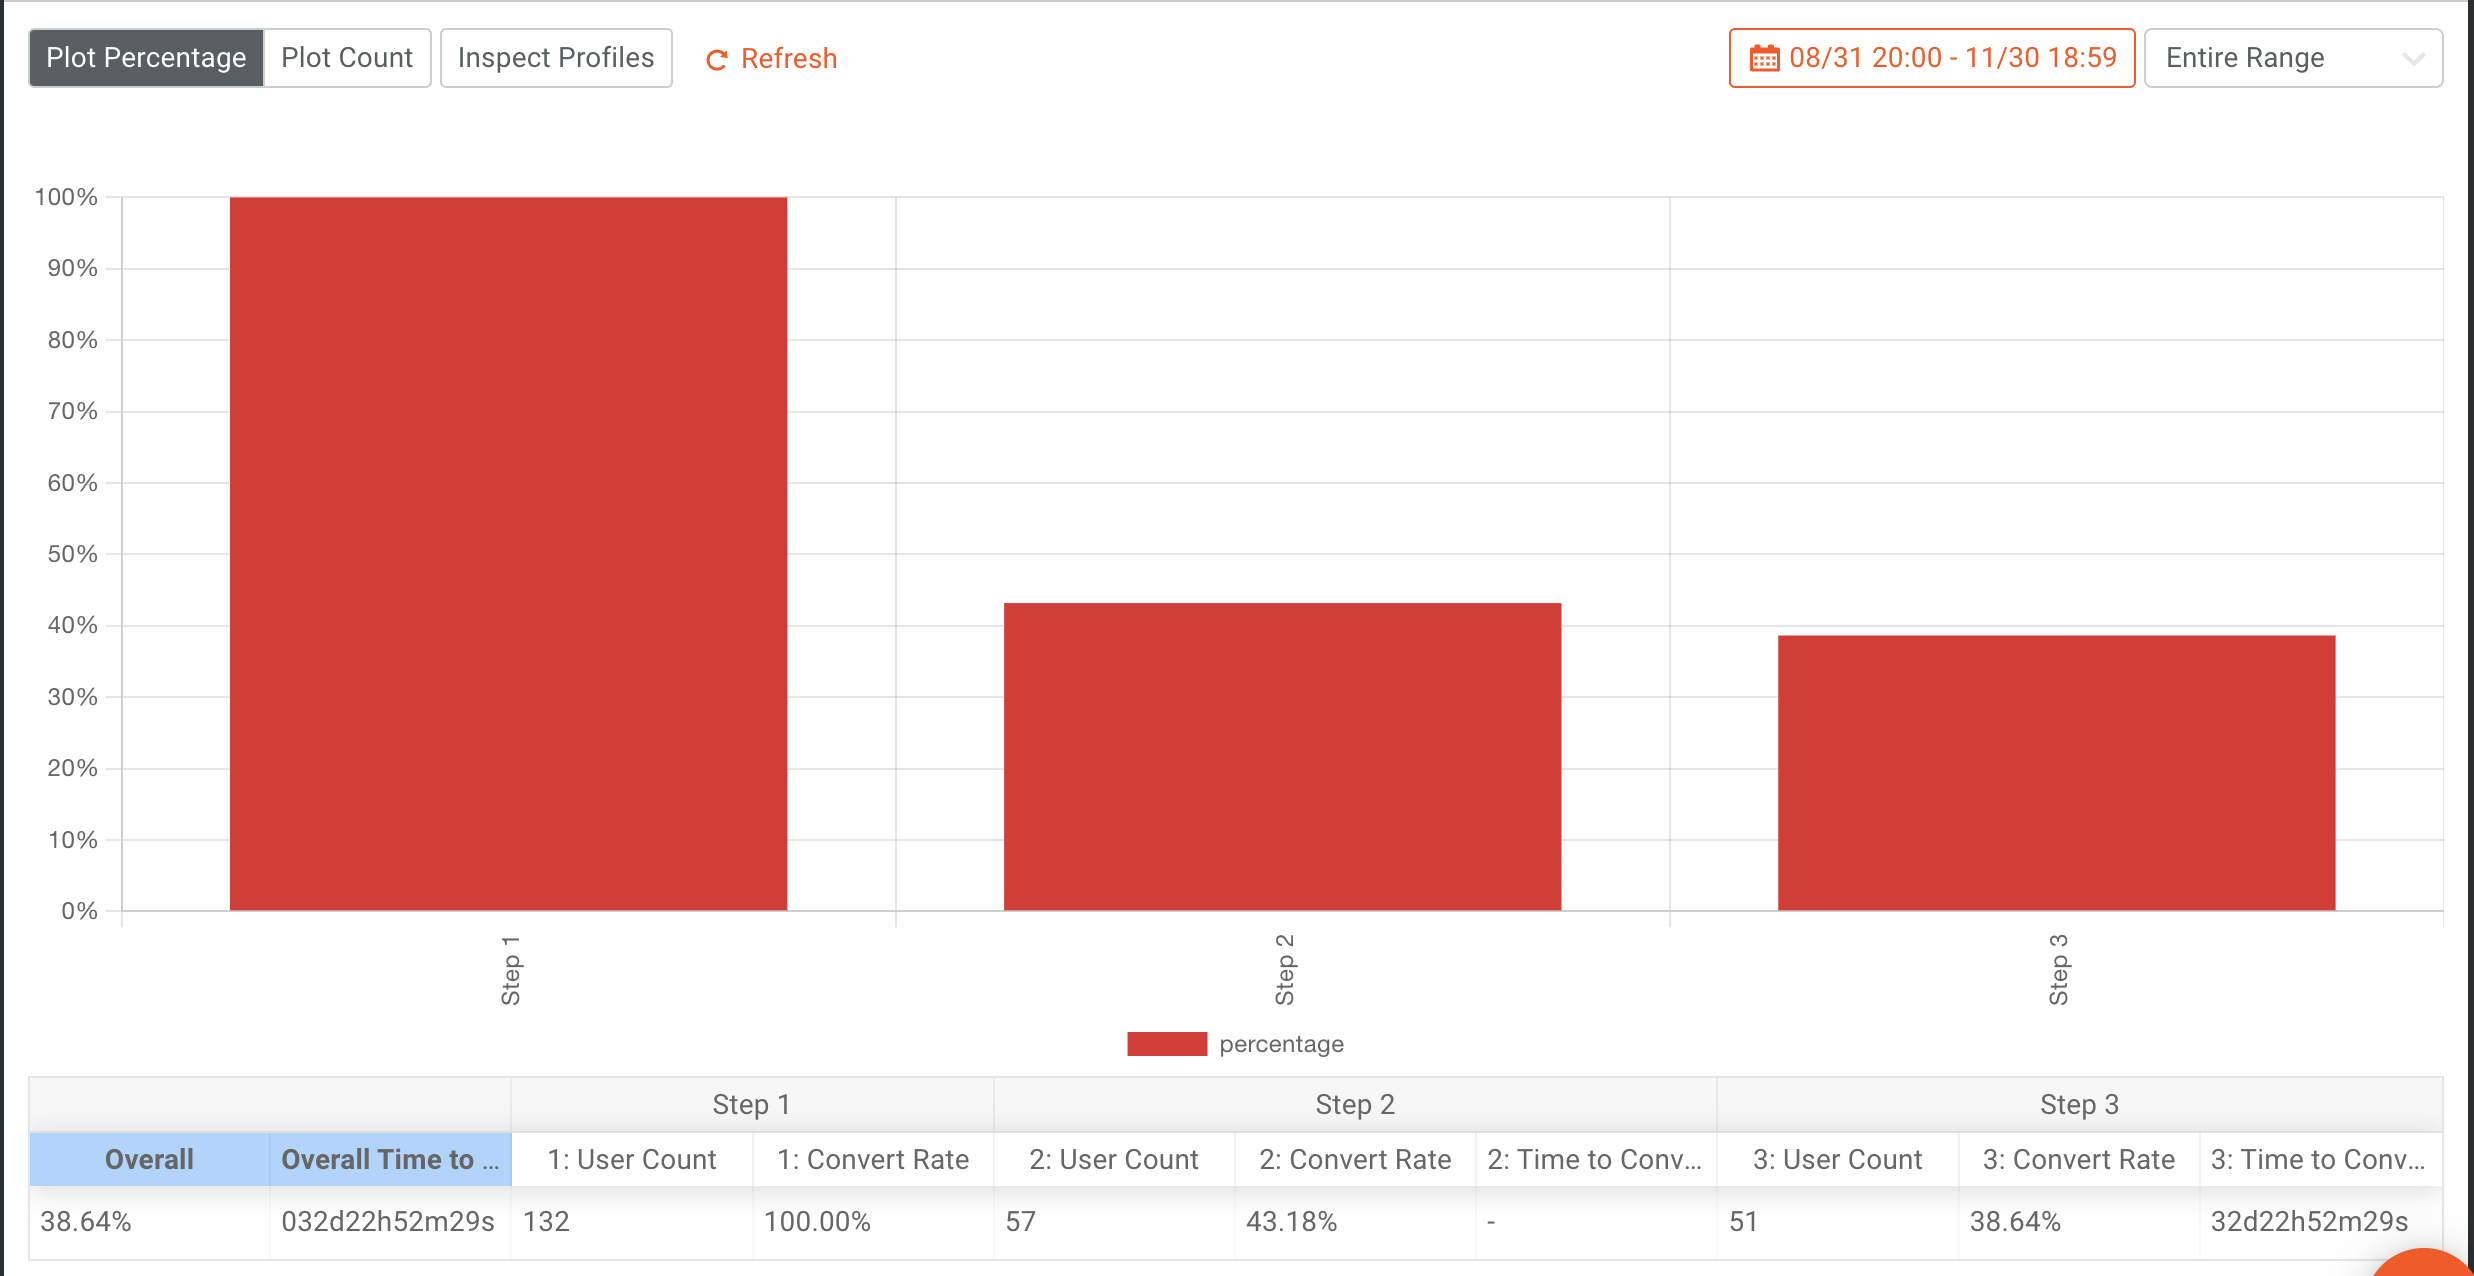
A simple example would be for us to look at 3-step funnel that explores the user logins. We will look at a funnel where:
- Users log in once
- Users log in a second time
- Users log in 3 more times after their second login
What this will do is allow us to see how our customers are returning to the platform. The funnel would look like this:
Retention
Another crucial part of understanding API performance is knowing how users are being retained. Getting users to begin using your APIs is part of the battle, the bigger value to the company is to keep user traffic coming into the APIs.
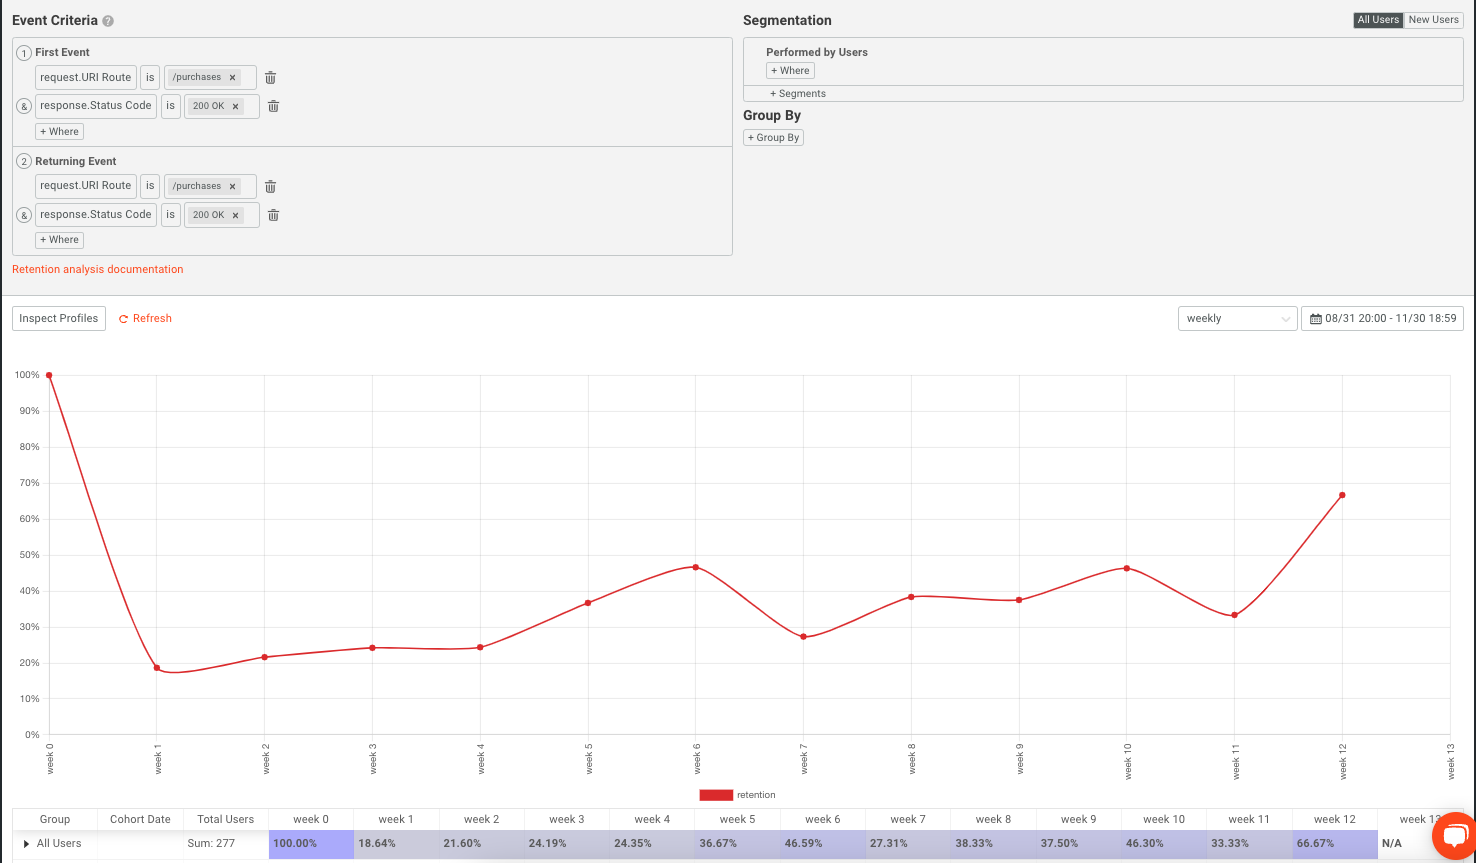
With Moesif, unlike subscription retention which merely tracks whether a customer has an active subscription, Moesif can be used to look into product retention. This is more accurate since it tracks whether users are coming back and actively using your product. To calculate the retention of your users, Moesif requires an initial event and a returning event. If we had an API that allowed users to checkout with a purchase, we may make both the initial and return event equal to when they call the /purchase API.
Essentially, this type of retention analysis would outline that users are making continuous purchases and we consider a user who is making repeat purchases as an active/retained customer. In Moesif, the above weekly retention analysis would look like this.
We may go even further and look at the retention of different segments or groups who are using our platform. An example of this might be looking at the difference in retention for Enterprise vs. Non-Enterprise customers. Adding that to our report would look like this:
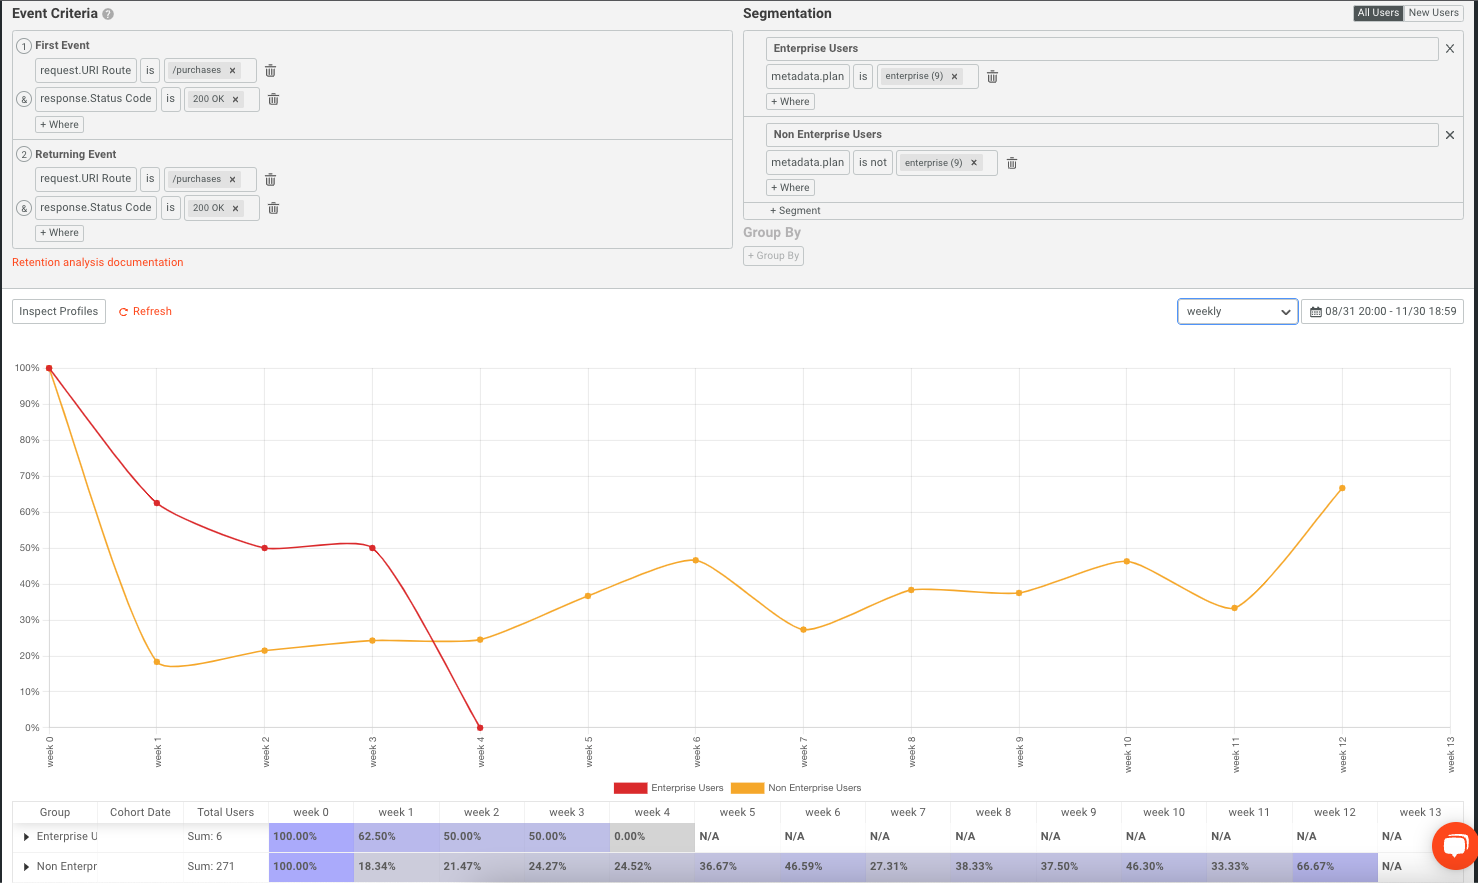
In both Funnels and Retention analysis, you can also dig into specific user segments, such as looking at retention trends by user or company. This can help you to understand the API usage at the individual level and see how various users and companies are using the platform and if they are returning to the platform.
Alerts
Docs for Alerting and Monitoring can be found here
When certain things are happening to your customers or within your product, it’s important to get a notification. To rely on dashboards and constant manual polling to uncover issues is extremely inefficient and also unreliable. With alerts, you can configure Moesif to alert you through email, SMS, Slack, PagerDuty, or another custom channel to notify you when a specific criterion is met.
In terms of understanding API usage, you will likely want to know when APIs are receiving an abnormally high or low amount of traffic. This can be done by Moesif by using two distinctive types of alerts.
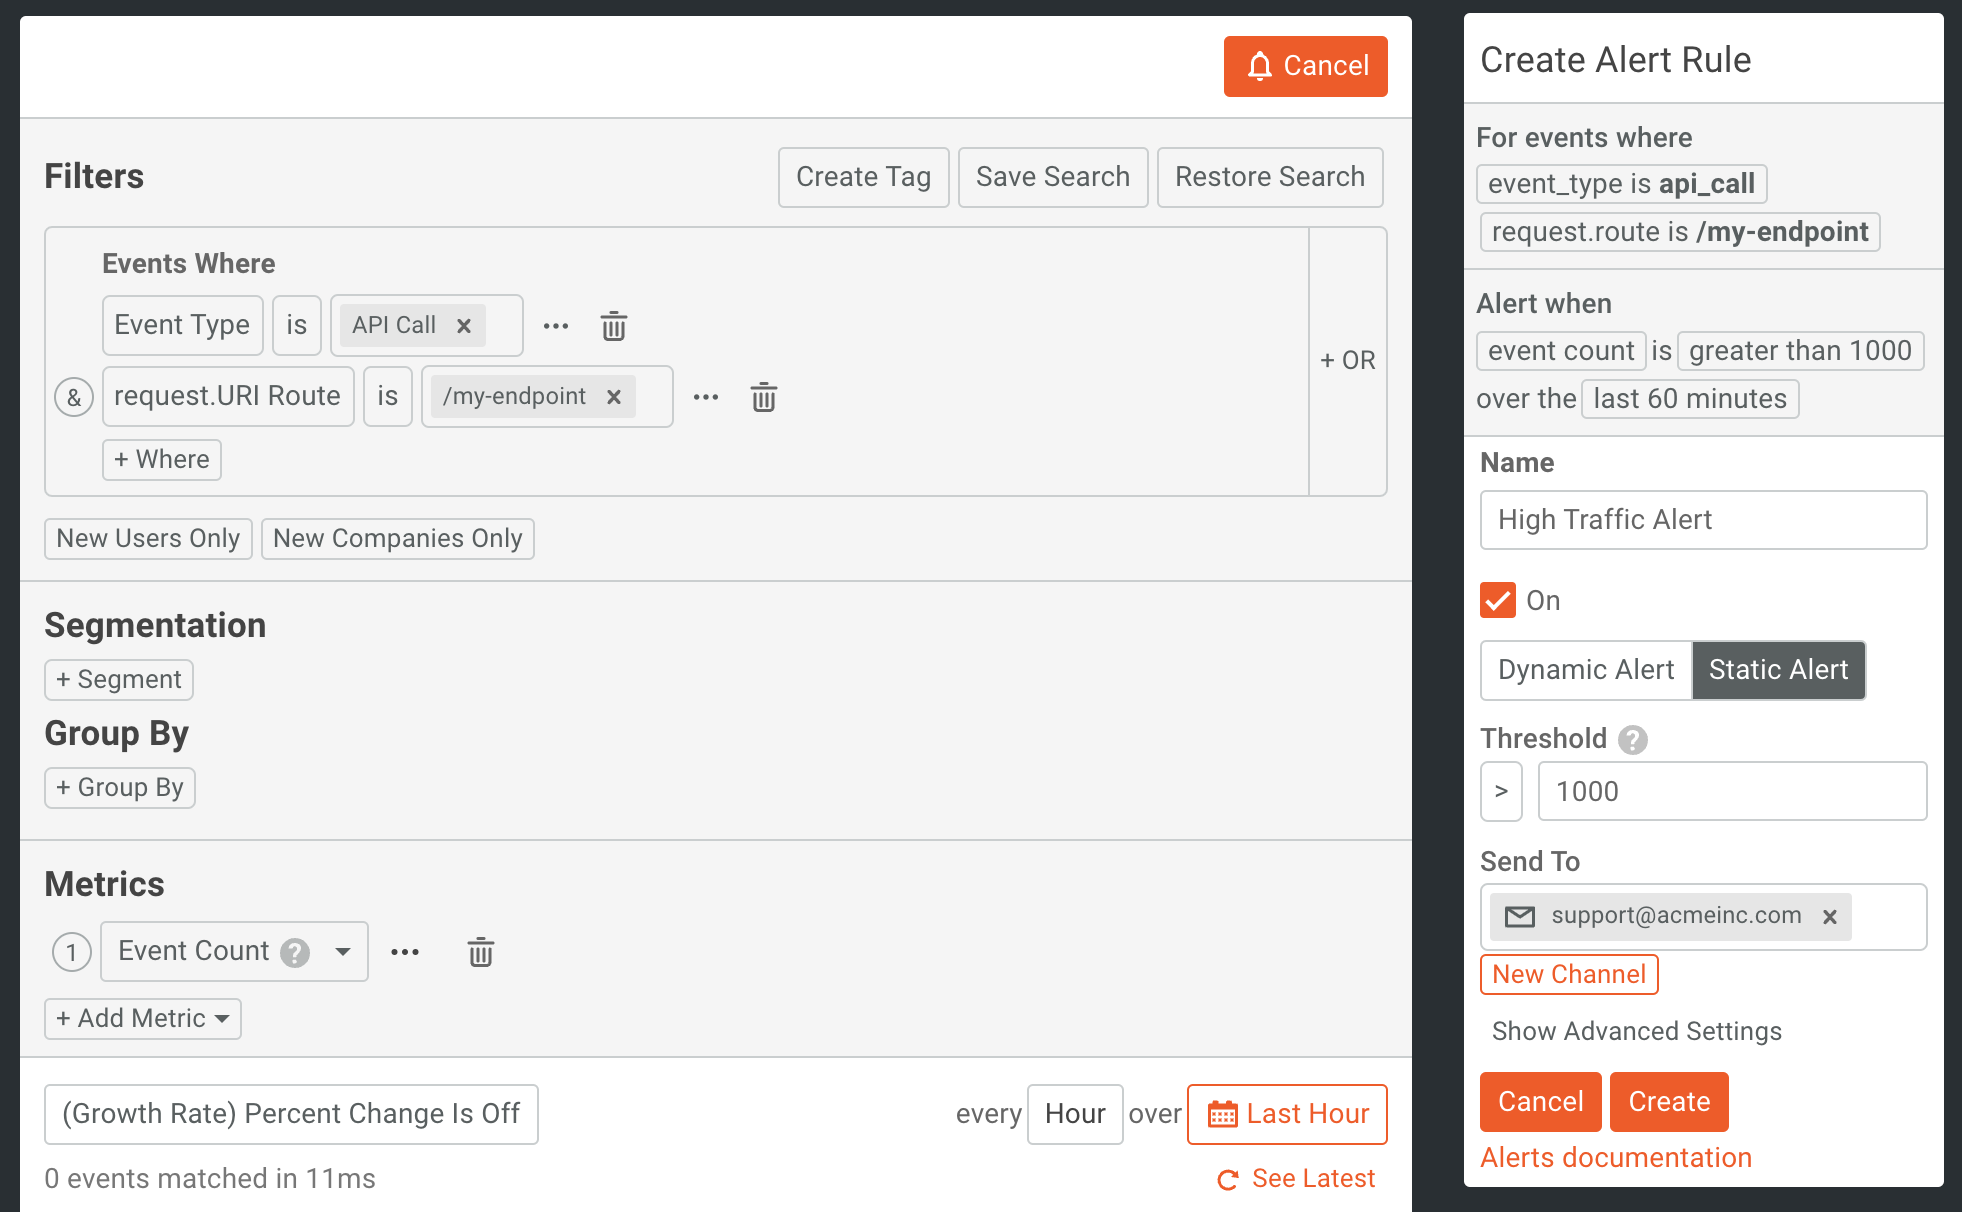
Static Alerts
Static Alerts allow you to configure an alert to send a notification when a static threshold is hit. An example may be to alert when a specific API endpoint is receiving more than 1,000 calls per hour. Once the endpoint is receiving that amount of traffic, a notification will be sent to whatever channels are configured. In Moesif, this is how that would look:
Dynamic Alerts
If you don’t know exactly what static amount you’d like to set as your threshold to alert on, you can use a Dynamic Alert. The setup for a dynamic alert is similar to the static alert setup above except you will specify the type as a Dynamic Alert and then set the sensitivity for factors such as Abrupt Spike Sensitivity, Unusual Change Sensitivity, and Trending Higher Sensitivity.
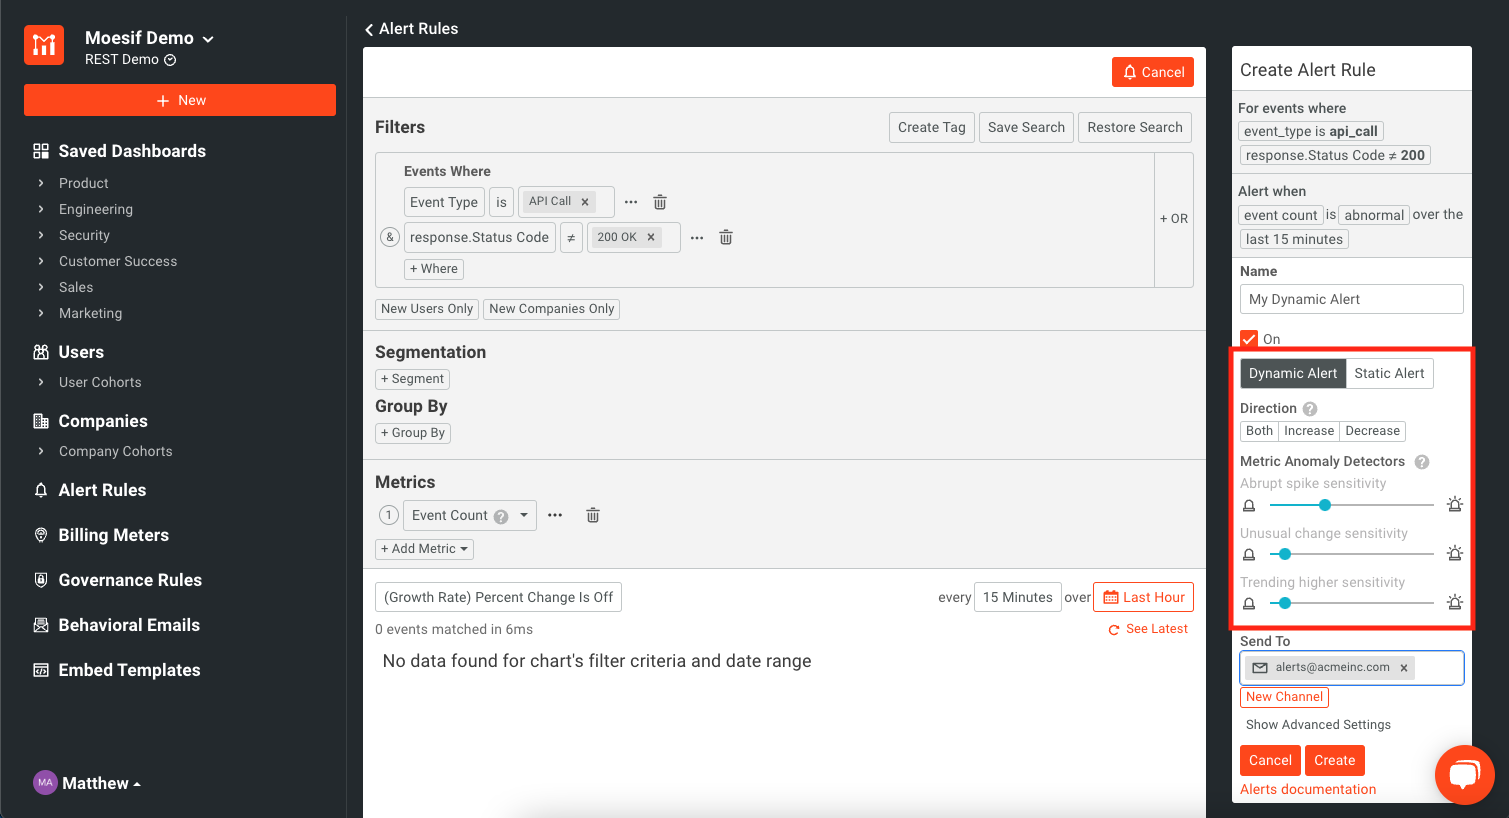
When the Dynamic Alert is enabled, Moesif will look at trends and spikes to alert users about anomalies in their customers’ API usage. This may be a better way to monitor API usage compared to a static threshold.
Governance rules
Docs for Governance Rules can be found here
Much of the time, creating reports and monitoring APIs is essential but being able to use the insights in an automated fashion can be extremely powerful and augment those capabilities. This means that understanding API usage is only part of the battle. Being able to use those insights to govern access to the APIs is the next level of understanding API usage and proactively using the data. With Moesif’s Governance Rules feature, you can do exactly that.
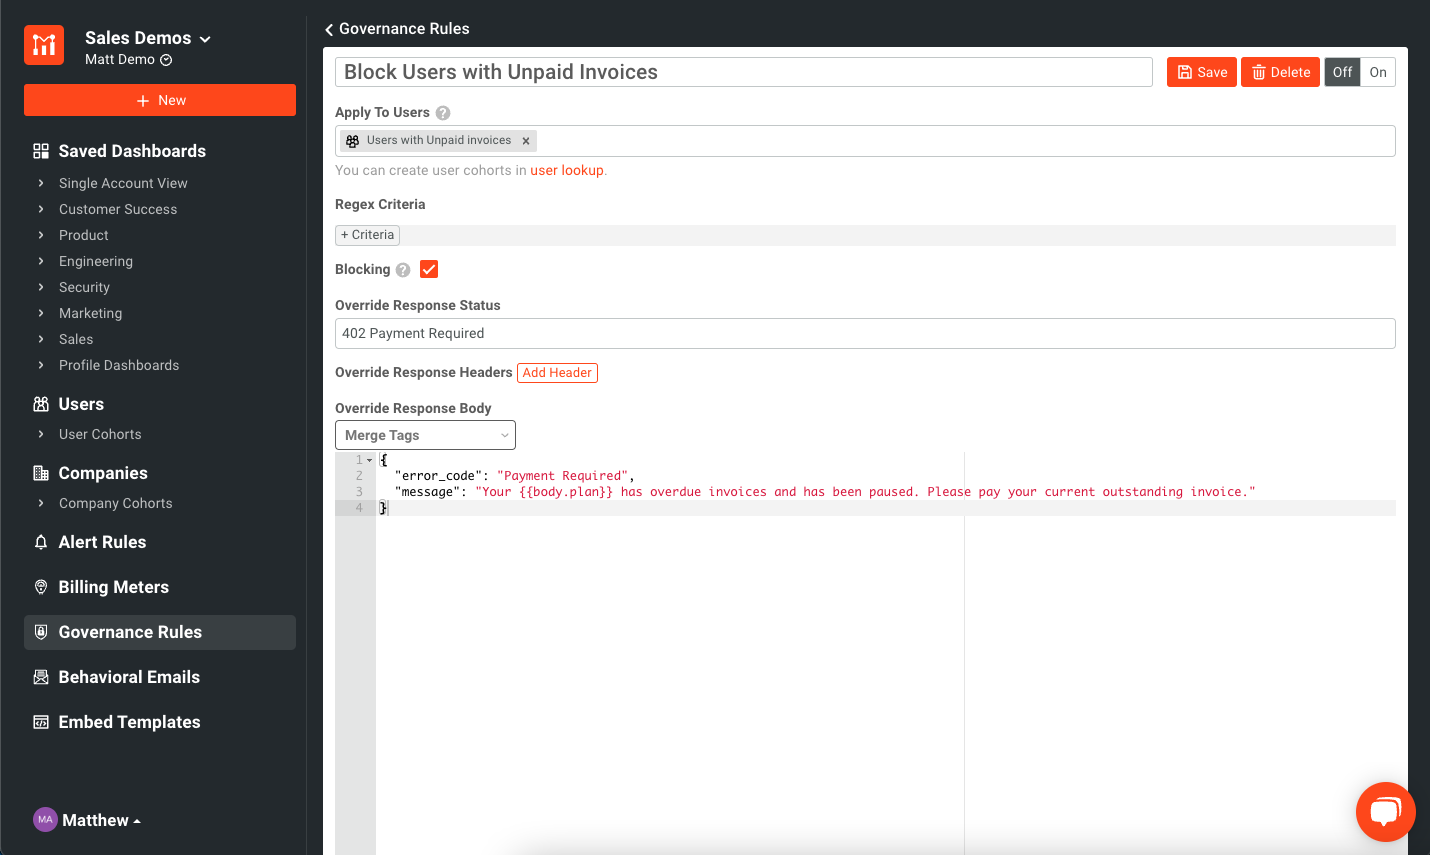
Blocking unwanted behaviors and usage
The Governance Rules feature can be used to detect when unwanted behaviors or conditions are occurring and stop users from using the API. There are 2 types of governance rules that can be applied: blocking and non-blocking. Non-blocking rules still allow the request to go through to the upstream API but allow the response body, response status code, and response headers to be overridden. For blocking rules, the request does not get received by the upstream API but is blocked at the plugin/gateway or SDK level and an overridden response will be sent back to the user that called the API.
An example of when this might be useful is in the context of API monetization. In Moesif, we could create a Governance Rule that will block users with overdue invoices from accessing the monetized API. The users would also receive a response that tells them that they have an overdue invoice and returns a 429 - Payment Required status code to the caller.
Governance Rules are not supported on every SDK or Plugin. Please check the docs for your plugin to see if it supports Governance Rules.
Governance Rules are a great way to leverage metrics around your API usage and automate governance to make your APIs more secure and user-friendly.
Try it out!
Moesif is full of plenty of features to enhance your API business and understand API and product usage. We’ve covered some key features that can help with understanding API usage above and showed some examples of what each feature looks like in Moesif. The Moesif platform enables your entire organization, from engineers to API product managers, to more deeply understand API usage. Moreover, the platform also allows you to use those insights to take action automatically through Governance Rules and even through other features such as Behavioral Emails or Metered Billing. Log in or sign up today to get started with Moesif!


Related Articles

API Strategy
Leveraging AI For a Better API Strategy
Learn how to leverage AI to build and fortify your API strategy. Improve design, governance, documentation, and align APIs with business outcomes.
API Strategy
The 5 Best Mixpanel Alternatives of 2025
Learn about the best Mixpanel alternatives to determine the right analytics solution for your use case.

API Development
How to Leverage Moesif Effectively for API Observability
Effectively leverage Moesif for API observability through best practices for integration, event enrichment, custom actions, and engineering workflow integrat...
API Strategy
How to Build an Internal Chargeback Model for Your API and AI Usage Using Moesif
Use Moesif to implement internal chargebacks and enable precise API and AI cost attribution for better transparency and resource optimization.