4 Ways to Leverage User Metrics in Moesif
Without users, products mean nothing. So why is it that so many organizations analyze API and user behavior metrics as an afterthought? My theory would be that they just don’t have the right tools in place to actually collect, analyze, and use these usage metrics.
With so many products aiming to improve their user experience and customer satisfaction, tools like Moesif are exactly what is needed. With Moesif we can collect meaningful user data, find value in that data, and even action some of that data right within the platform. The impressive part is how easy it is to do.
This post will look at 4 core functionalities within Moesif that can help you, your organization, and your users have better outcomes. The only prerequisites required are that you have integrated your APIs with Moesif and have set up user tracking.
Once user tracking is set up, navigating to the Users screen will give you access to 4 options that you can use to leverage your user-based metrics:
- User Lookup (and cohorts)
- User Funnel
- User Retention
- User Composition
Each of these can give you great insight into how your product is doing, how to make your product better, who’s using your product, and much more.
Let’s take a look at each of these key features, one by one.
User Lookup (and cohorts)
Being able to identify and explore the users who are using your system is important. Knowing who is using your system, how they are using it, and their individual trends over time can bring great value.
With Moesif, you can use the User Lookup screen to filter out specific users and dig in to explore at a more granular level. When you first come to the screen you’ll see an unfiltered list of users:
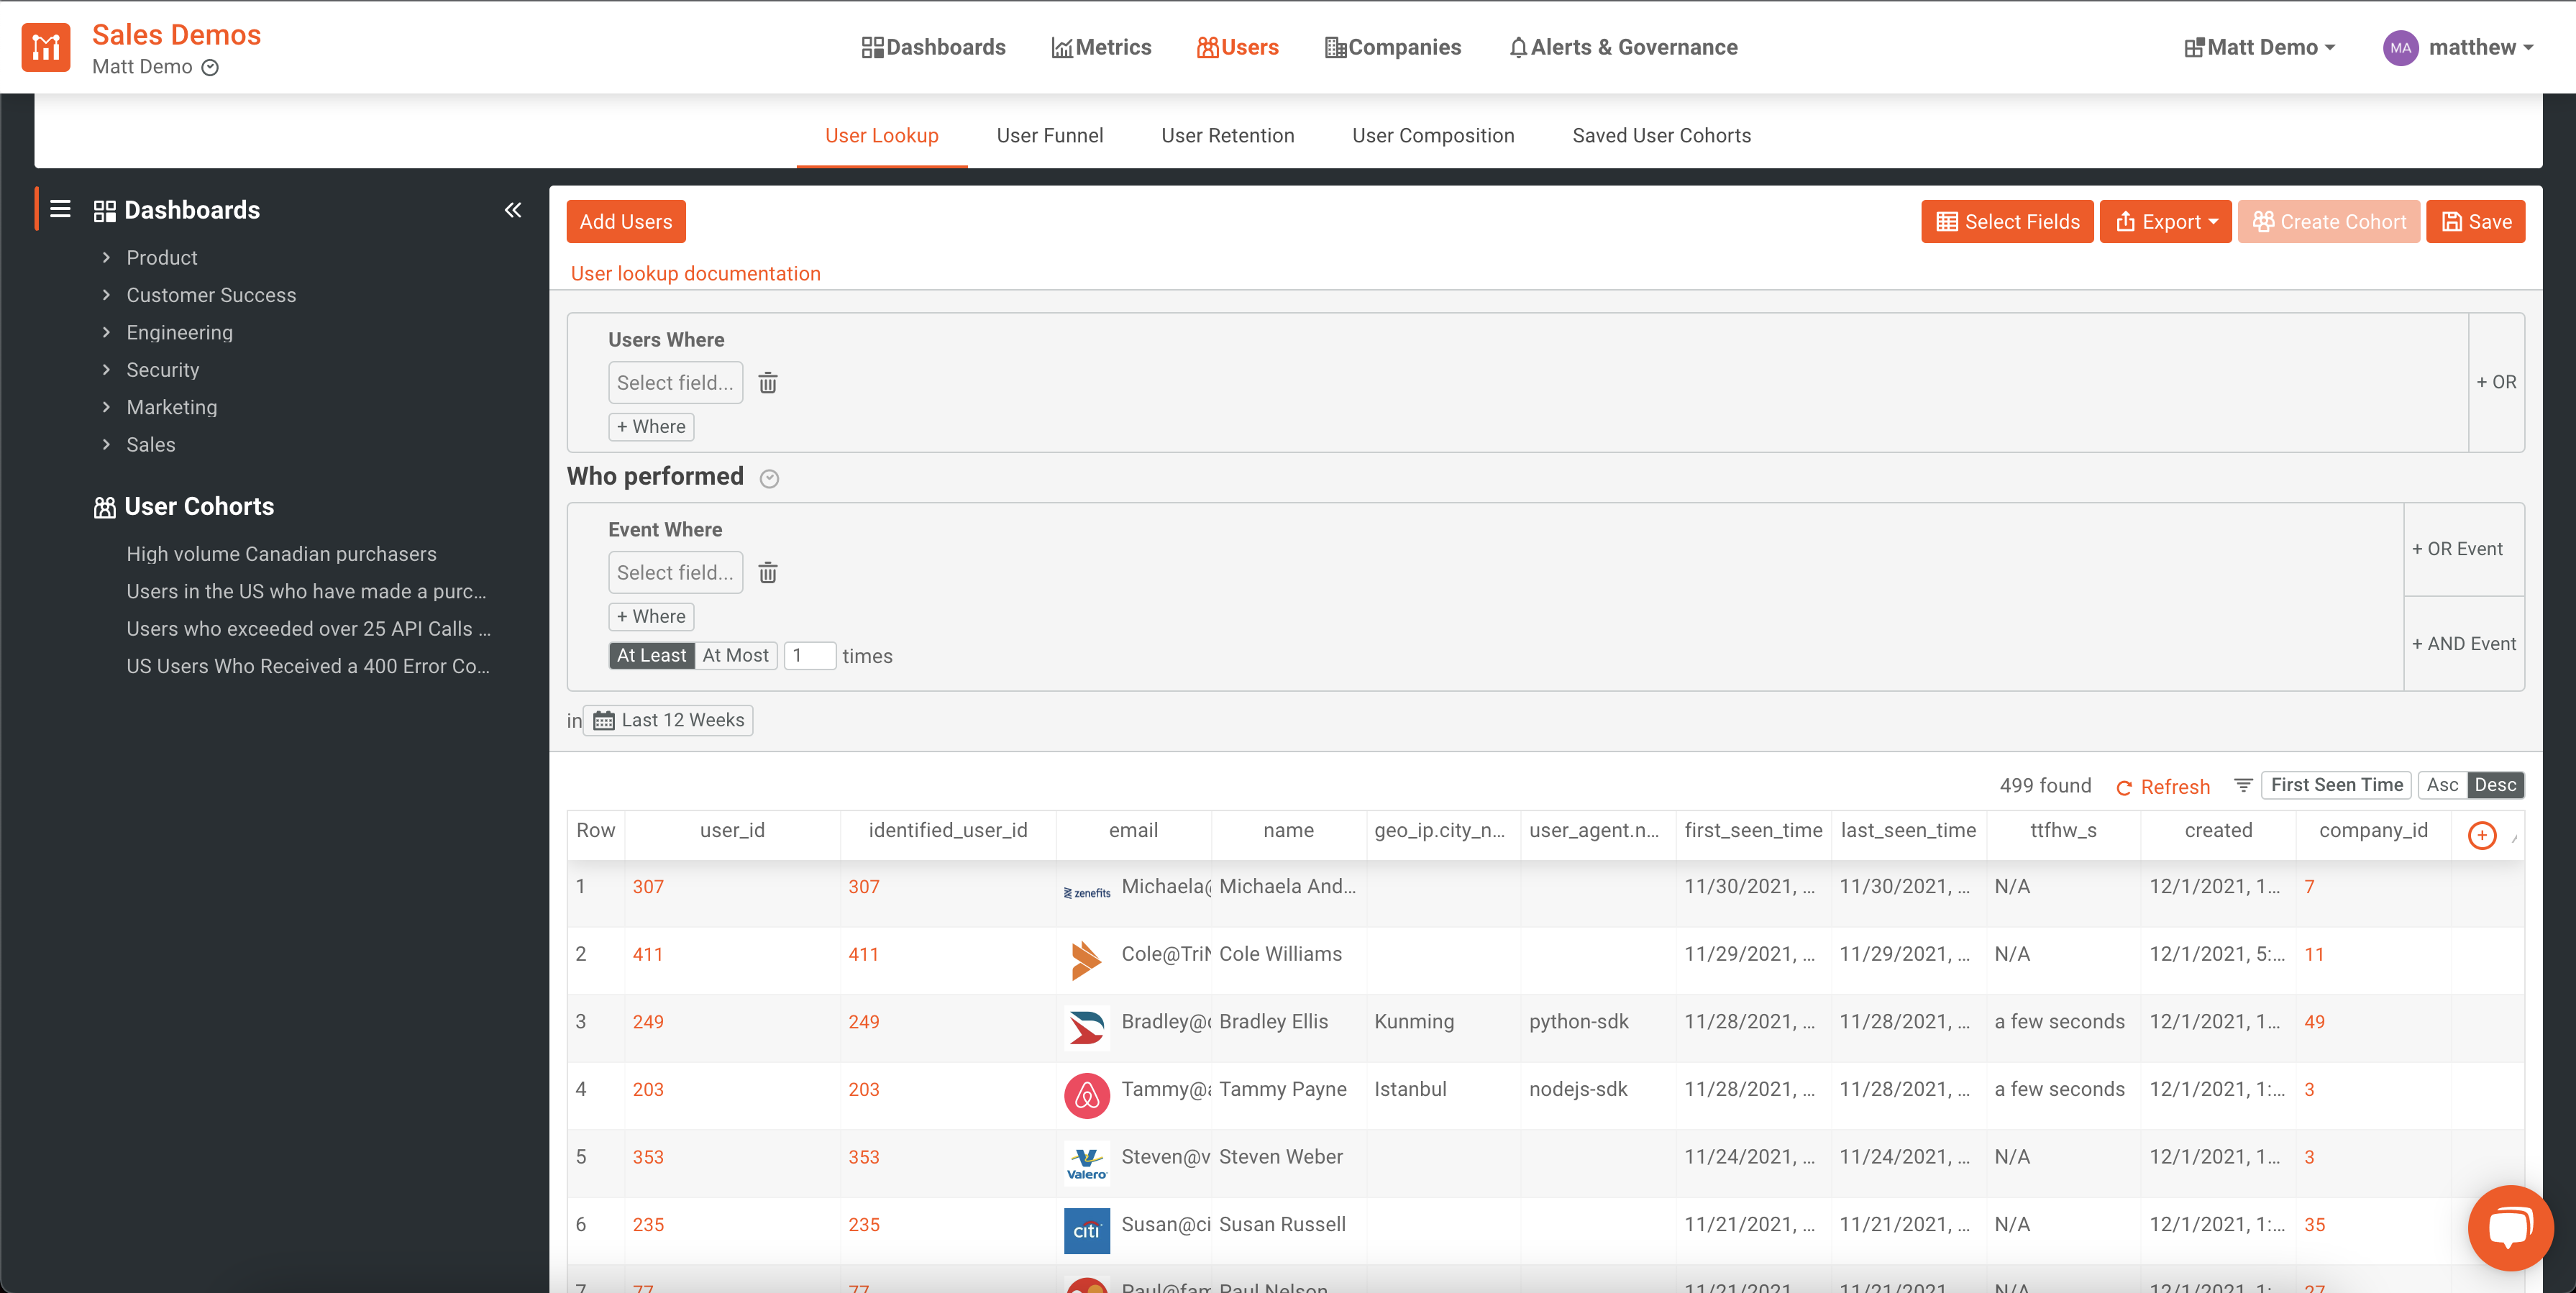
From this list, you can create filters that filter by individual user criteria, like “GeoIP” or “Time Last Seen”, or filter users that meet certain event criteria, like users who have experienced an HTTP 4XX error in the last 24 hours.
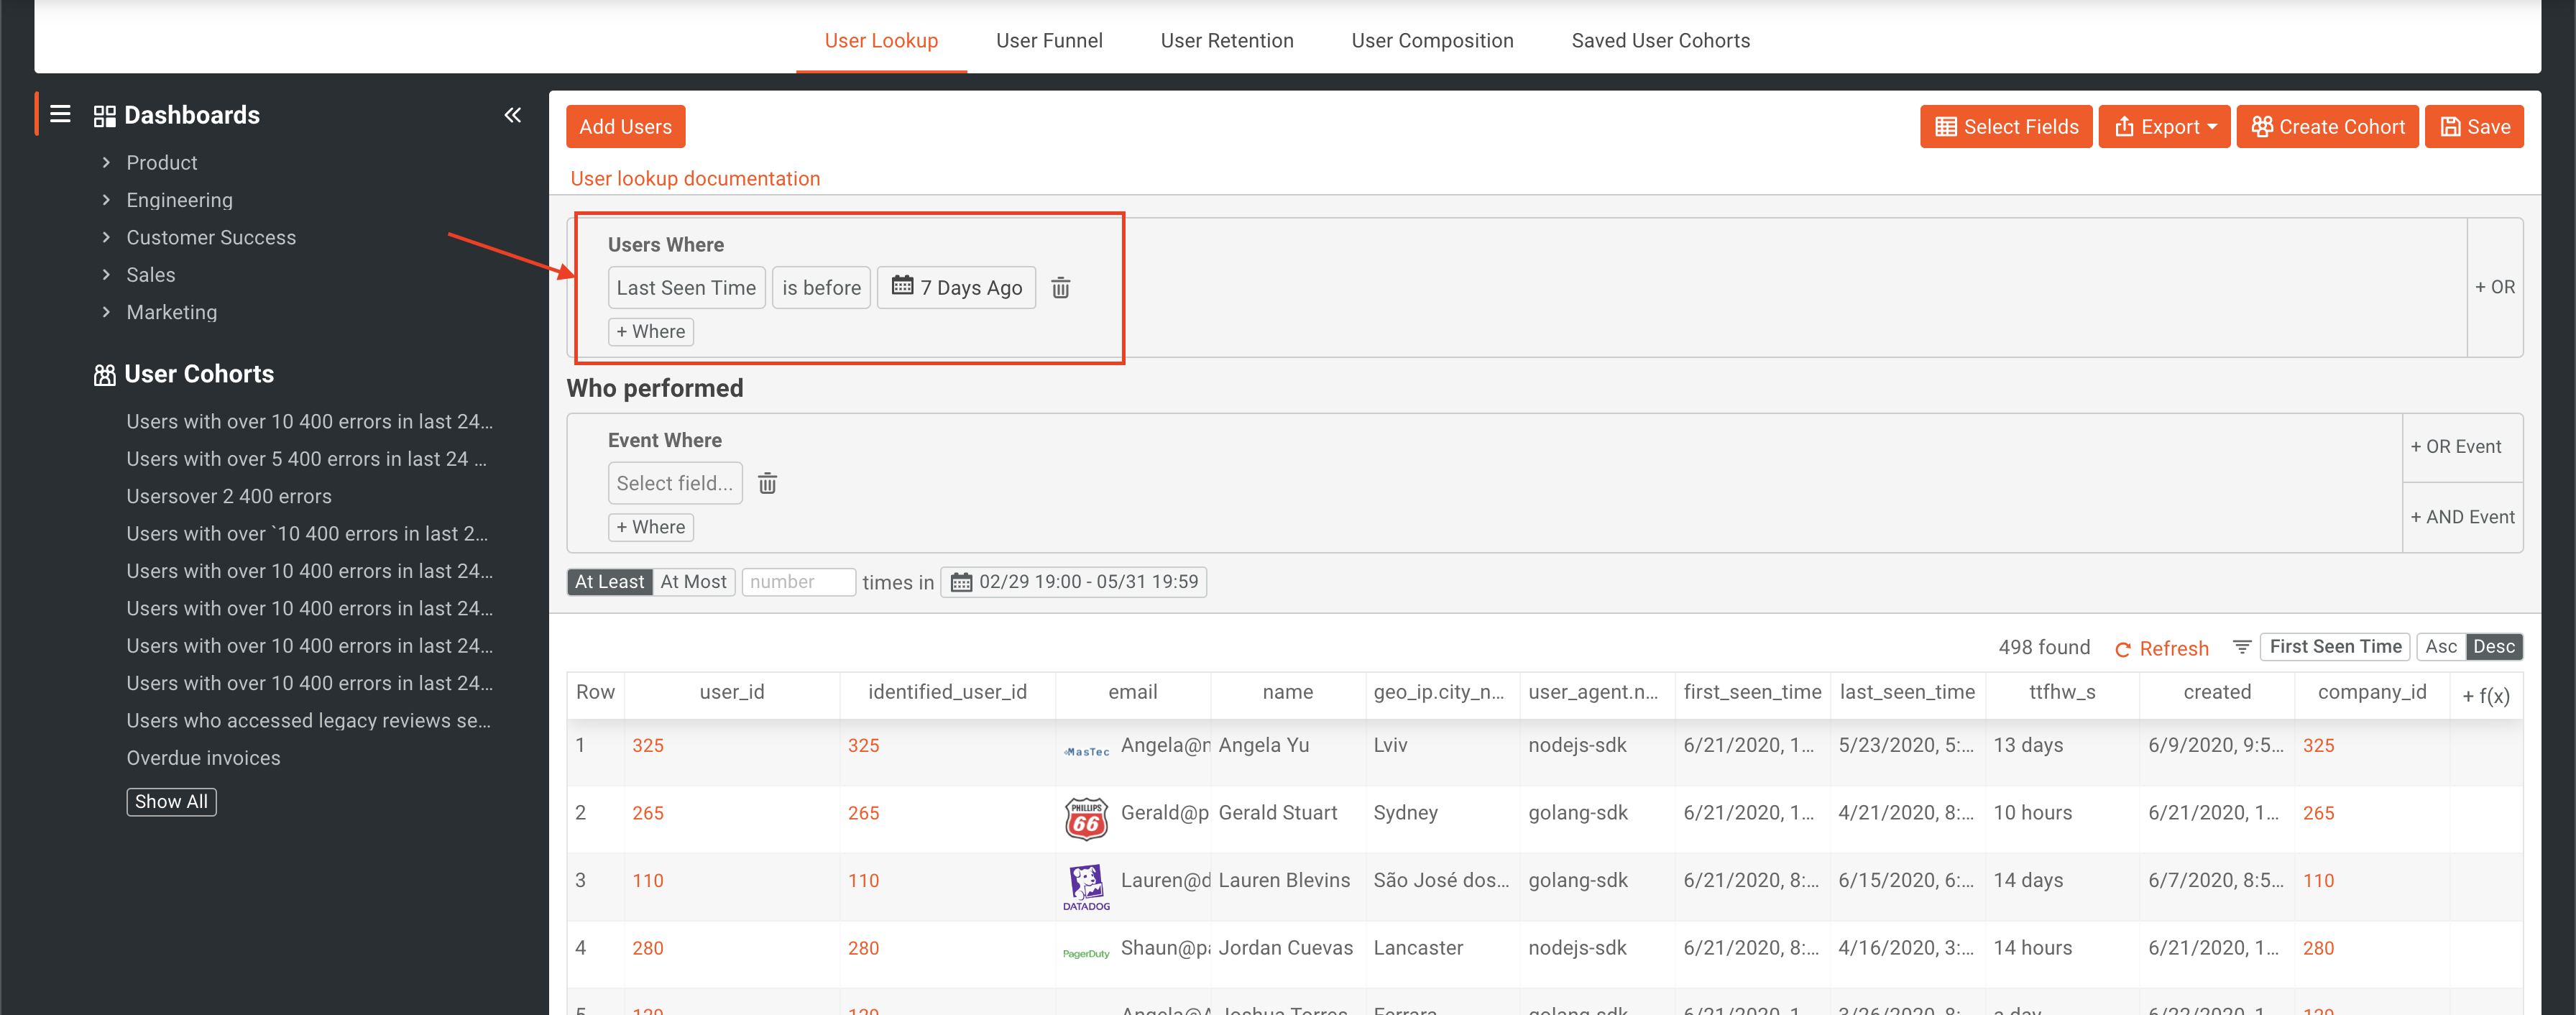
To implement the first example, we could look for users whose “Last Seen Time” is greater than one week ago. That would look like this:
Once the filter is created, the users displayed at the bottom of the page will be automatically updated. We could also add in the second criteria under the “Who Performed” filter to add even more filtering to the query. To do this we will additionally add a filter to only include users who live in the US (by using their request’s GeoIP.Country_Code). Now our filter will look like this:
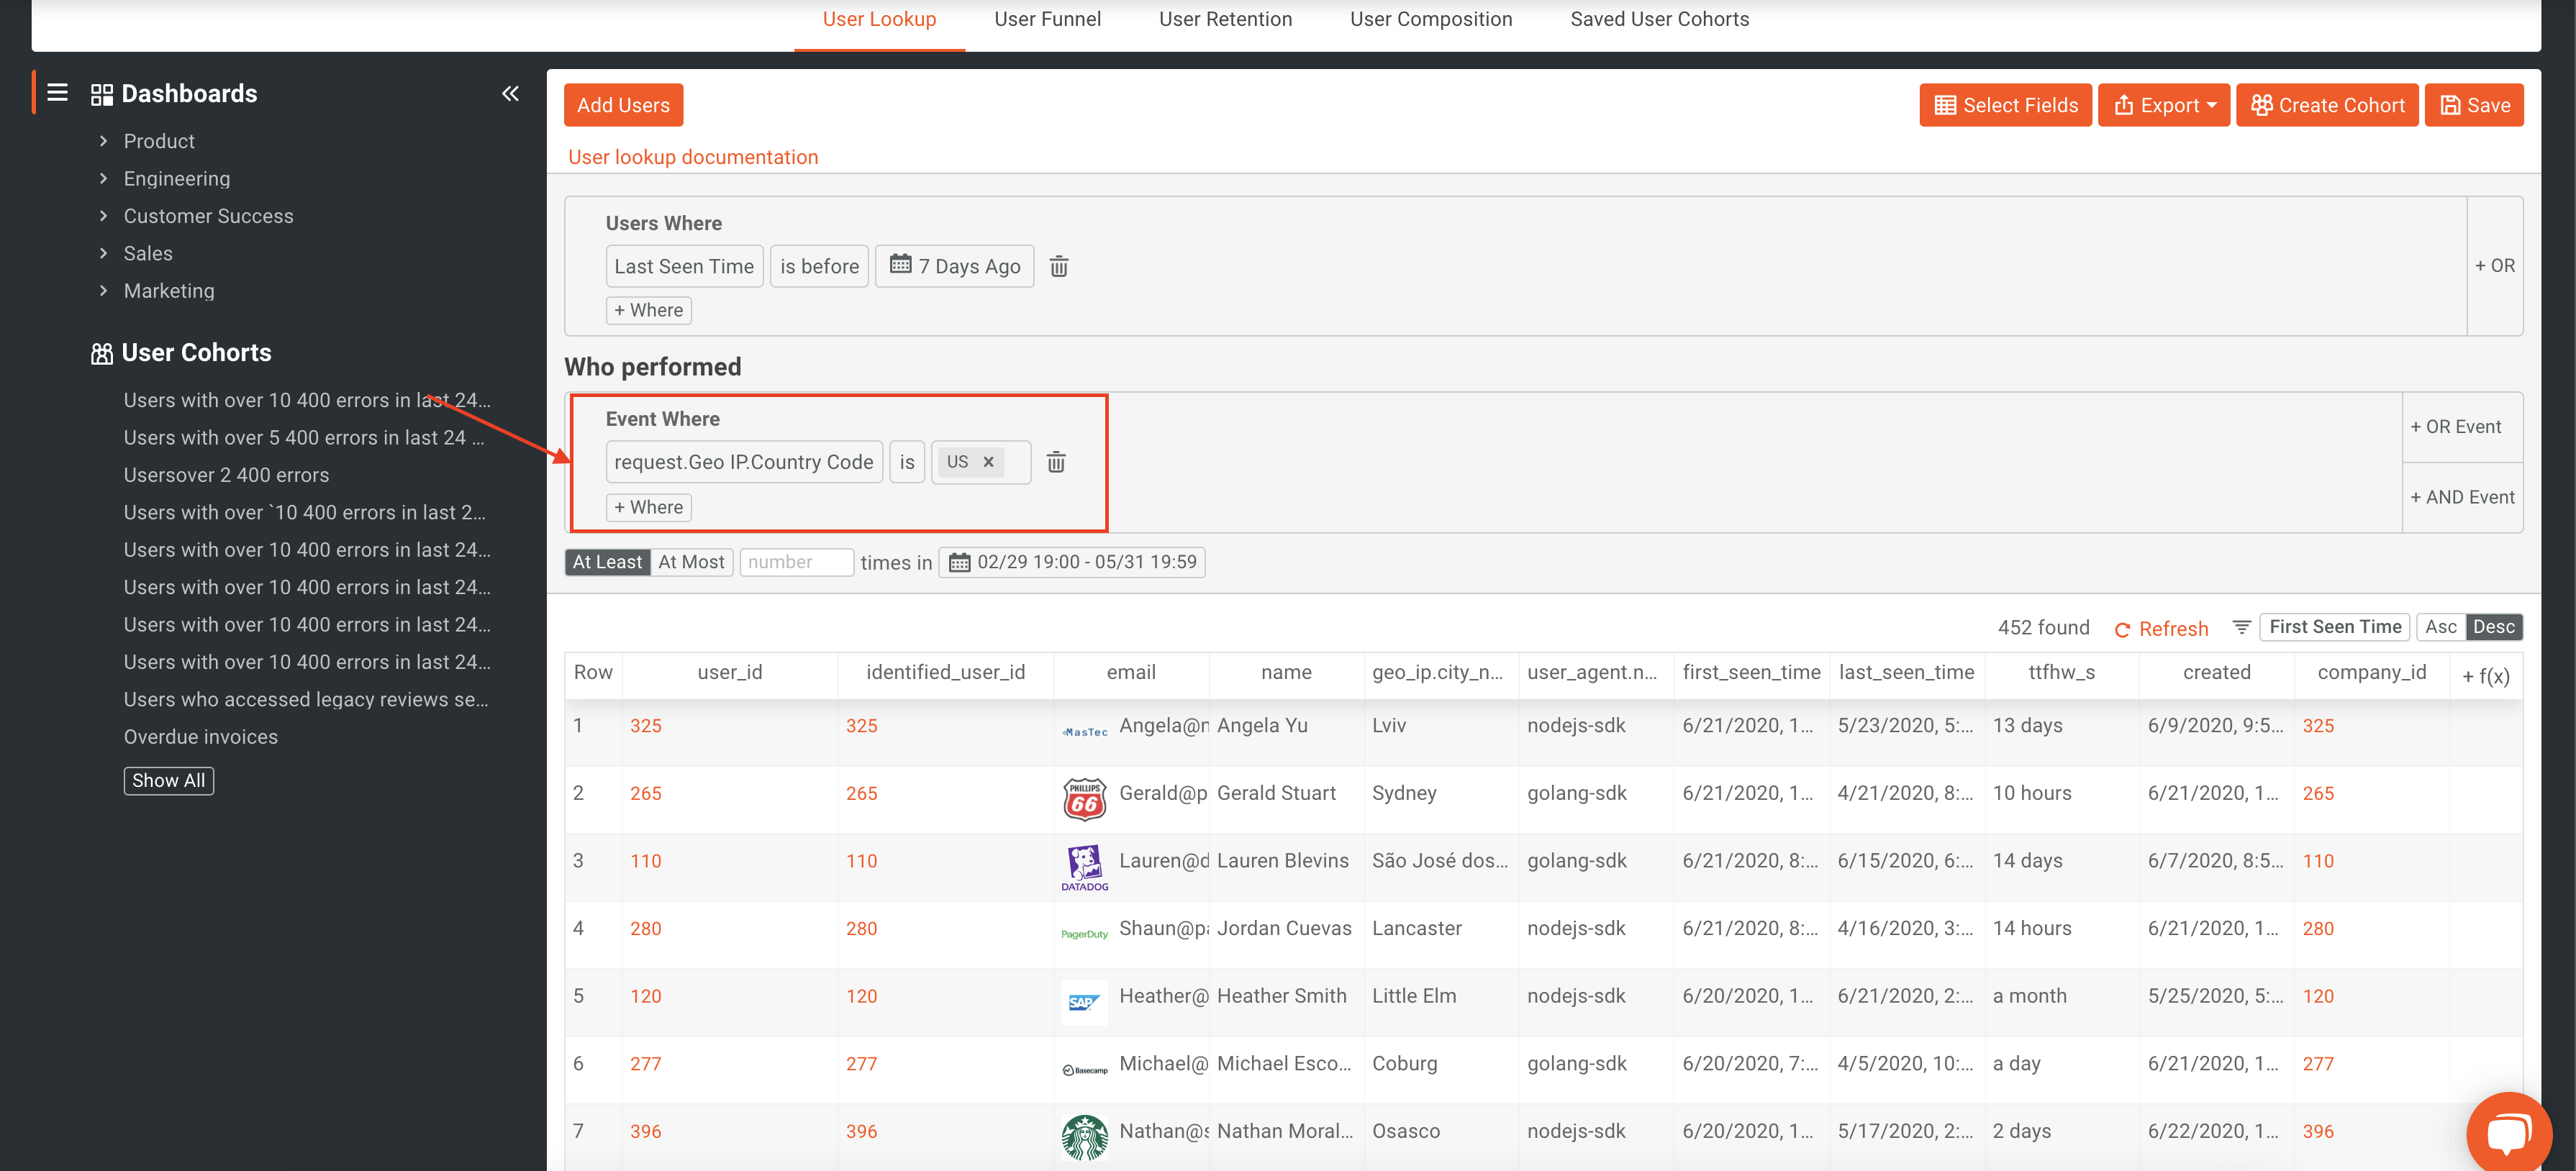
Now we will only display users in the US region whose “Last Seen Time” is more than a week ago.
If we found that these criteria might be useful for other functions, or is something we want to keep an eye on, we could save this as a cohort.
A saved cohort is a dynamic list of users (or companies) that match some specific criteria. Those criteria can be specific user/company properties or based on what the user/company performed in terms of API calls and user actions. Because these lists are dynamic, Moesif continuously updates them in the background.
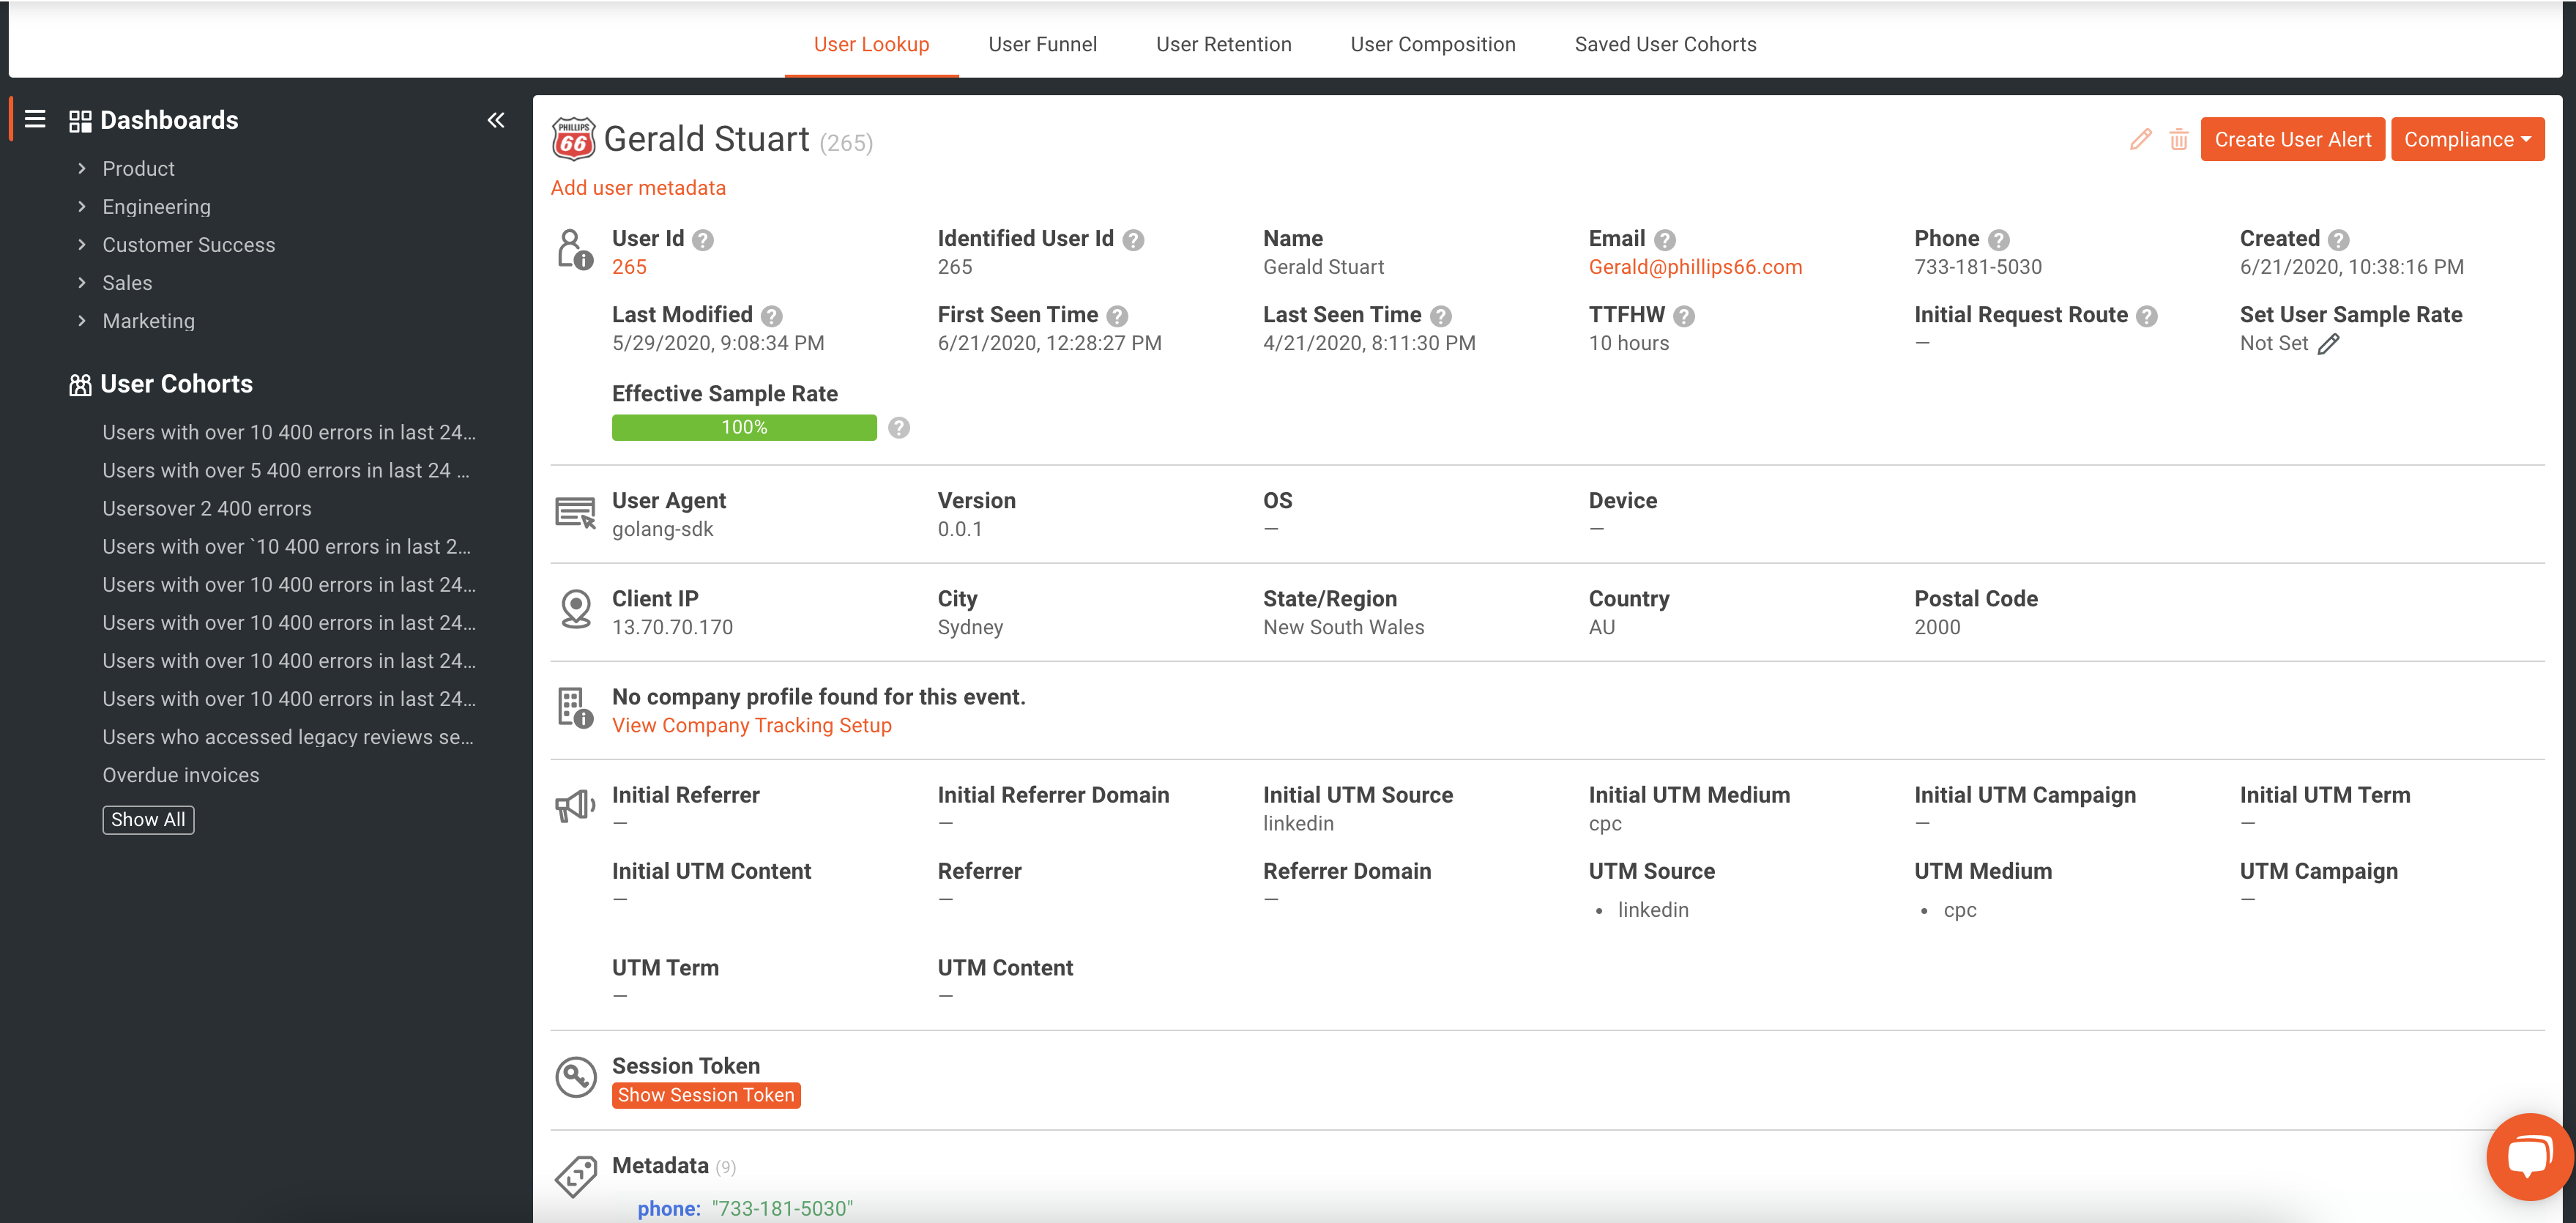
We can also look at particular users. To do this, we can simply find a user in the list, click on their user_id, and then view an overview page that shows some key metrics and details. Here you can see things like “First Seen Time”, “Last Seen Time”, user metadata, and other important information.
The User Lookup functionality and cohorts allow you to filter and explore your users easily. If you’re looking to dig in more, check out our docs.
User Funnel
Being able to track a user as they navigate through different stages of your applications funnel is a great way to see what is and what isn’t working and where users drop off or leave the funnel.
With Moesif, you will set up different stages of your funnel, possibly certain API calls, to track the user’s progress. An example of this may be a flow where users perform 3 steps:
- Login
The user logs into the system by calling the /login endpoint
- Purchase
The user decides to purchase a product by calling the /purchases endpoint.
- Subsequent purchases
The user decides to do an additional 2 purchase transactions through the /purchases endpoint.
Each of these steps represents a crucial part of the funnel. By tracking the movement of users from one stage of the funnel to the next you can more accurately determine pain points or issues, strategically make changes to the flow to increase conversions, and test changes to the flow accurately by viewing metric changes.
Setting this up in Moesif is very simple. Once in the app’s Users dashboard, we will click User Funnel.
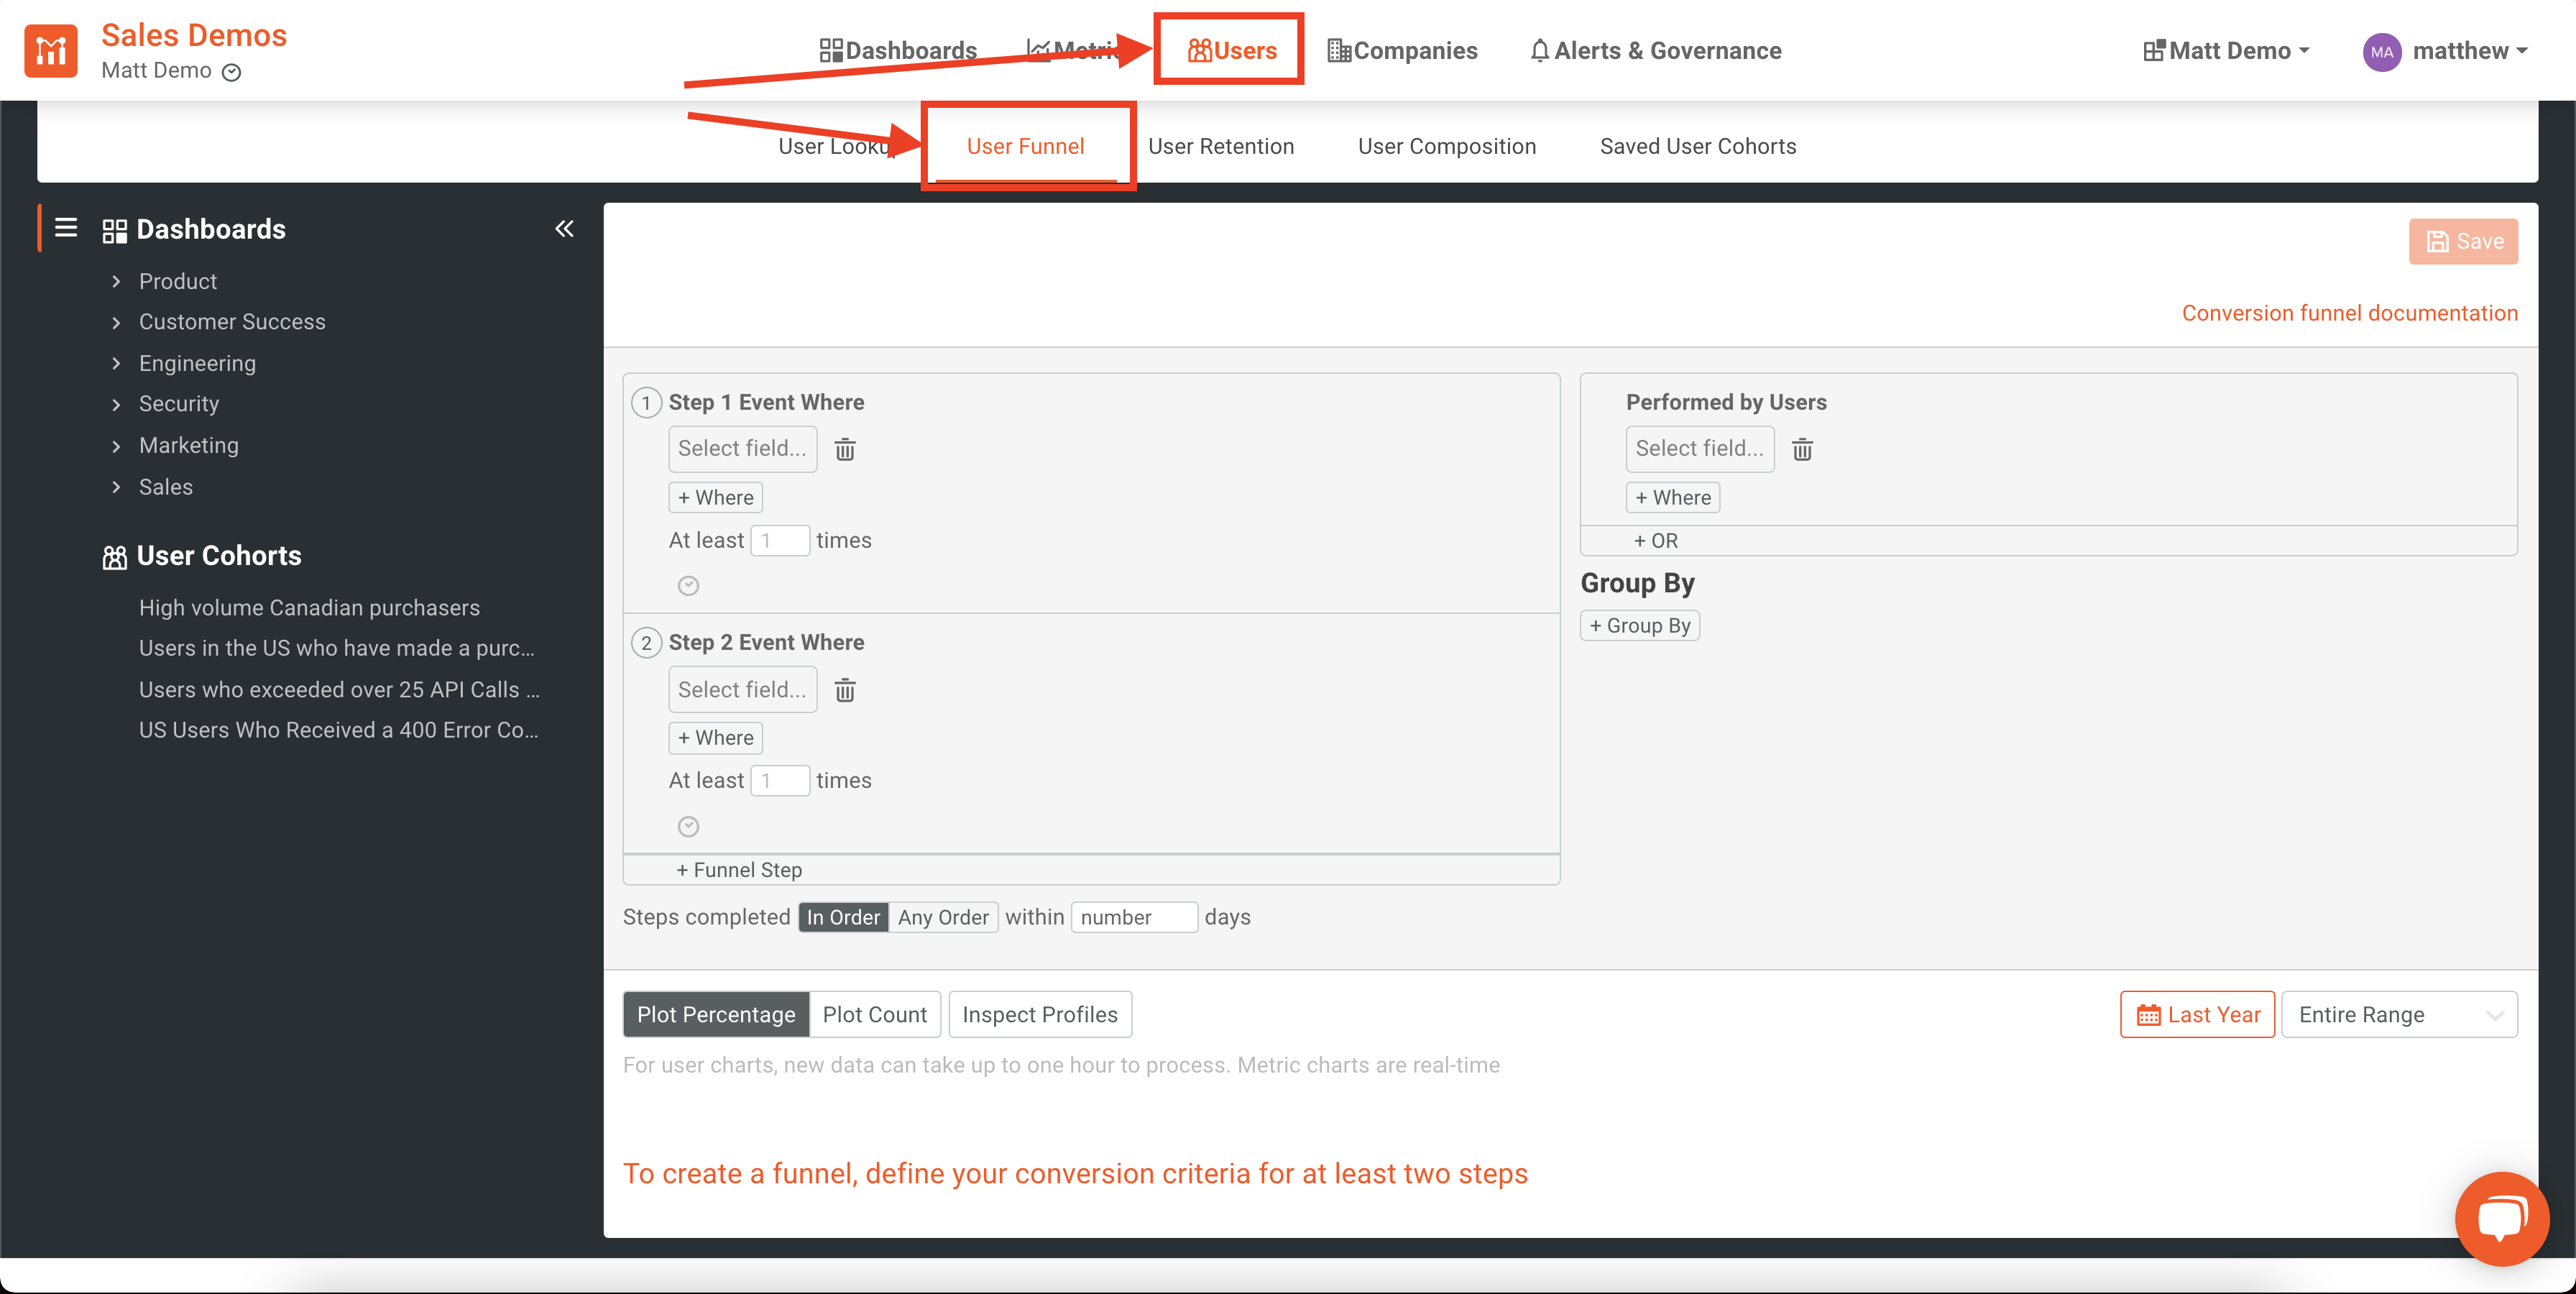
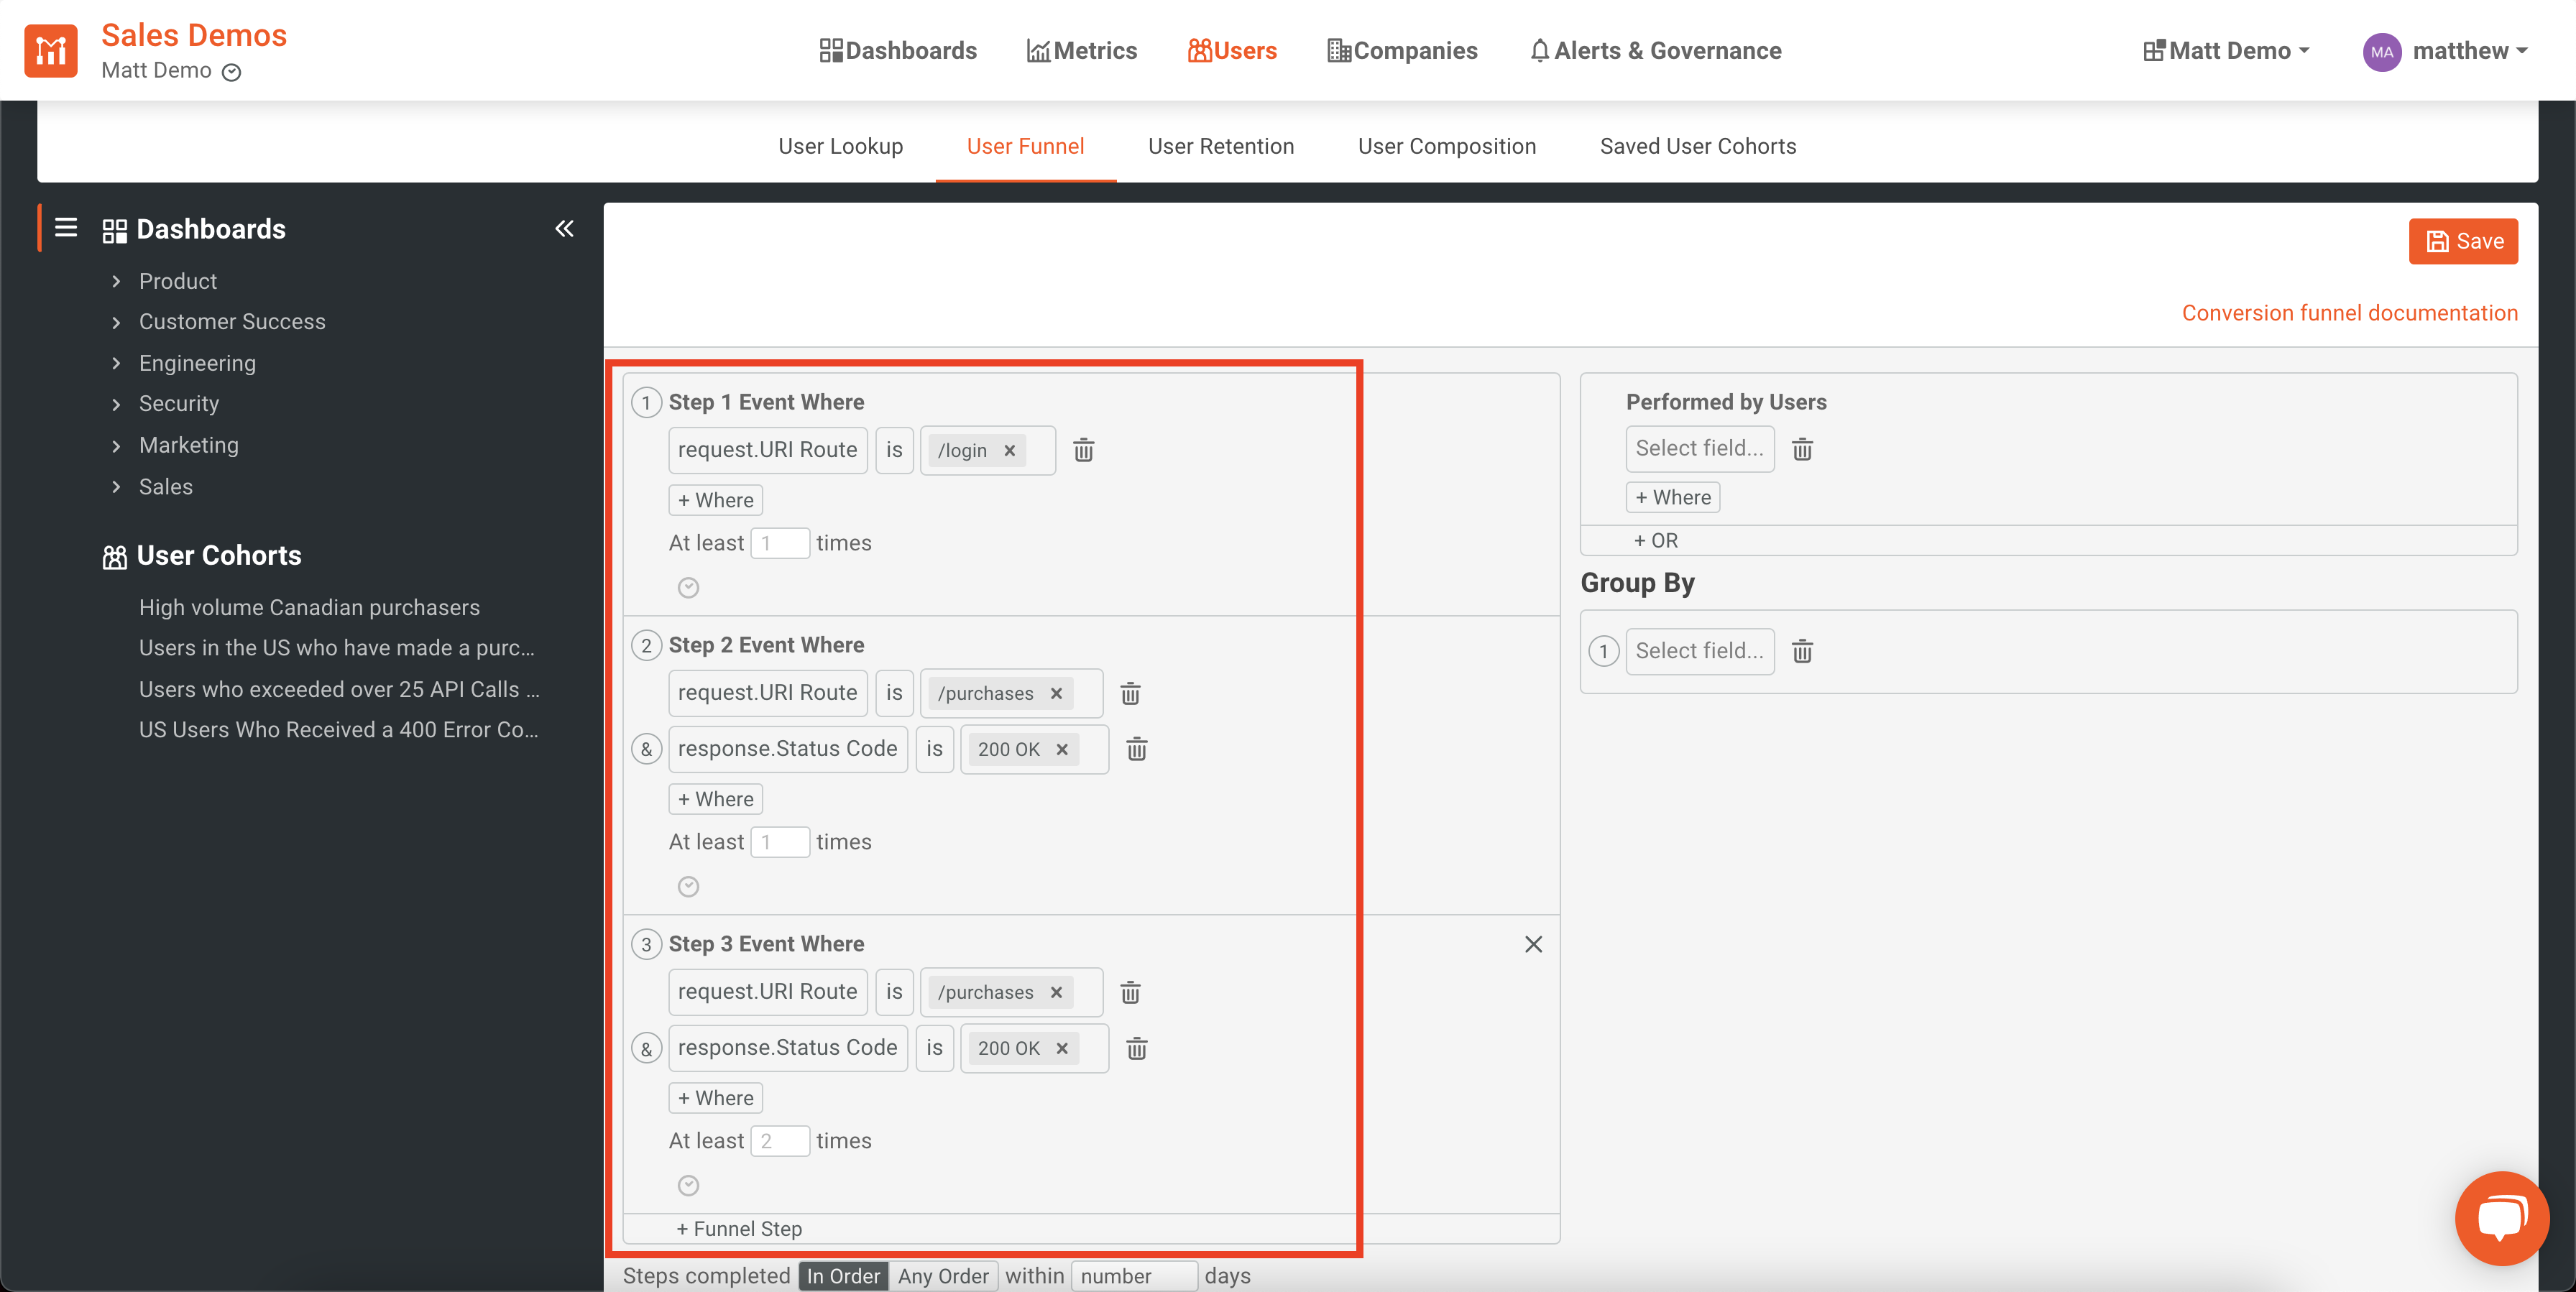
Once here, we will define our 3 steps/criteria which determine each step of the funnel.
Specifically, I will make sure that each call to purchases returns an HTTP 200 OK response so that we know the purchase was successful. We wouldn’t want to count unsuccessful calls towards our funnel metrics.
From this, you can see each step of the funnel that users complete and how long it takes on average to go to the next step.
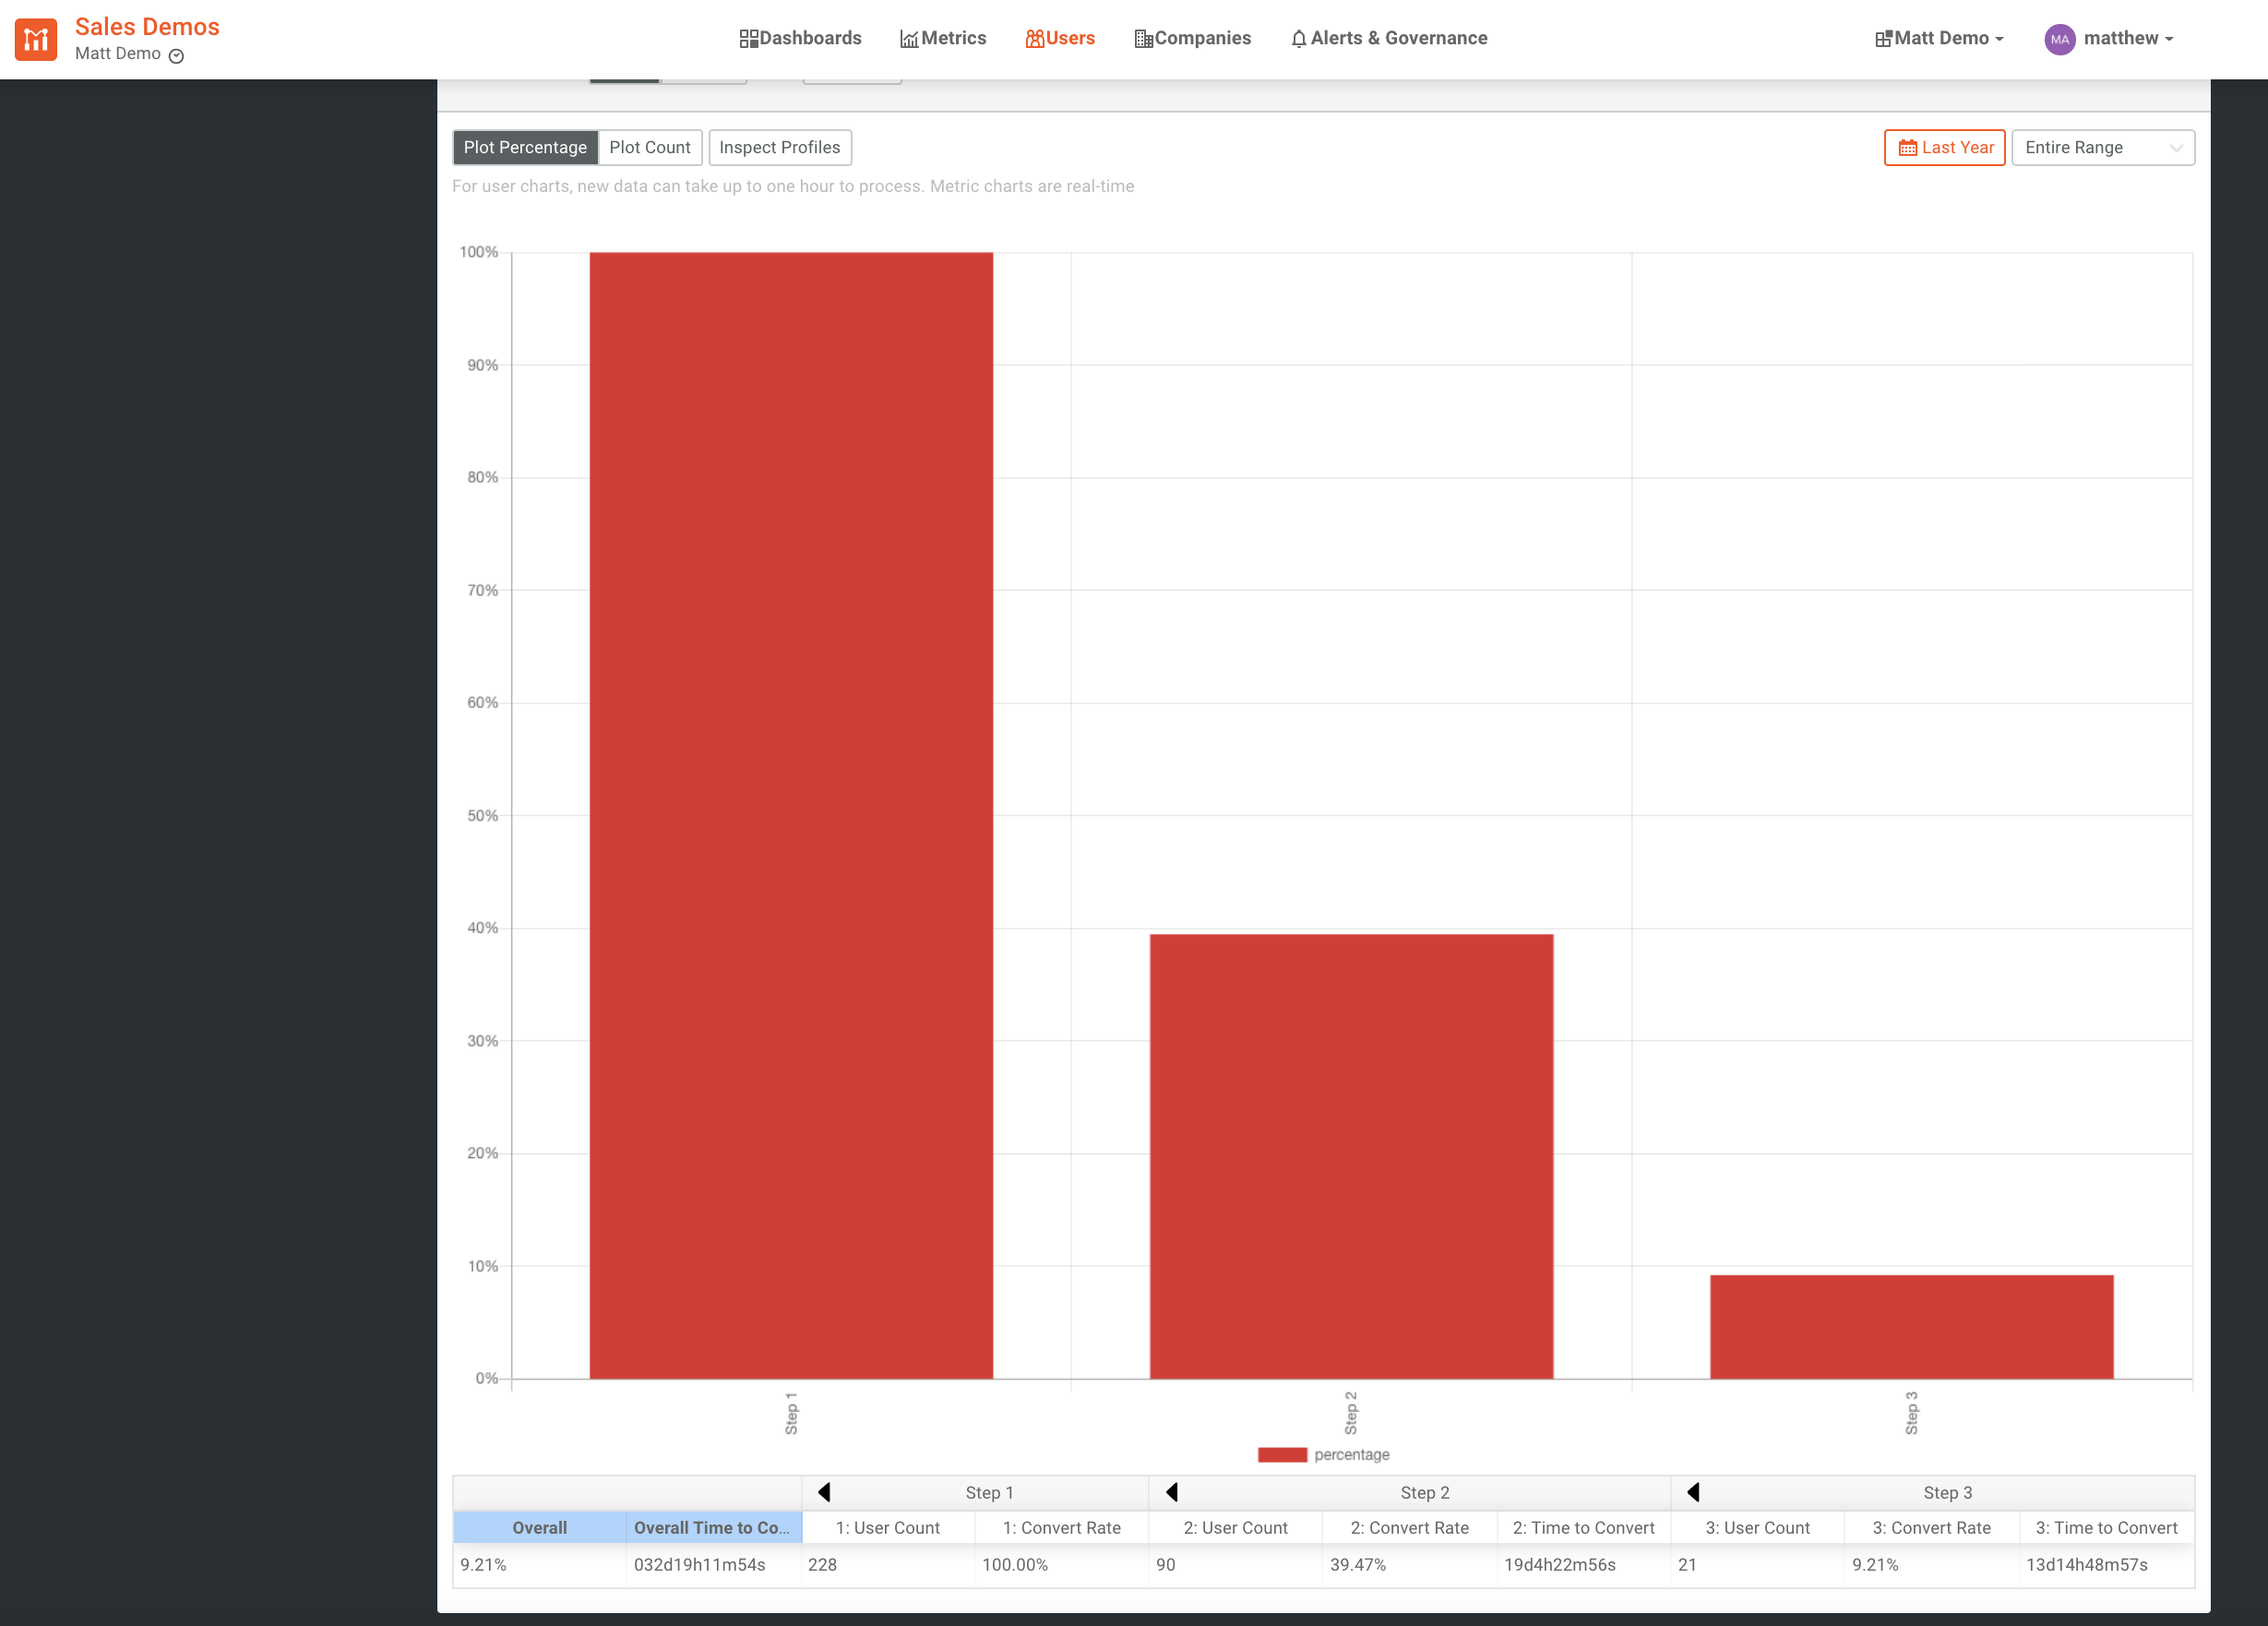
We can see from this funnel that for users to make it through the entire funnel it takes an average of almost 33 days. We also see that only about 9.21% of all users make it through our entire funnel.
To dig deeper into User Funnels, dive into our docs.
User Retention
Another way to leverage user metrics is to dig deep into user retention. These metrics allow you to track how well you are retaining your users but go well beyond just checking to see if they are still signed up for the service.
Active users tend to stick around, upgrade, and promote your product. Making sure that your product is fostering these types of interactions is critical to retention.
With Moesif, you’ll first need to figure out your criteria to show active and returning users. For example, you may say that the first action is when a user first logs into the application and every subsequent login is their returning action. As time progresses, you’ll be able to see how many users are returning each day.
You may also dig in a little further, especially if your application or business is transaction-based. In a scenario like this, you may make the users first call to /purchases endpoint their first action. When they perform another call to /purchases, this will be their returning action. This would signify that the users are deriving value since they are continuing to actively purchase something within your product.
Since you know your business best, you will be the best person to establish when a user first perceived value and what events after can be perceived as them continuing to receive value.
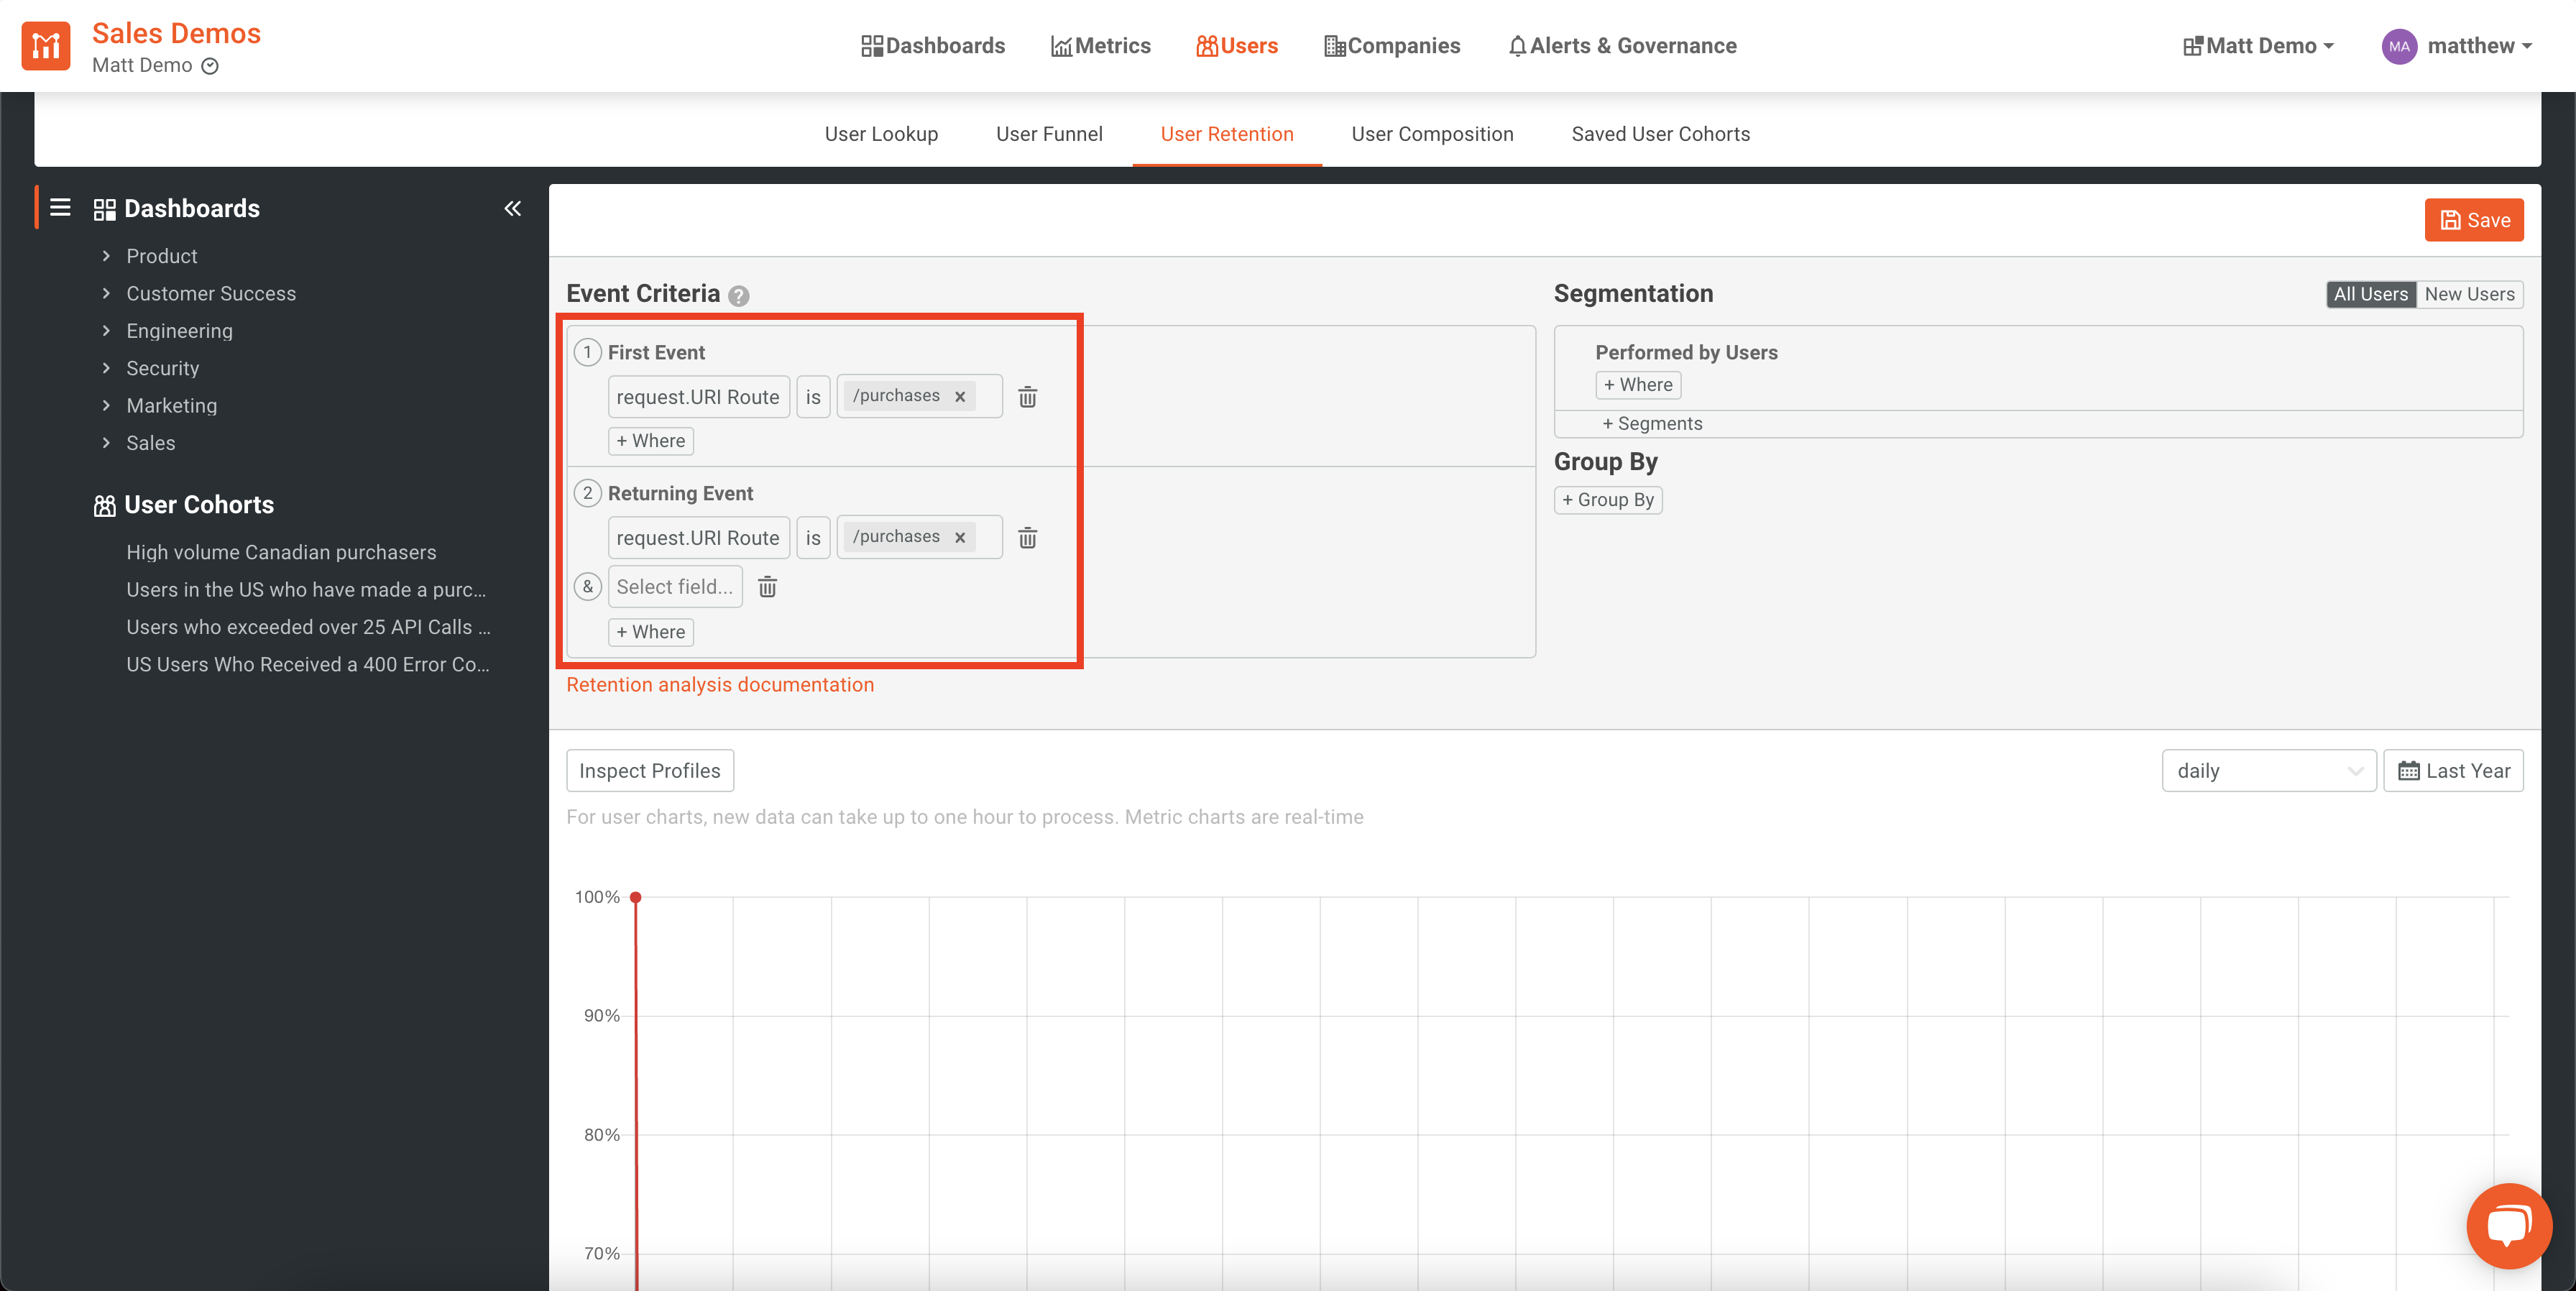
To set up a retention analysis in Moesif, you’ll need to navigate to the Users screen and select the User Retention tab.
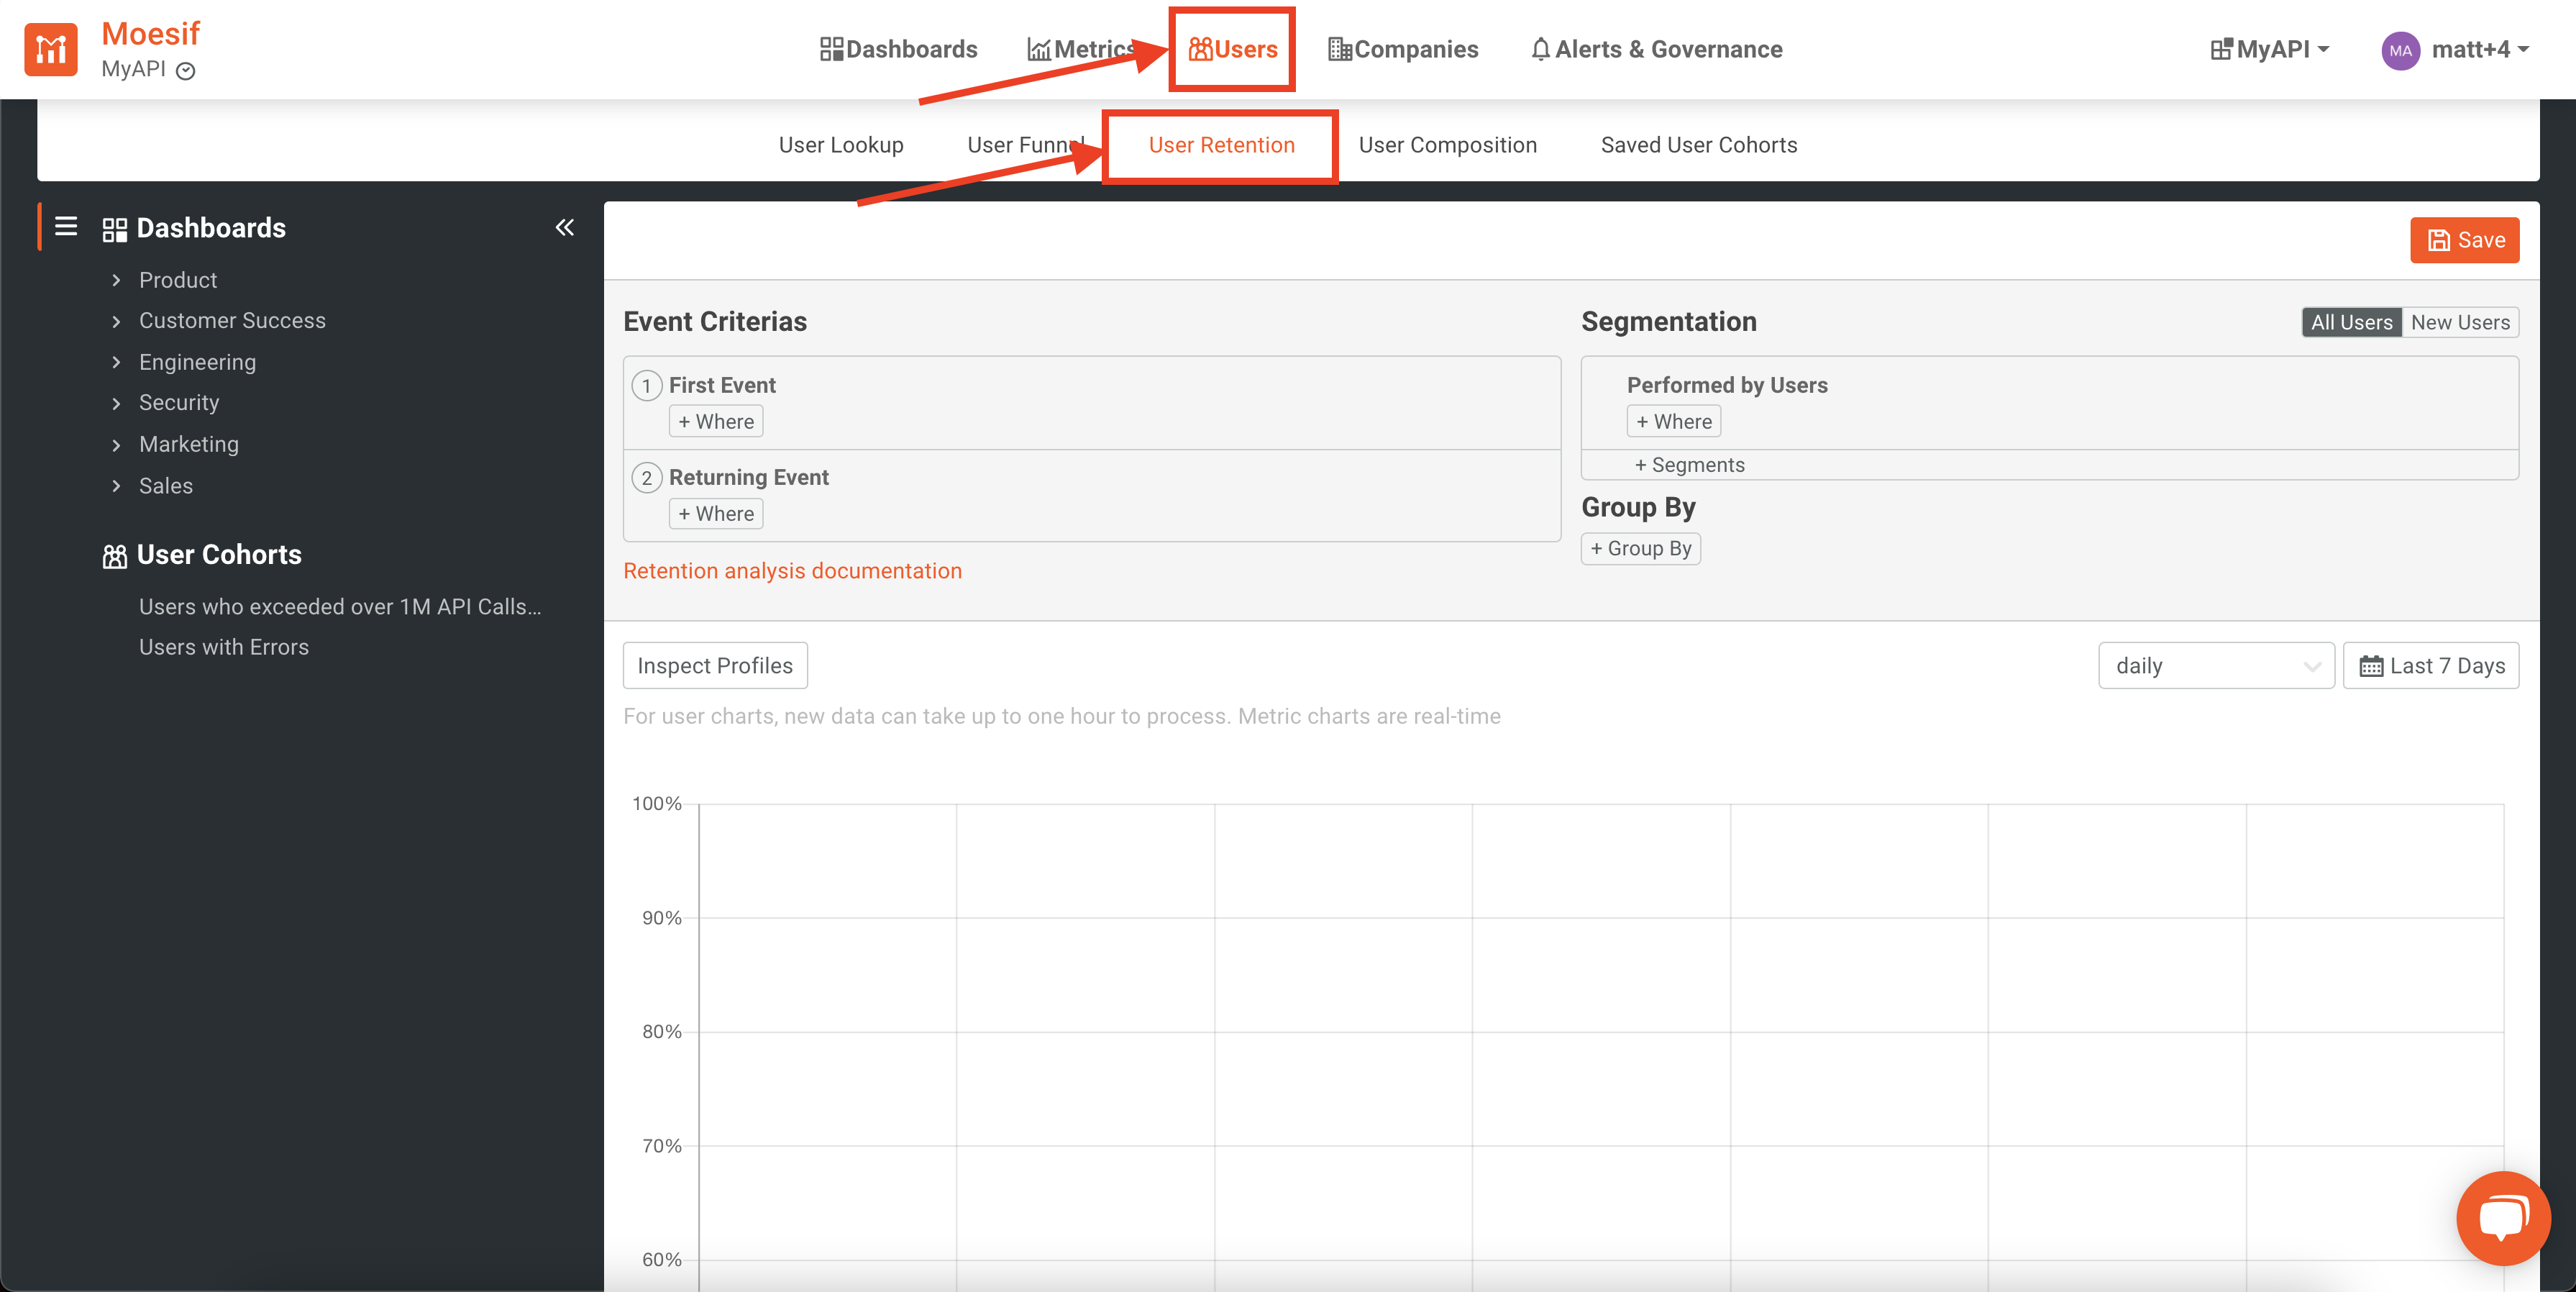
Once here, you’ll define your first event. In this example, we will use the first event as the first time a user makes a purchase. This is defined as a call to the /purchases endpoint. Our returning event will be when a user performs an additional purchase.
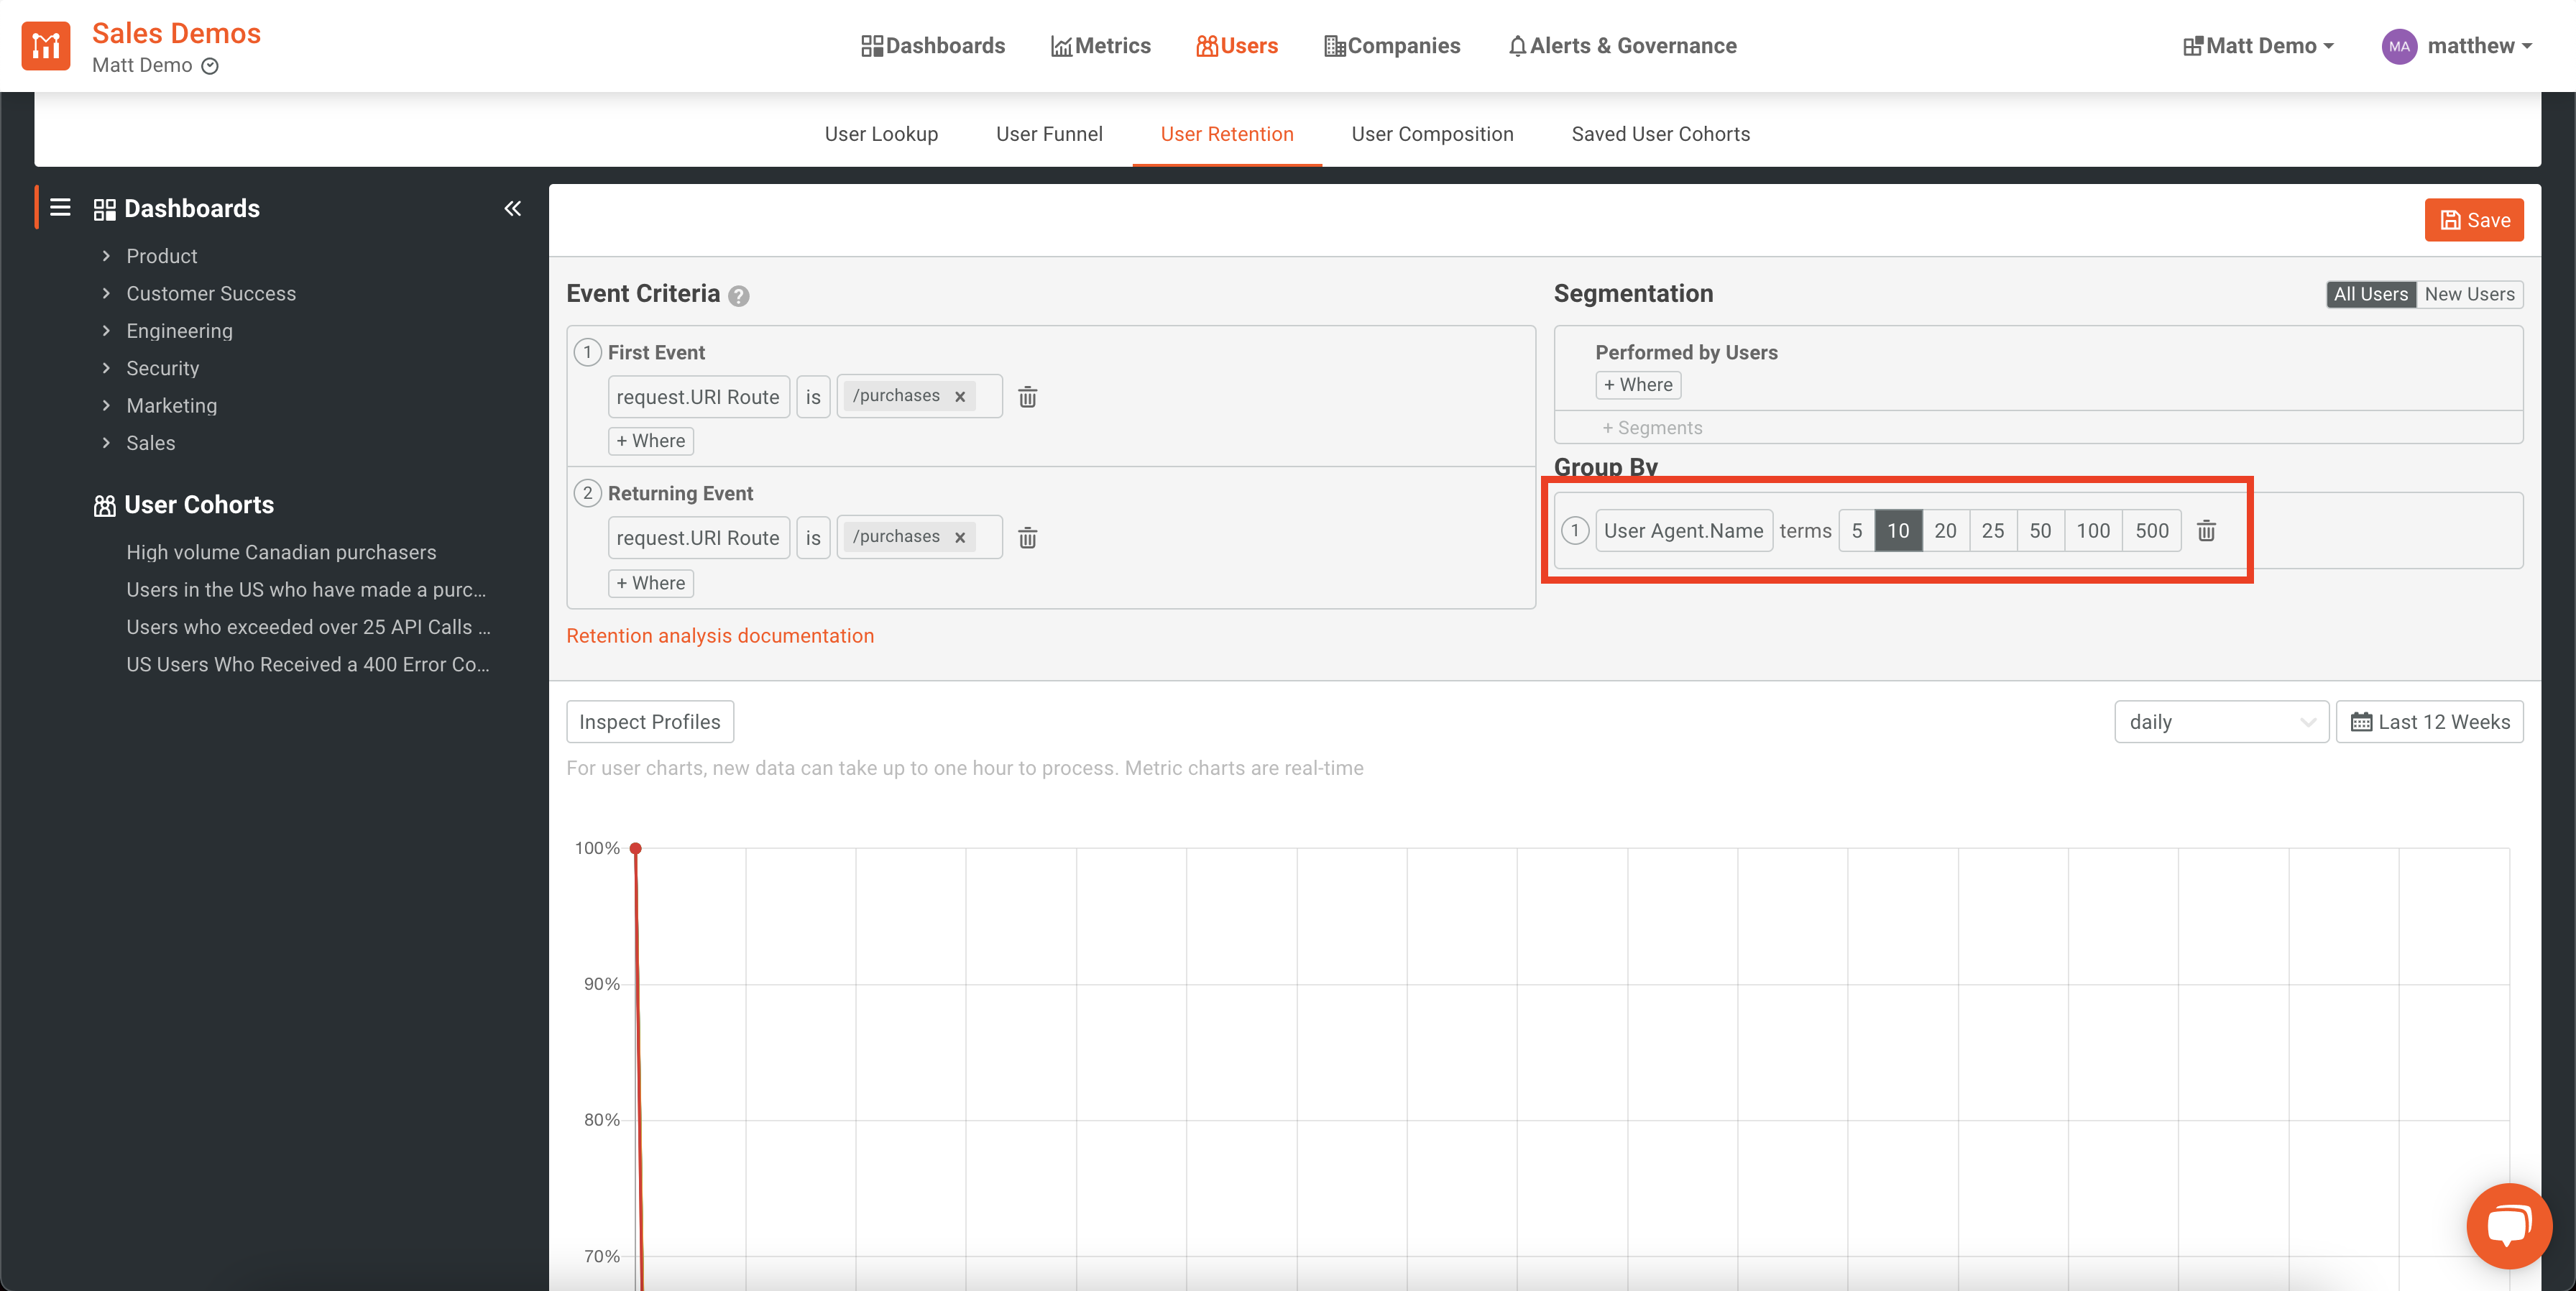
We will also group the results by user_agent.name so that we can see which platforms are experiencing the best and worst retention.
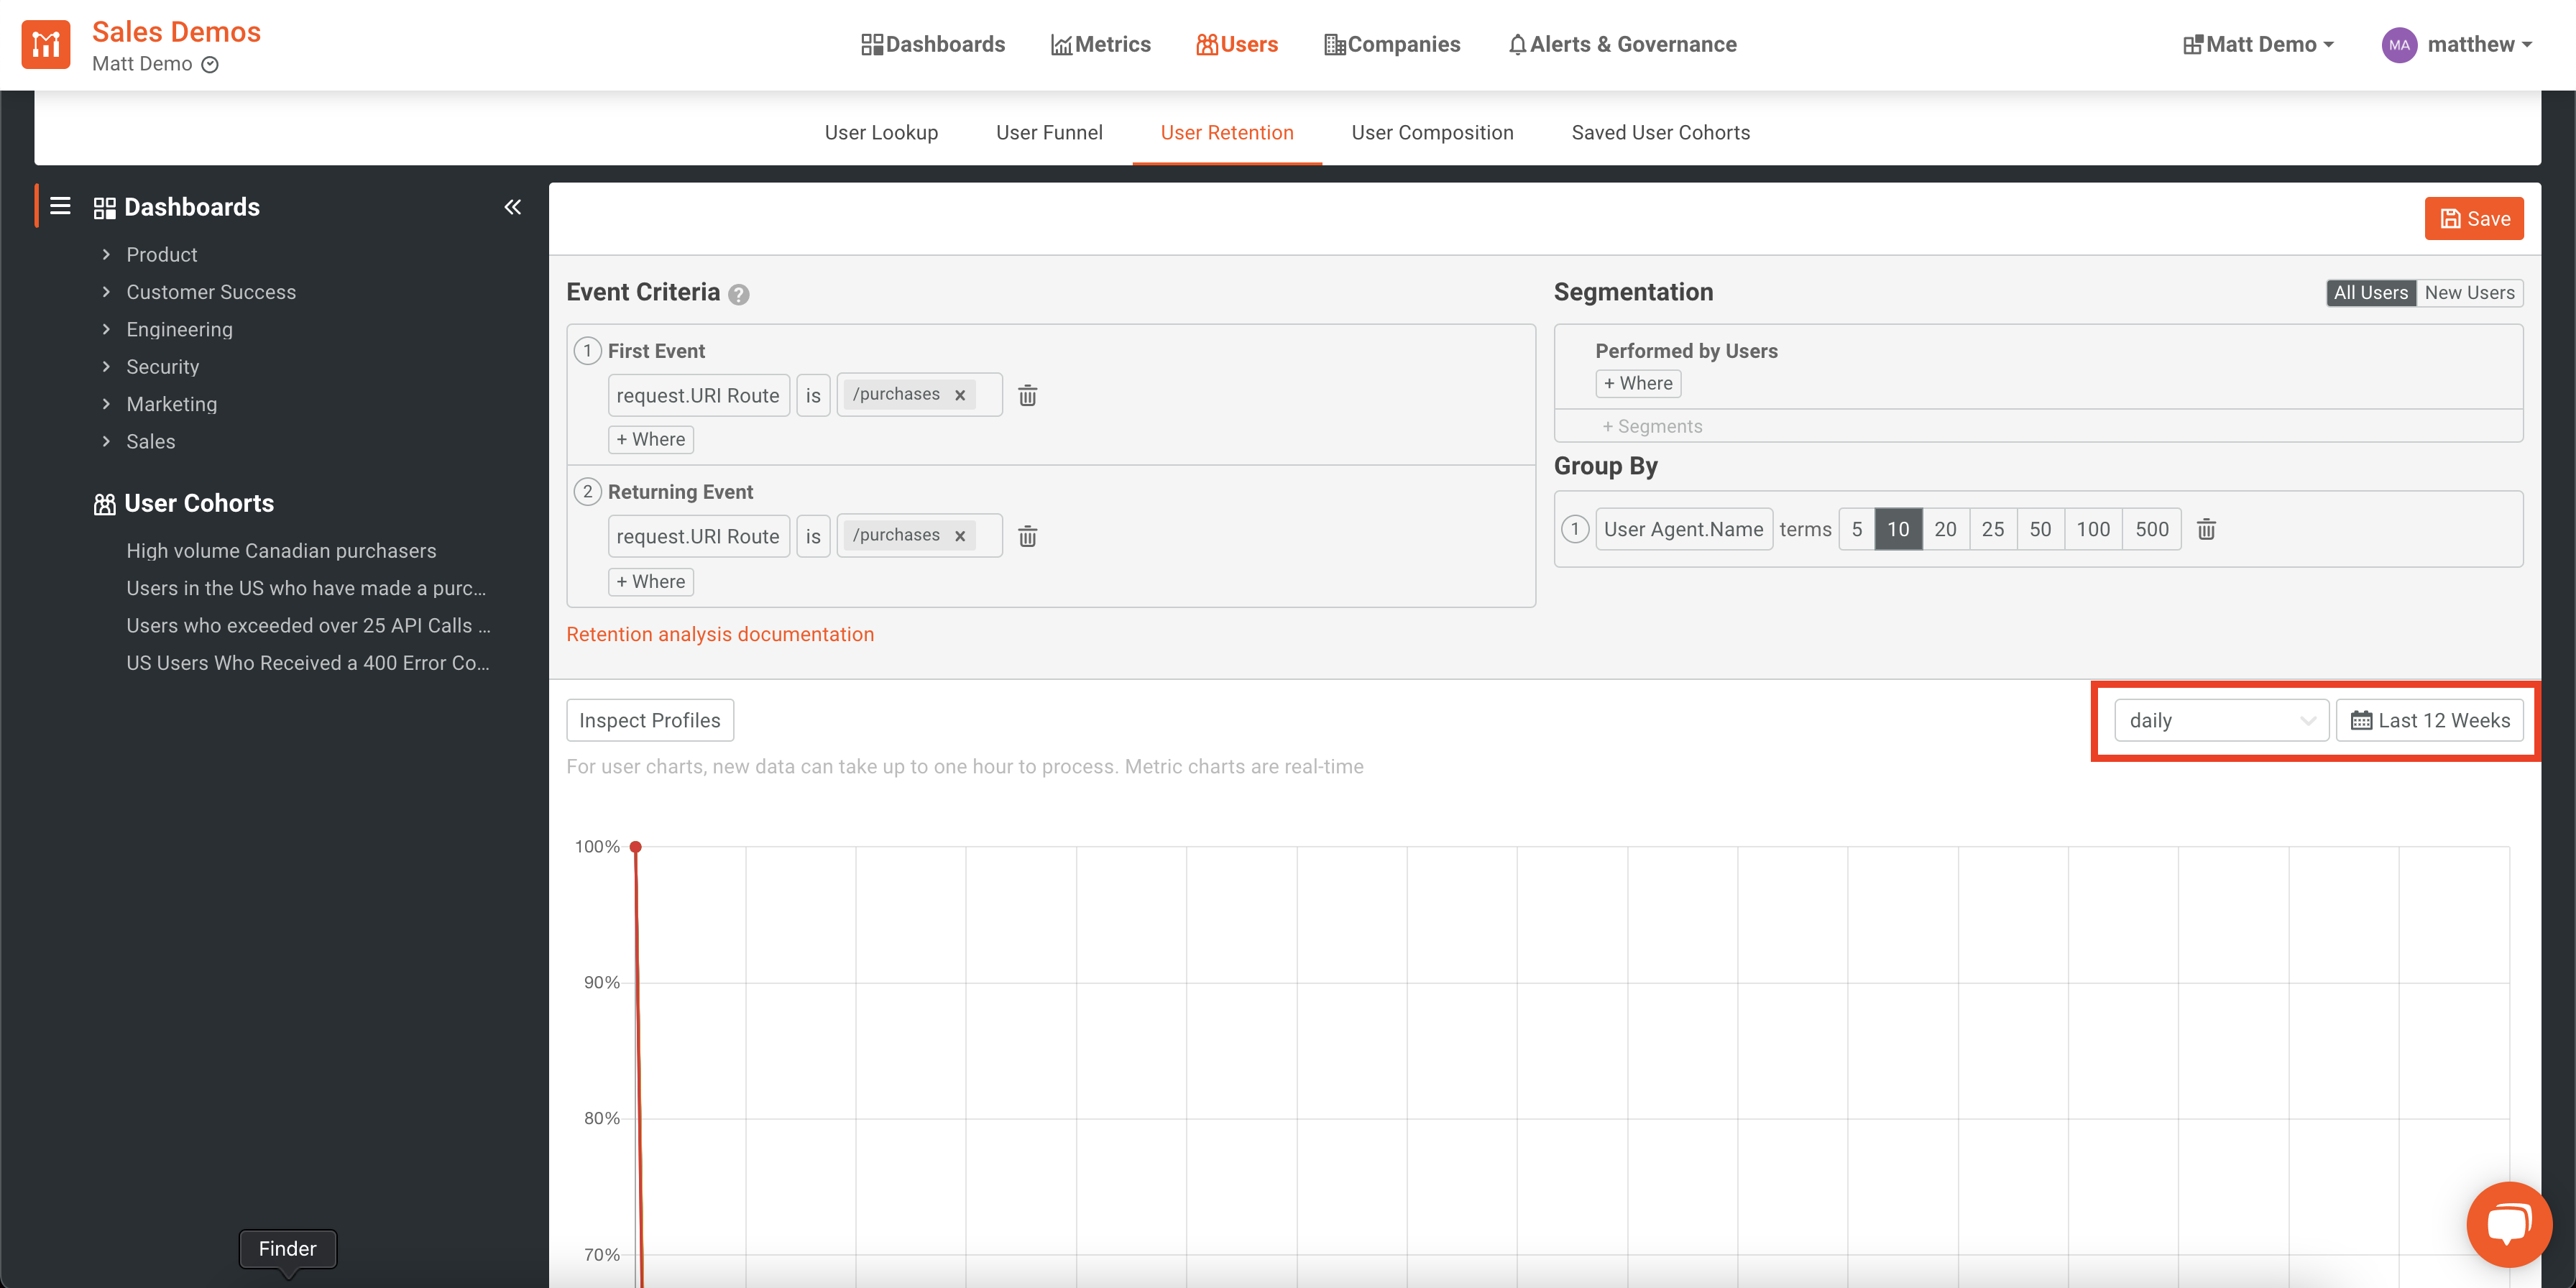
Lastly, we would like to include metrics from the last 12 weeks and view the retention on a daily basis. For that, we will set the following values in the dropdowns to the upper-right side of the chart to “daily” and “Last 12 Weeks”.
From the above output, we can see the daily retention rate based on the User-Agent being used to access the platform.
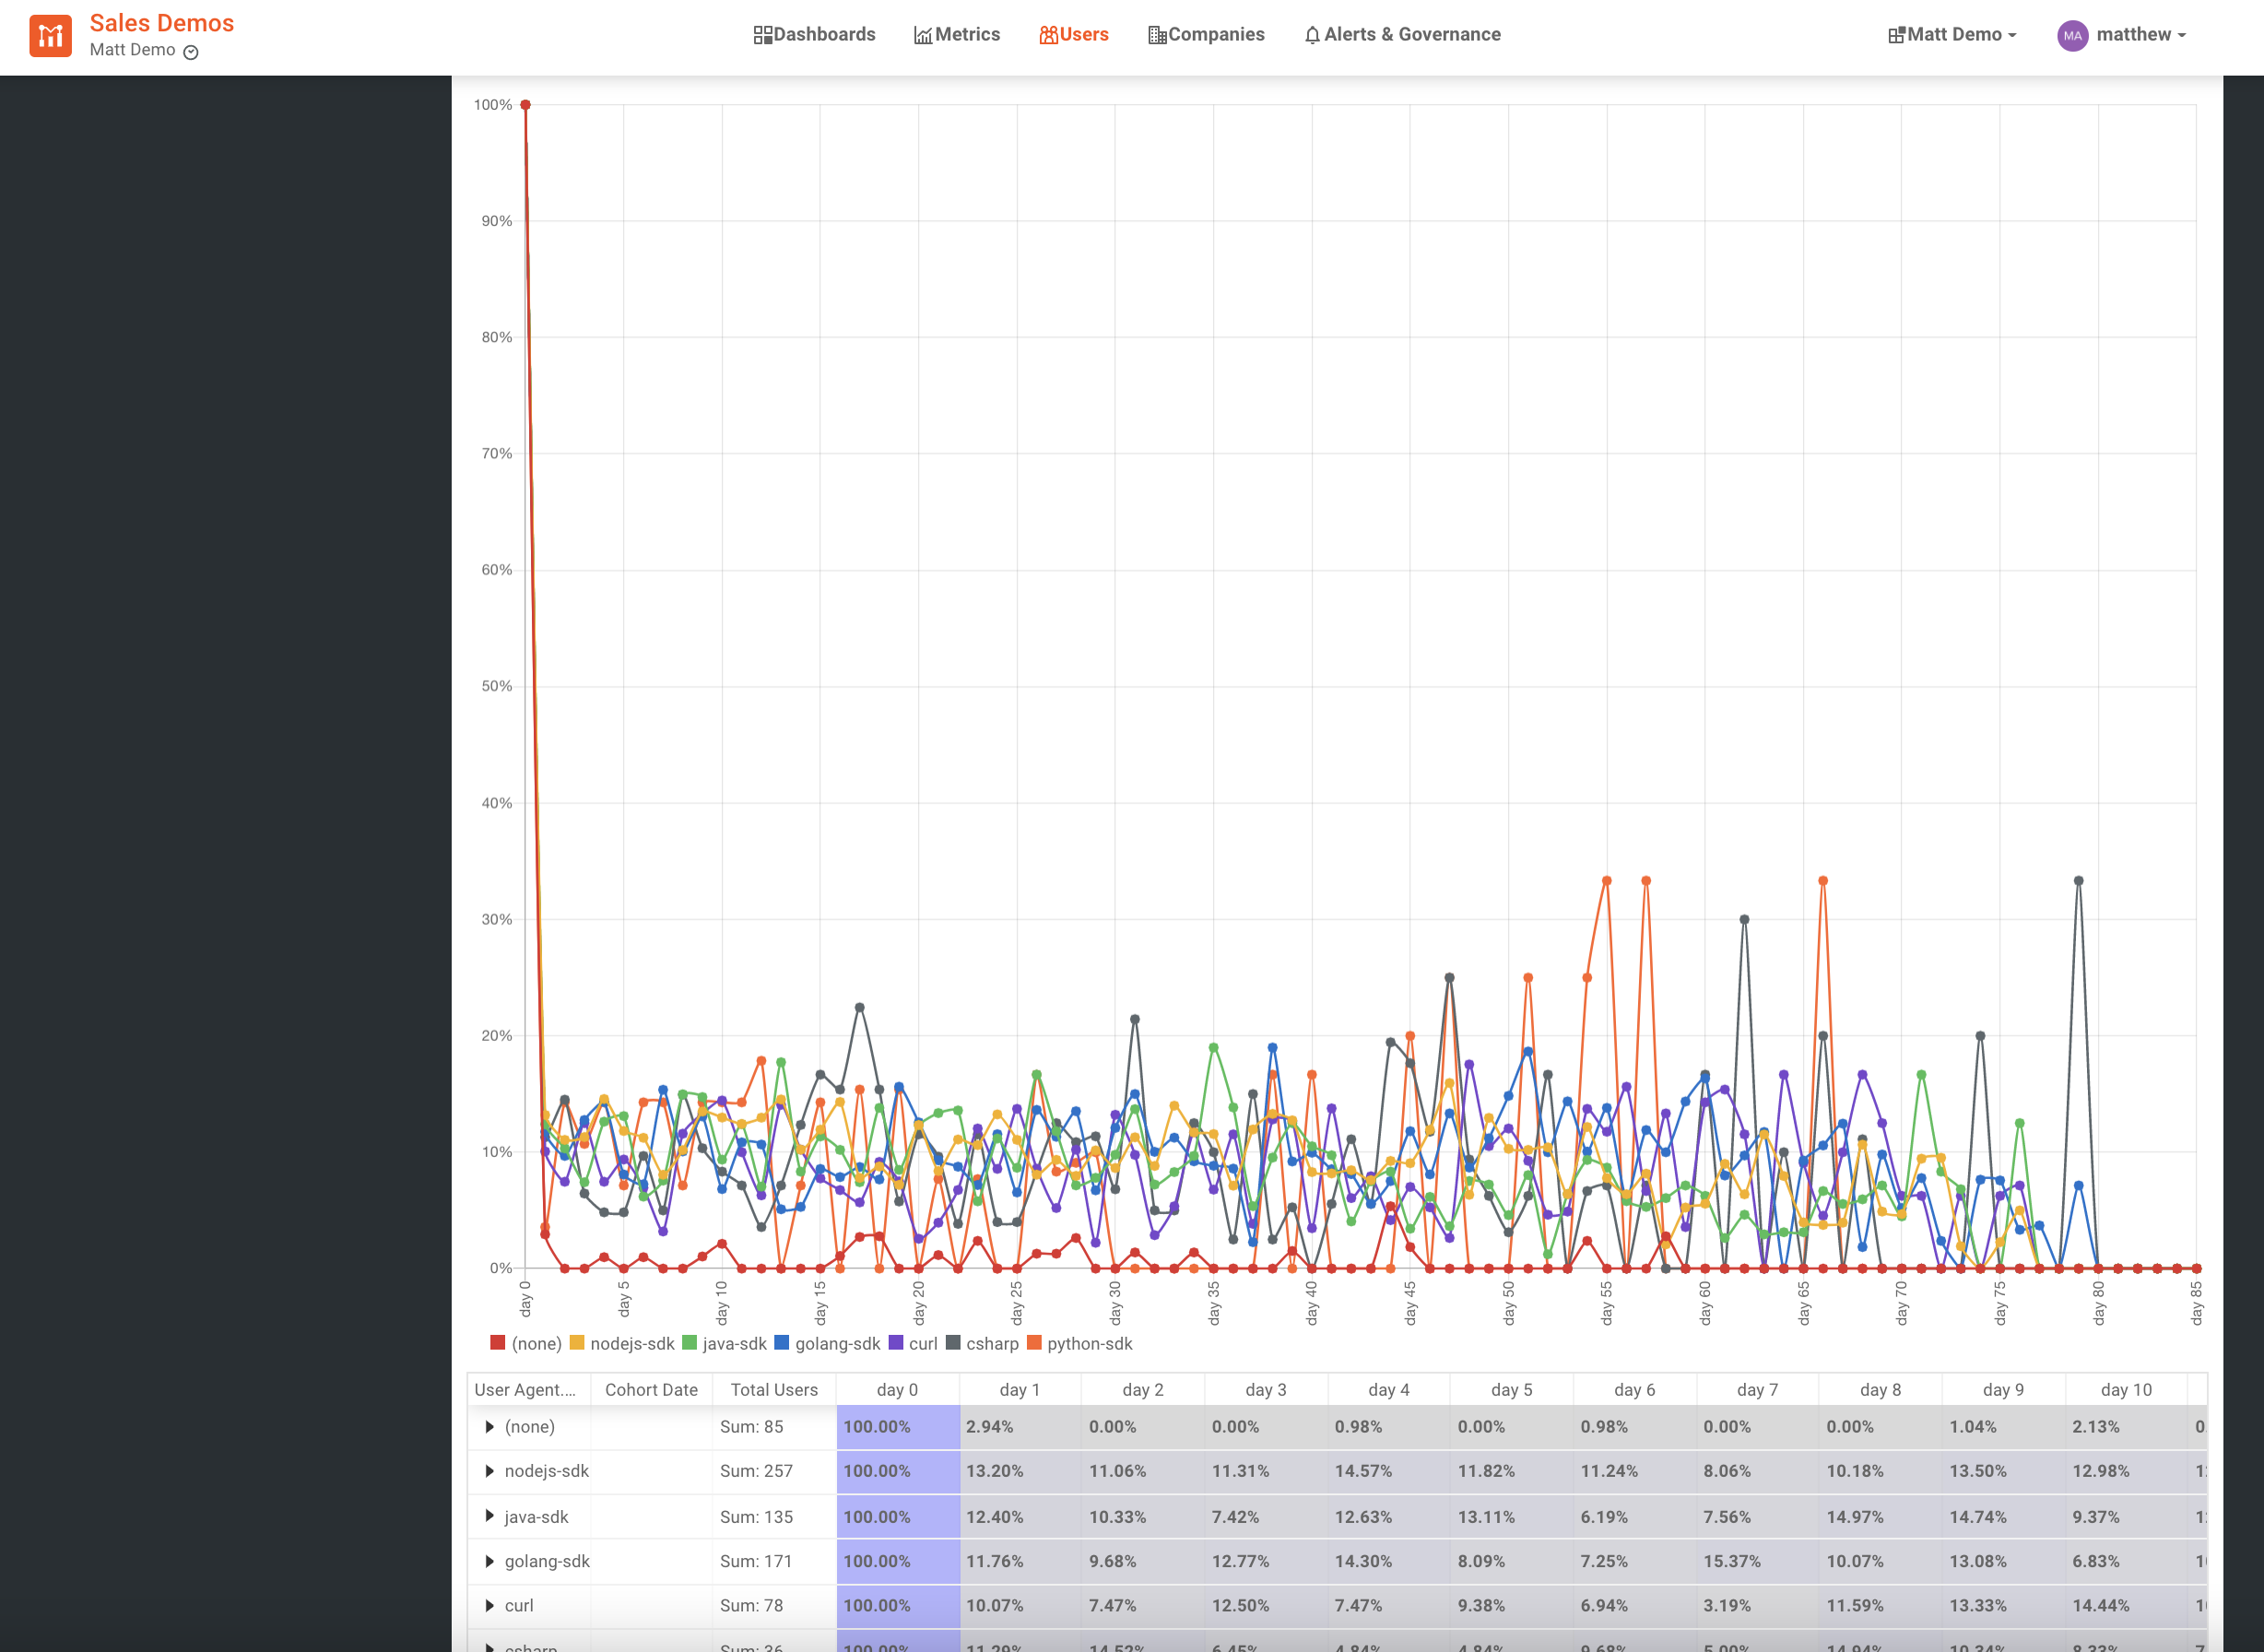
An accurate retention analysis can help to track changes in your retention rates as your organization experiments and aims to improve. Tracking retention is one key metric to look at when analyzing your business’s health.
For more info on how to create a retention analysis in Moesif, check out our docs.
User Composition
Once you’ve explored your individual users, your funnel metrics, and your retention rates, you may want to figure out your user composition.
User composition allows you to take a deep look at your user base. You can stay very high-level and group large segments together or can go very low level by filtering your users by extremely particular metrics and criteria.
User composition can be filtered by a specific user property, such as company or location, or by users who performed specific events.
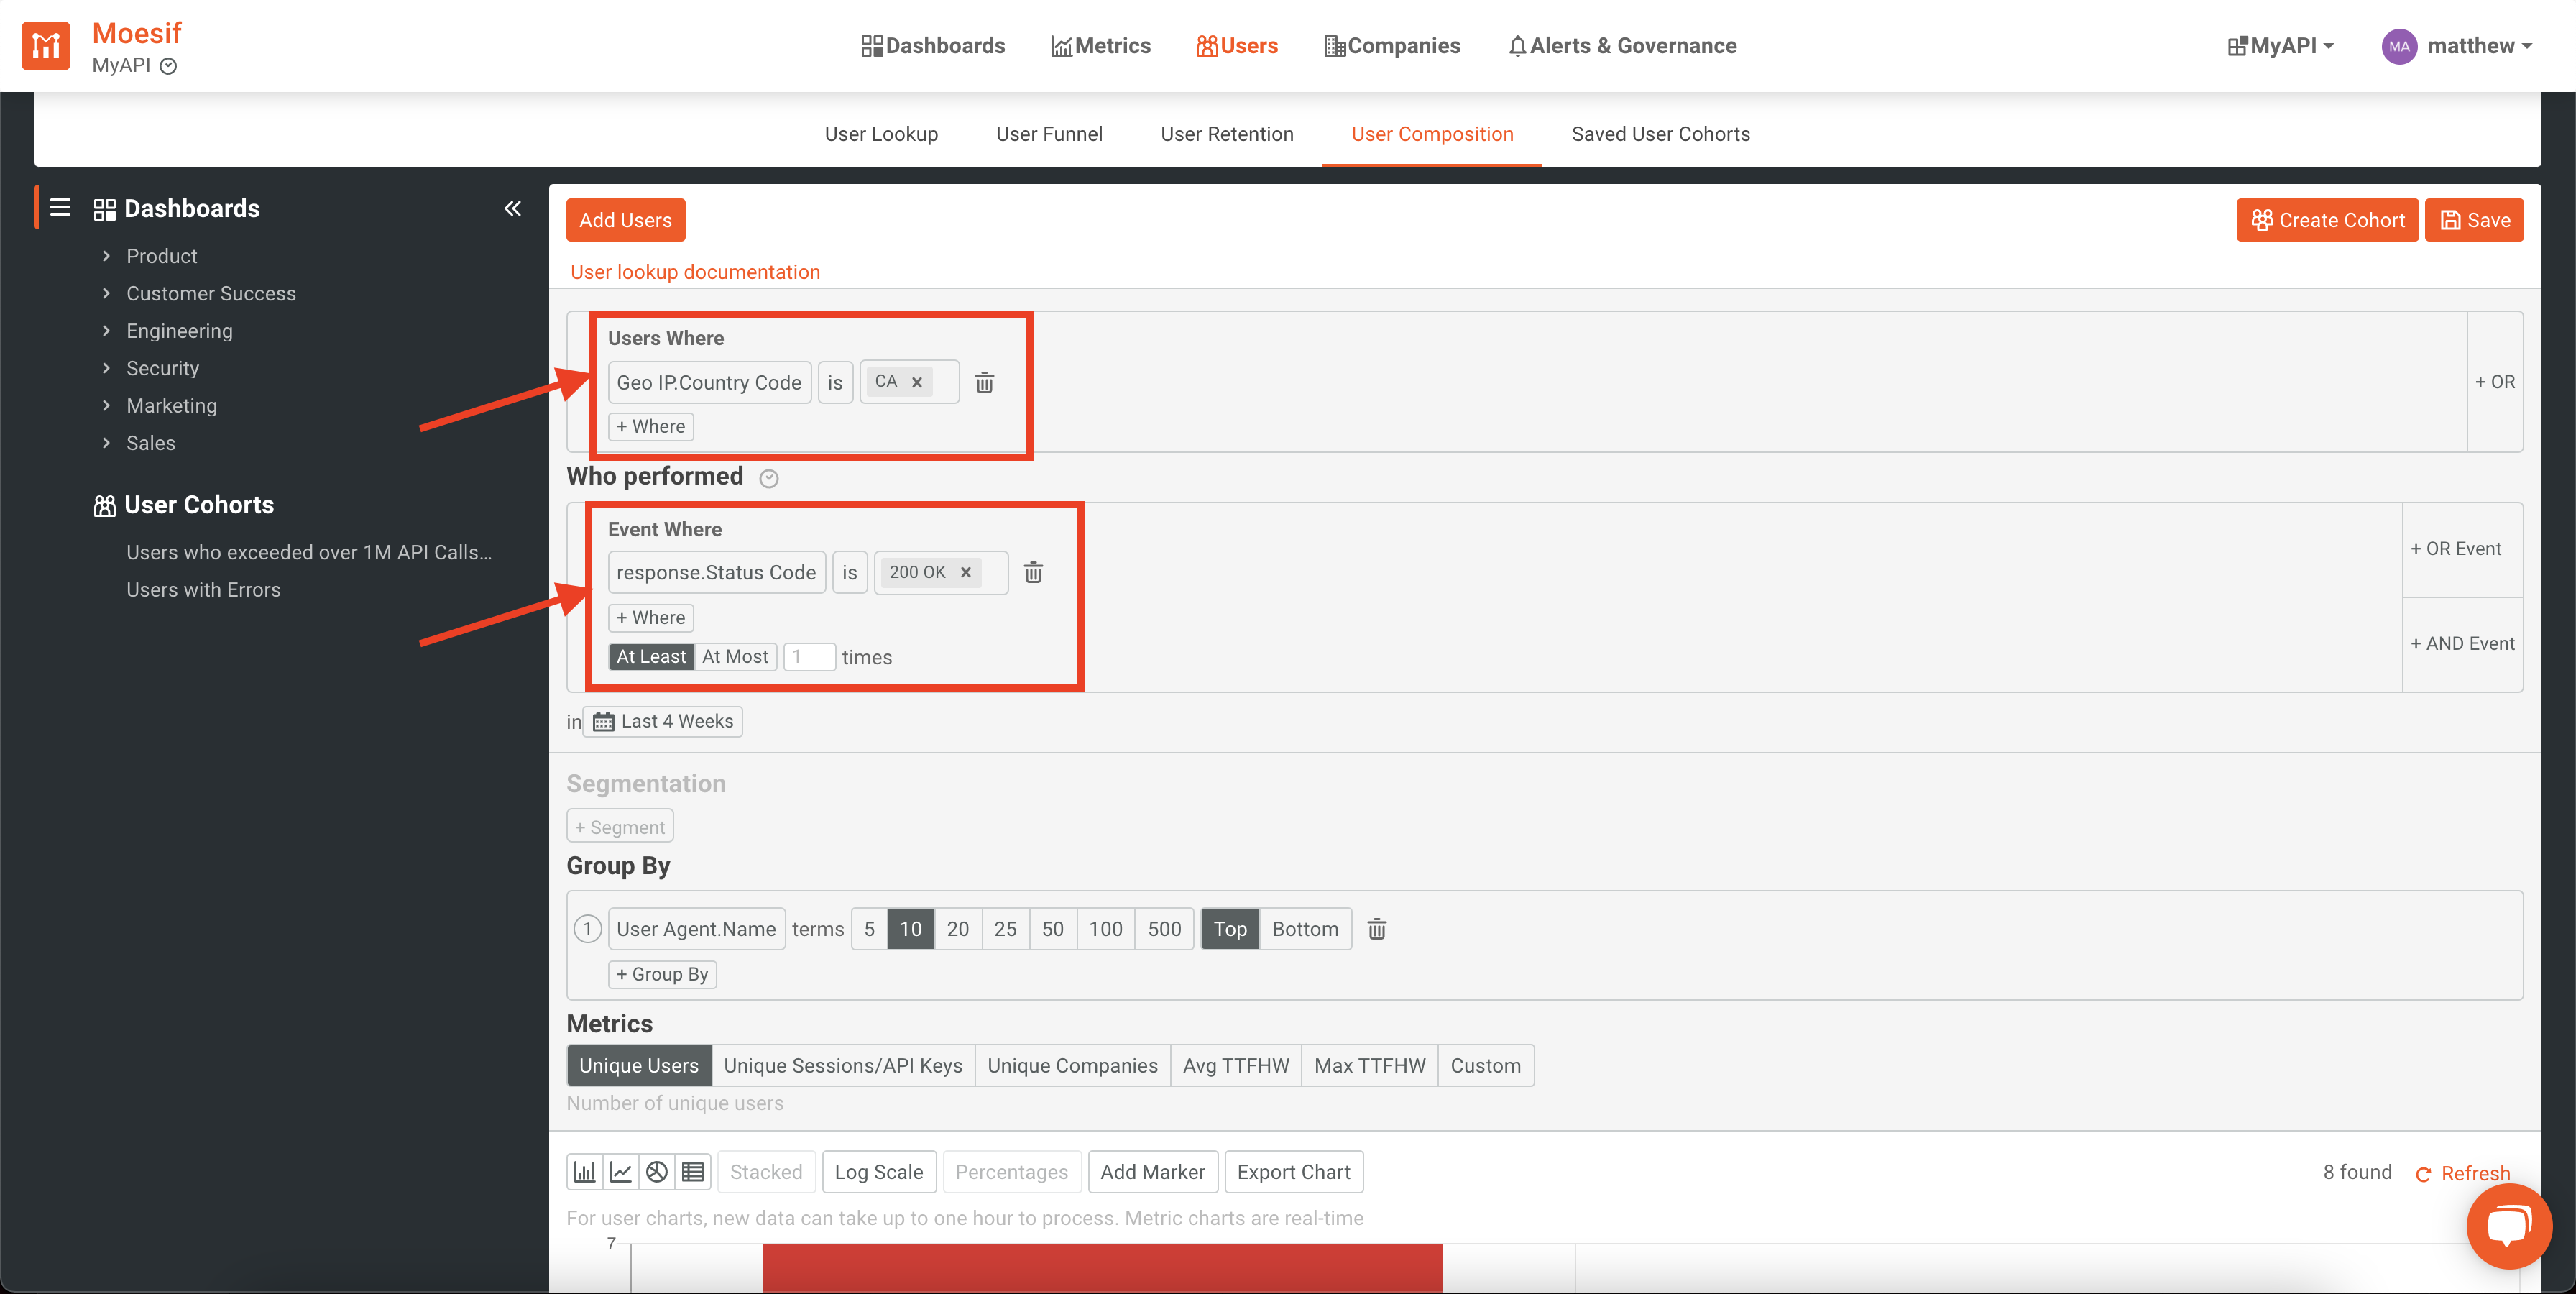
Here is an example where I am filtering by users who are located in Canada who have successfully received an HTTP 200 OK response from an API:
Once you’ve set your filter criteria, you can dig further by grouping the results by a specific criterion as well by setting the Group By criteria. An example of this could be grouping by user-agent (what platform the traffic is coming from), by country, by company, or any other possible groupings. You can choose whether you want to show the top or bottom of the grouping and how many entries to include. For instance, you may only want to show the user composition of the top 10 companies within your analysis.
If you choose a Group By criteria which involves a time metric, you can then group the data by date_histogram which includes time intervals of 1 day, 7 days, 1 week, and 1 month.
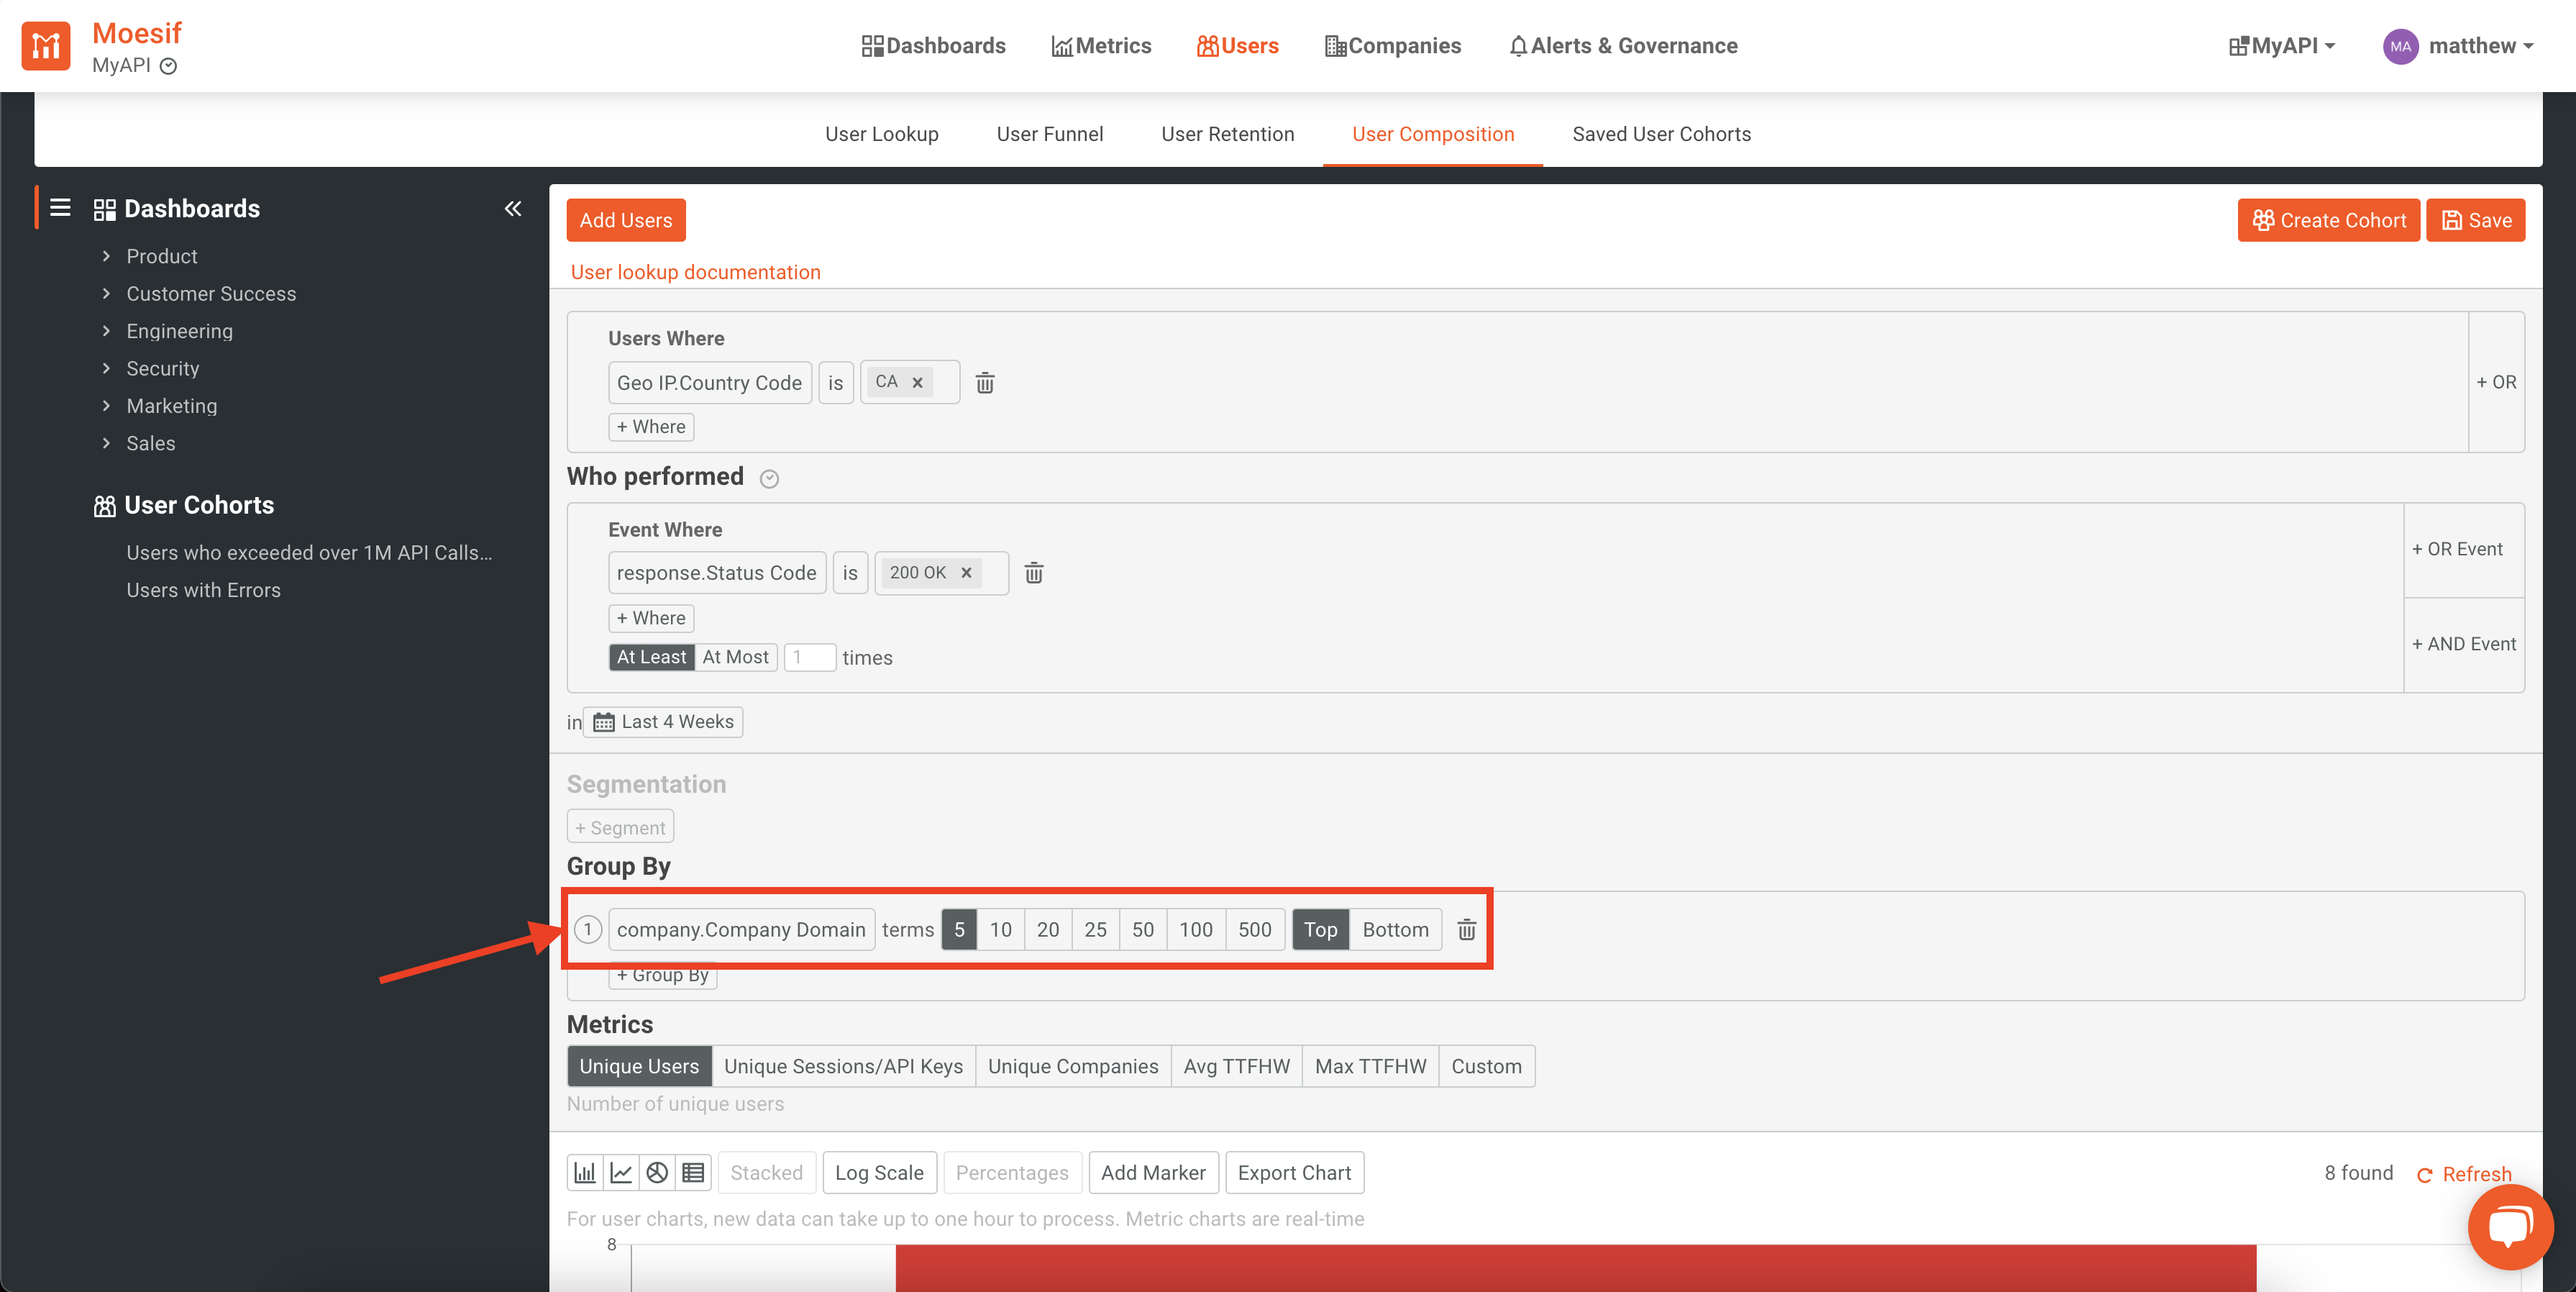
To add to the example above, I have added a Group By which will group the results by a user’s Company Domain and show results for the top 5.
Lastly, the results of this query will be shown based on whatever metric you choose. Moesif has some predefined ones as well as the ability to create a custom approach. This will be the metric that will be shown in the resulting visualization or chart. Predefined metrics include:
- Unique Users
- Unique Sessions/API Keys
- Unique Companies
- Average TTFHW
- Max TTFHW
Adding to the above example, we will make sure that the Unique Users metric is the one that is selected.
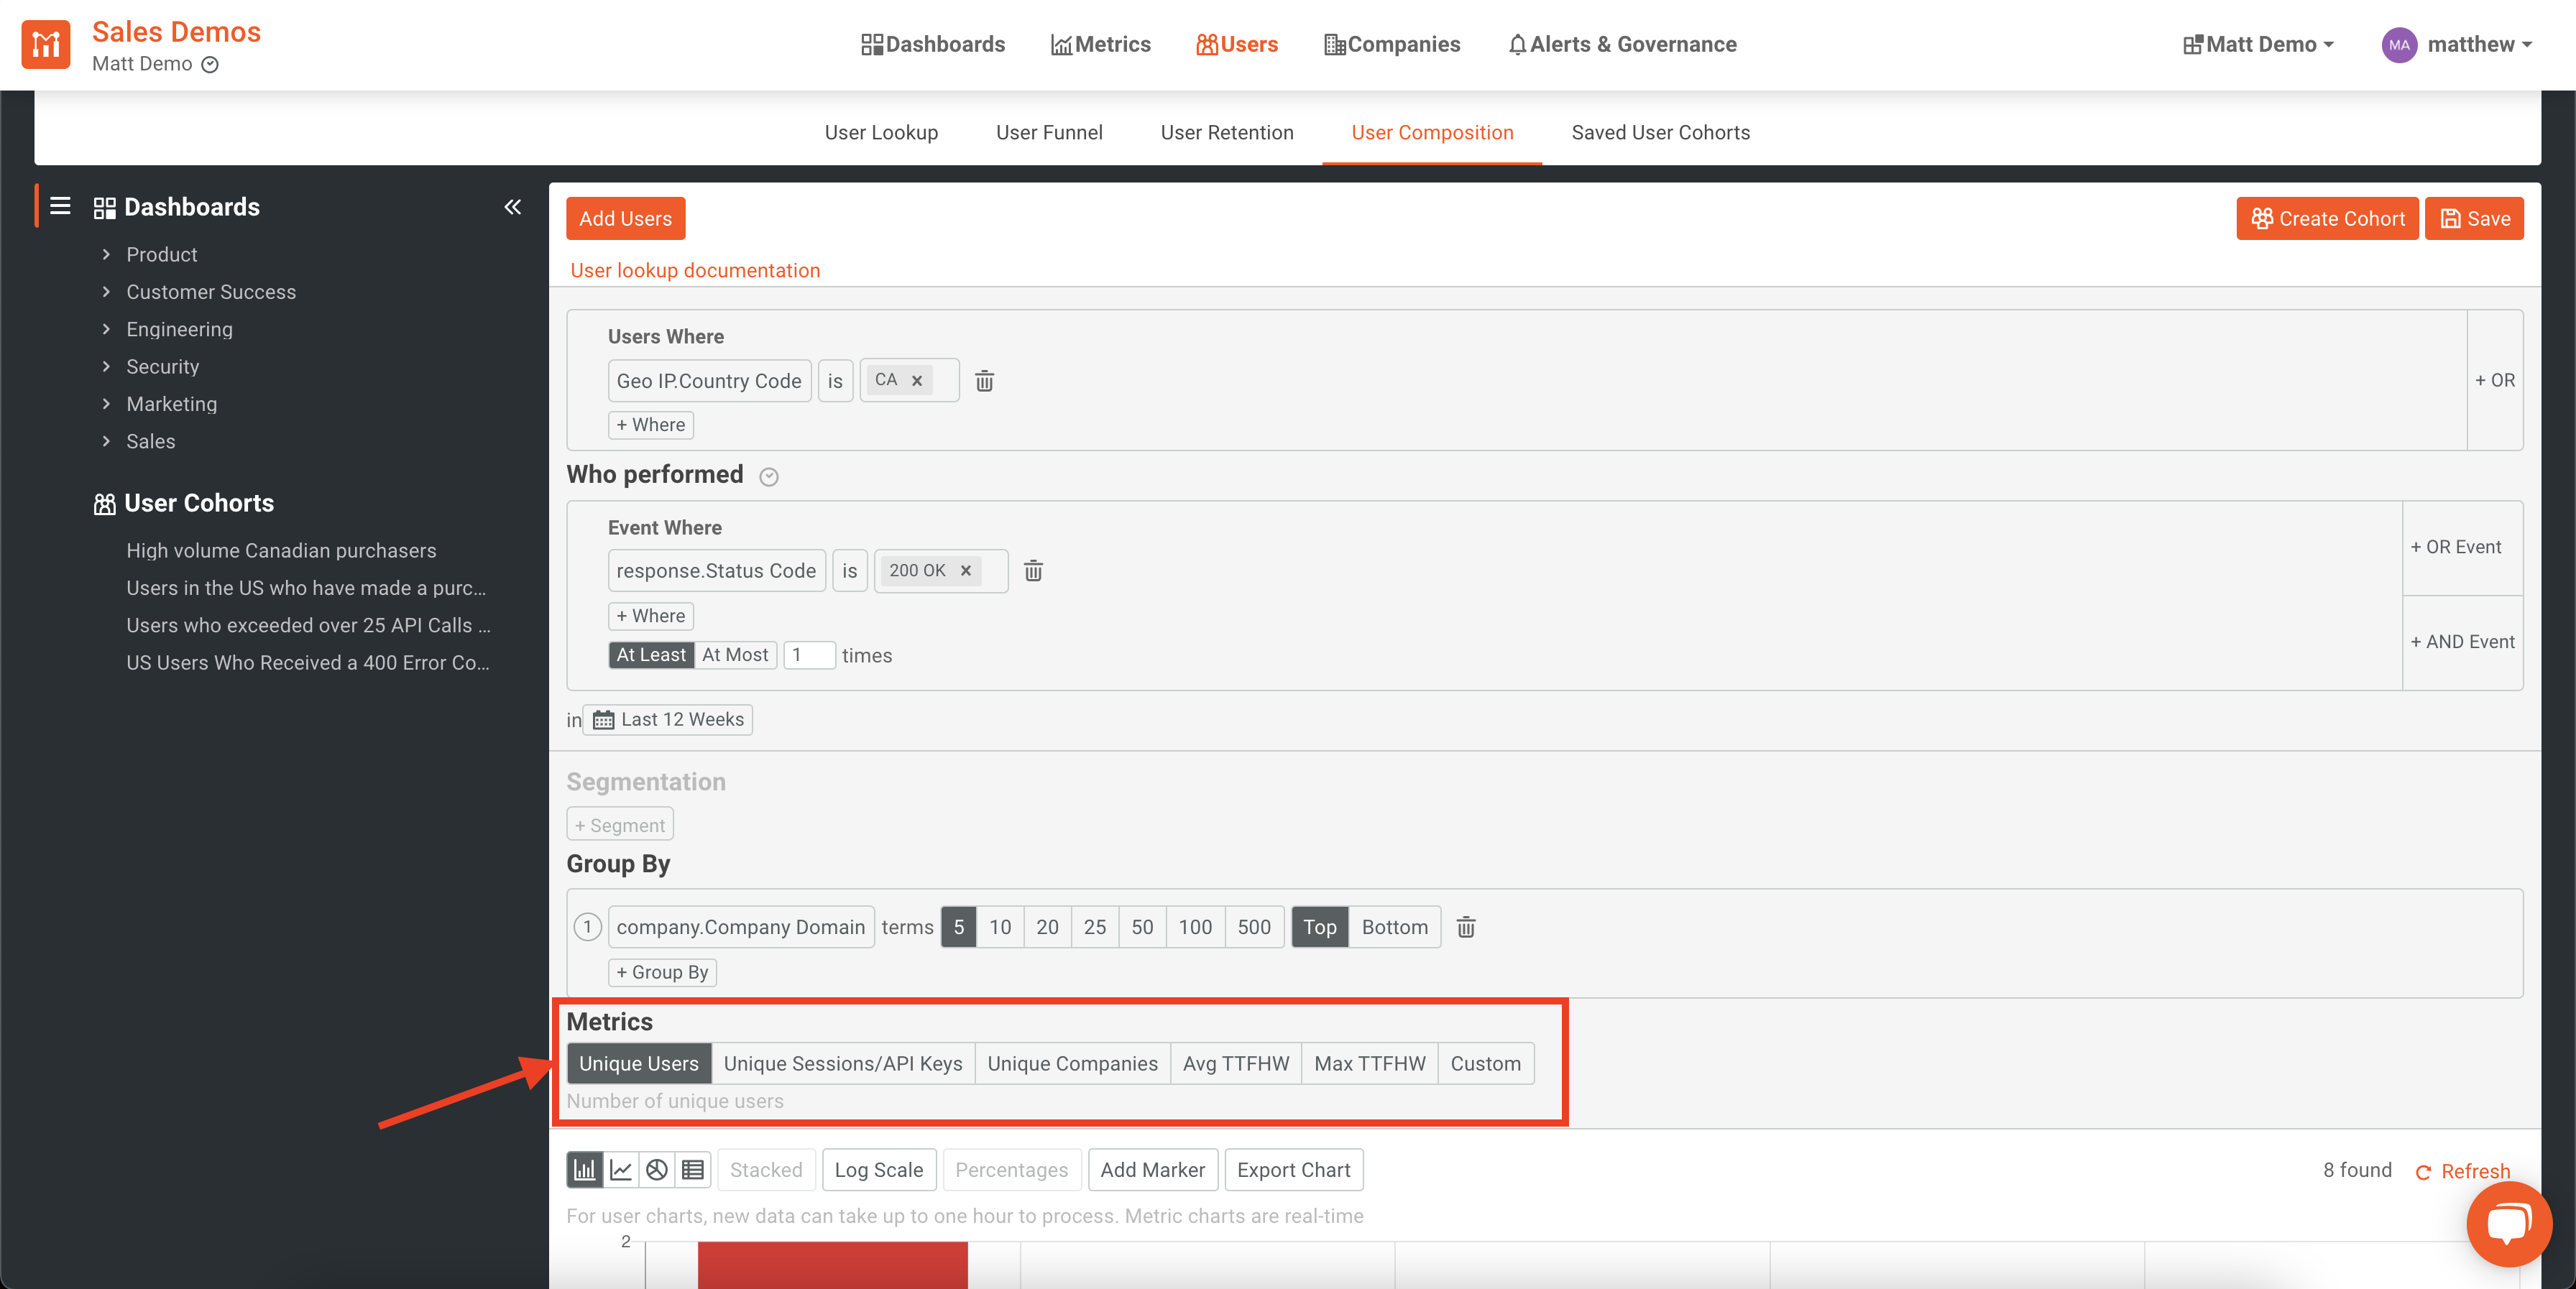
With all the filters selected, the result will be Users in Canada who have received an HTTP 200 OK status code. This resultset will then be grouped by users Company Domain and display the top 5 results. Lastly, the results displayed will show the unique users that each of these companies has that have matched the filters.
The result would look something like this:
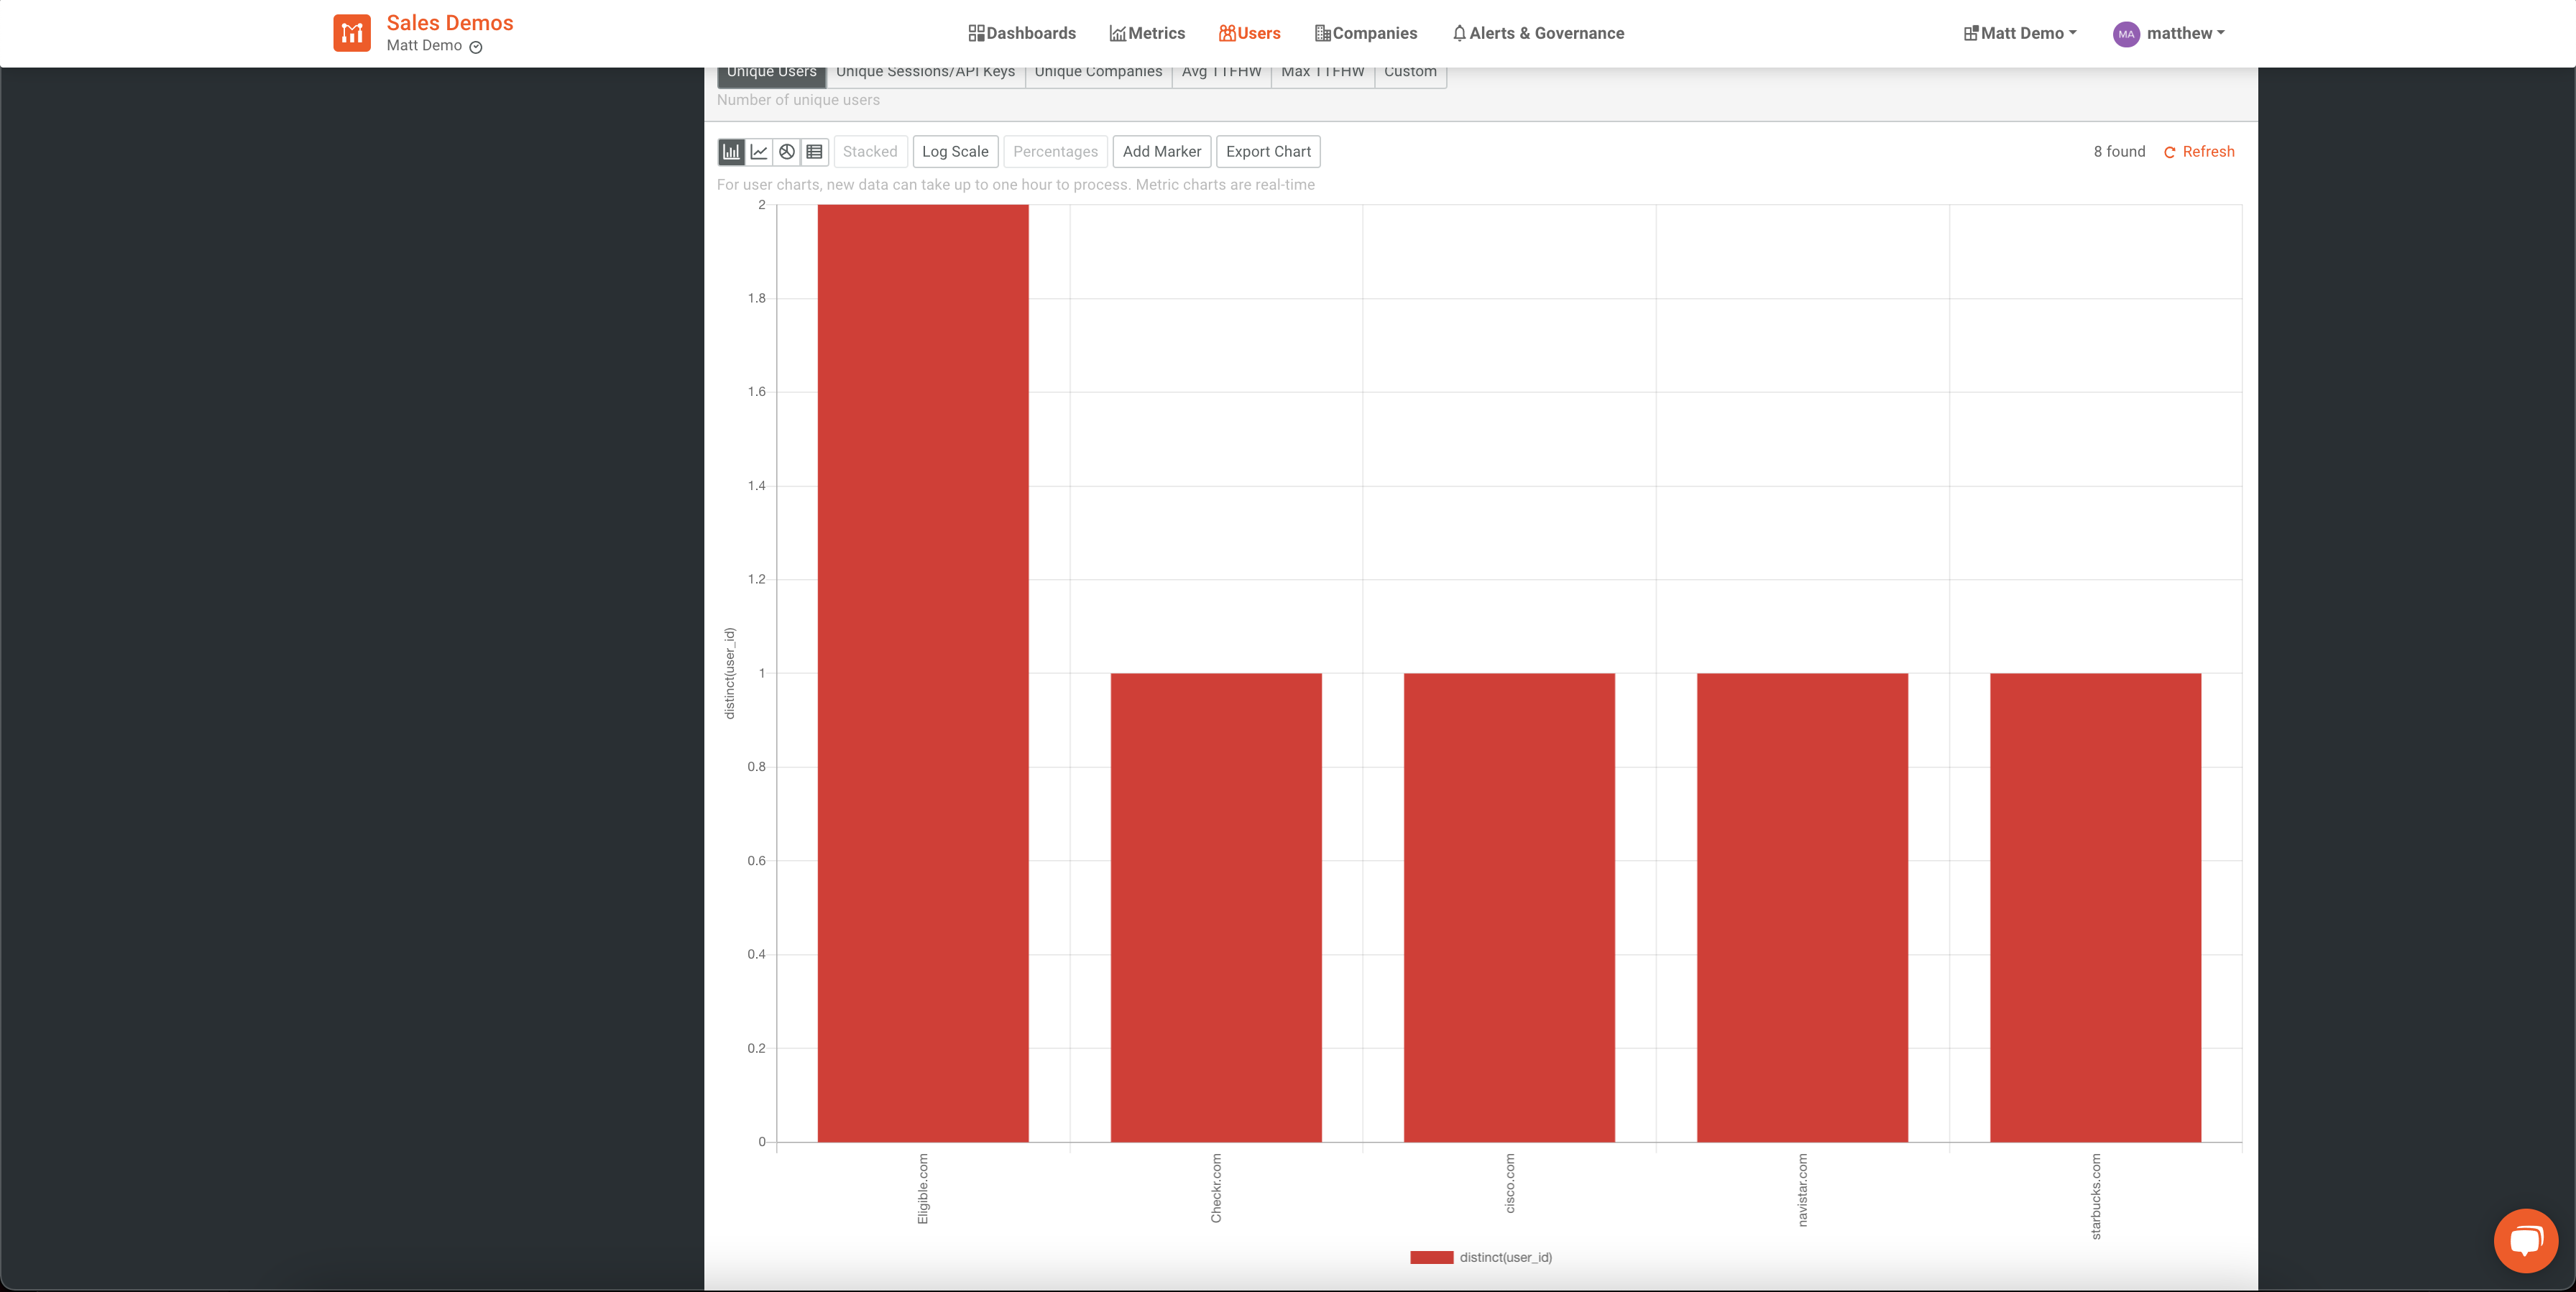
In this chart, we can see the results of the above criteria based on a sample dataset.
By using the User Composition feature in Moesif, you can gain valuable insights which show your current user demographics and can manipulate filters to find very precise details about different segments within your user base.
Bringing it all together
With these 4 tools within Moesif, you’ll be able to see everything that you need to empower your business. You will easily gain powerful insights into your users and their interactions with your product. To recap, we covered:
- User Lookups/cohorts
Quickly and easily look up users based on what they did with your platform and find details about them. Very similar to a CRM-style solution, but with capabilities to look up based on what they did, not just their attributes Create filters and save the resulting lists, also known as a saved user cohort
- User Funnels
Define steps within your application to create your user funnel and track conversion rates through each step.
- User Retention
Create an analysis that tracks users retention to ensure that users are actively using the product. This goes beyond just tracking subscriptions or similar metrics but actually allows you to define criteria to ensure your users are deriving value from the product, the main factor in retention.
- User Composition
Easily explore the composition of your user base by setting up criteria, filtering, and sorting the results. Create great visuals and charts which show who is using your product and how they are using it.
Looking to get started? Simply log into Moesif and try these great features out. Don’t have an account yet? Sign up for a free trial and start exploring your user analytics and beyond in a few clicks.

Related Articles

API Strategy
Leveraging AI For a Better API Strategy
Learn how to leverage AI to build and fortify your API strategy. Improve design, governance, documentation, and align APIs with business outcomes.
API Strategy
The 5 Best Mixpanel Alternatives of 2025
Learn about the best Mixpanel alternatives to determine the right analytics solution for your use case.

API Development
How to Leverage Moesif Effectively for API Observability
Effectively leverage Moesif for API observability through best practices for integration, event enrichment, custom actions, and engineering workflow integrat...
API Strategy
How to Build an Internal Chargeback Model for Your API and AI Usage Using Moesif
Use Moesif to implement internal chargebacks and enable precise API and AI cost attribution for better transparency and resource optimization.