Building Your Own In-App Charts? Use Moesif Embedded Templates Instead!
Certain products can benefit from having real-time charts displayed within them. Whether it is an internal or external application, metrics truly come to life when they are displayed nicely, particularly in a dashboard.
graphics you would need to implement your own charting tool, map the data or metrics into the tool, and then maintain this implementation. Overall, it was a very inefficient and cumbersome way to display data visually within your applications.
With Moesif, adding stunning visualizations to display data is easy and maintenance-free. All of the charts you find useful within Moesif can be easily exported and embedded right within your applications. There are a few ways to do this within Moesif, which include using an embedded template or public link to display a chart within your application.
Let’s explore the benefits of using embedded templates, how they work, and some real-world examples of Moesif users leveraging this data visualization feature.
Why use an embedded template?
There are many applications that can benefit from having a visualization of key metrics. A few examples may be to show:
- A historical view of application traffic
- New user sign-ups
- Errors being experienced within your application
- Display live events in real time
Not all users will have access to the Moesif platform at your organization but it doesn’t mean that they should not have access to certain key charts. Embedded templates are a great way to show users relevant data, allow them to customize their experience and visualizations, even giving the option to share with users who don’t have direct access to Moesif.
Embedded templates enable users to add dynamic charts to their application without the need to actually code them. This approach saves time, support, and effort while still giving all the benefits of a custom solution to display relevant data in applications and in-app charts.
What types of data and charts can be displayed?
Depending on what data you need to display, there are 2 ways you could do this in Moesif. You could utilize either a public link or embedded template to display the data.
A public link is a static view of your data in Moesif. You set the filter criteria in Moesif and essentially export the corresponding chart. There is no way for viewers to change the criteria or dynamically add a variable to the output of the chart. This is the best way to show users, authenticated and unauthenticated, a specific static dataset.
An embedded template is similar to a public link but allows for dynamic parameters to be used to retrieve and display data. Filtering by a specific user ID, date range, or other criteria which are dynamically supplied to the chart rendering. This approach is more feasible for an authenticated user. Data can be filtered or customized depending on what parameters are sent to the query and a corresponding chart can be rendered for ease of gleaning insight.
In this post, we will only focus on embedded templates. For more info on public links, check out our docs.
How does it work?
Getting an embedded template to work in your application is very simple. It does require that you have access to Moesif, have an API server, and have the ability to add an iframe element to your frontend code.
Let’s break down each step a bit further:
Create your chart and/or filter
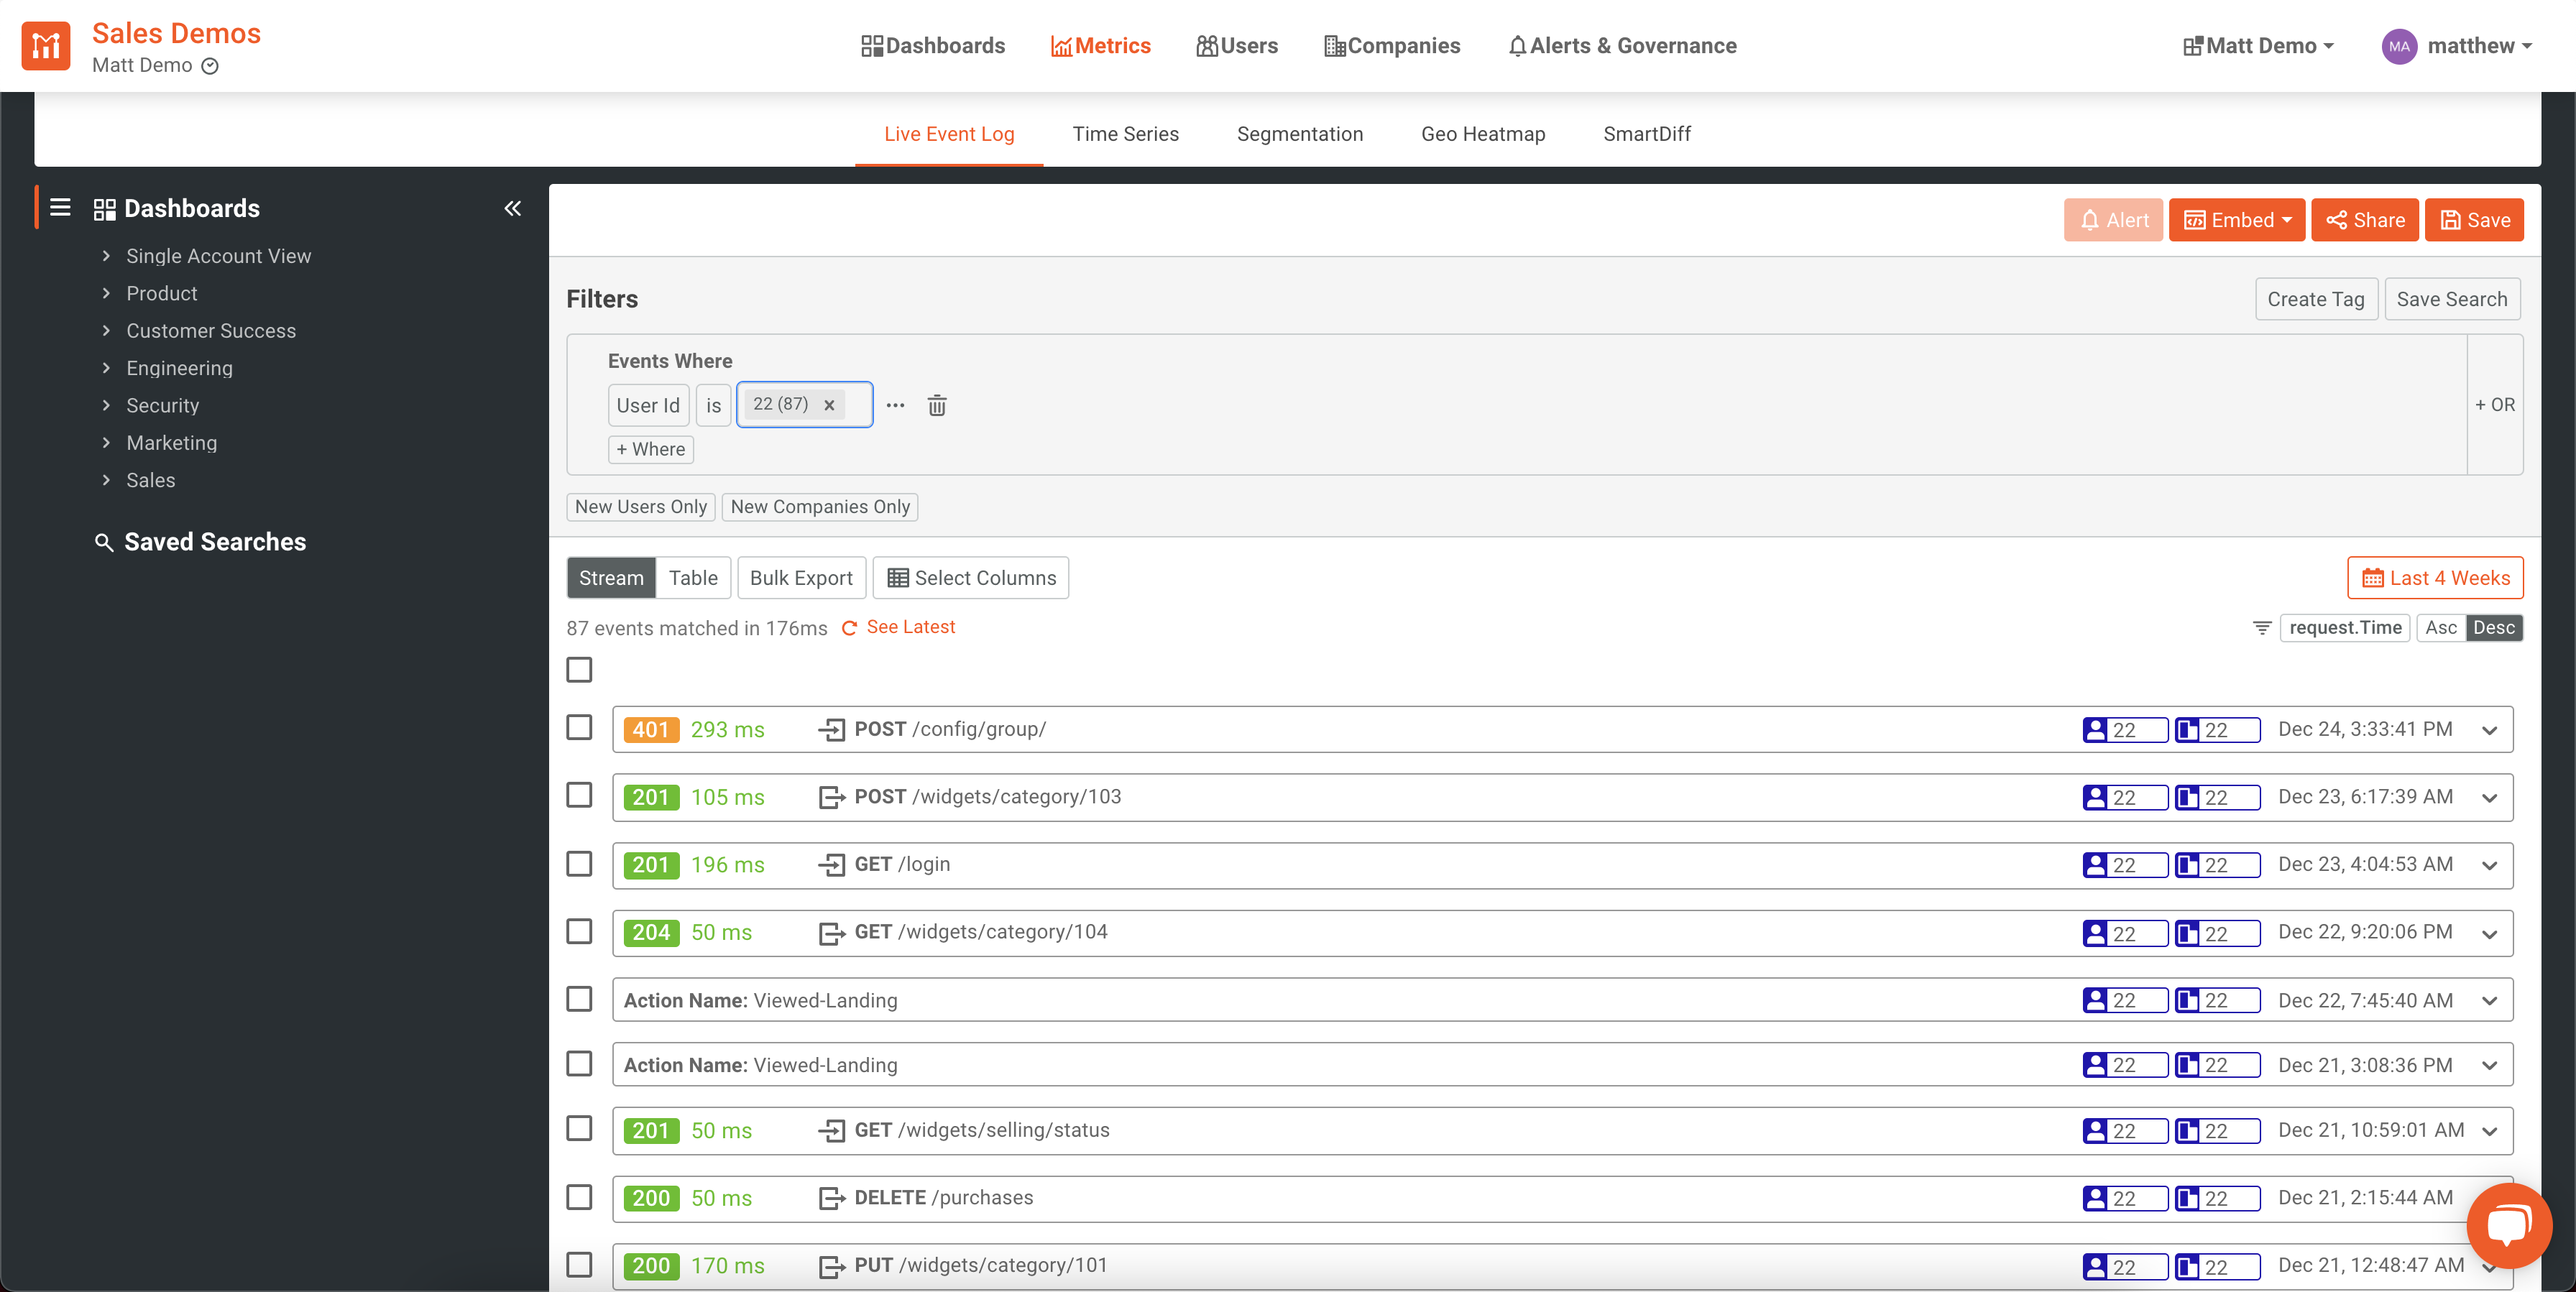
The first step is to actually render a chart in Moesif. For this, you can head over to the Metrics screen, add your filters, and then see the visualization appear on the screen. In this example I am showing all the events for a specific user ID in a Live Event Log.
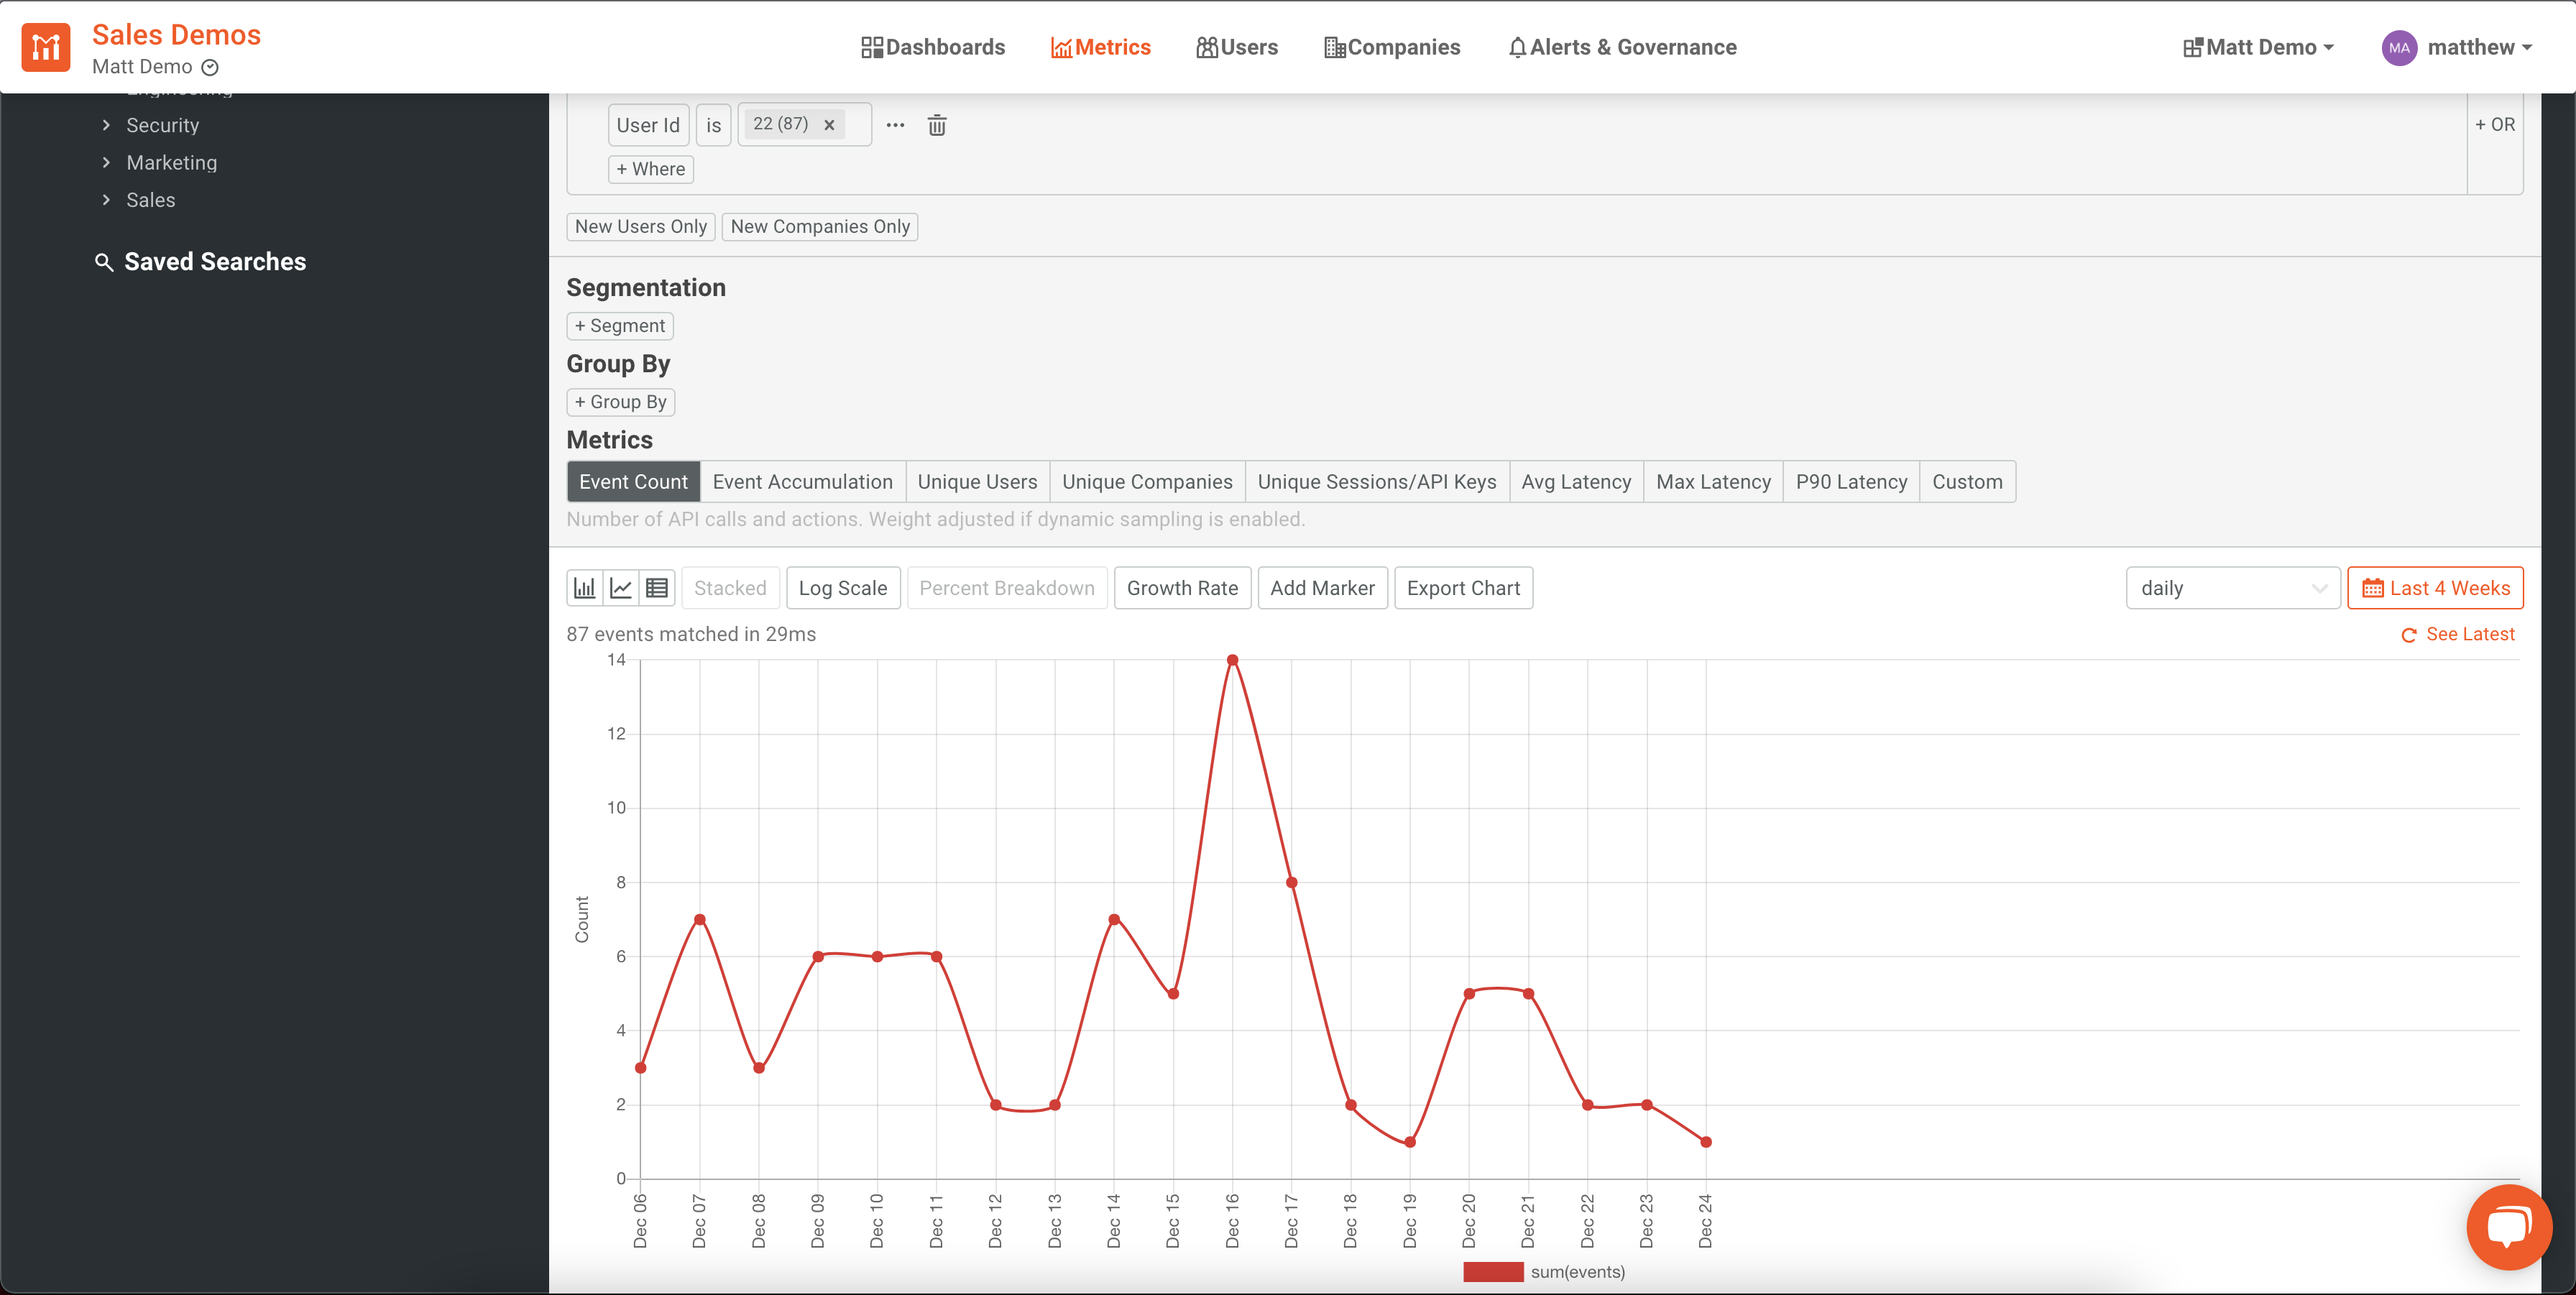
You may also view this same data in a time series chart so I can more easily see the trends over time.
At this point, you’ve established your filter, rendered a chart in Moesif, and can proceed to actually generating your embedded template.
Create template
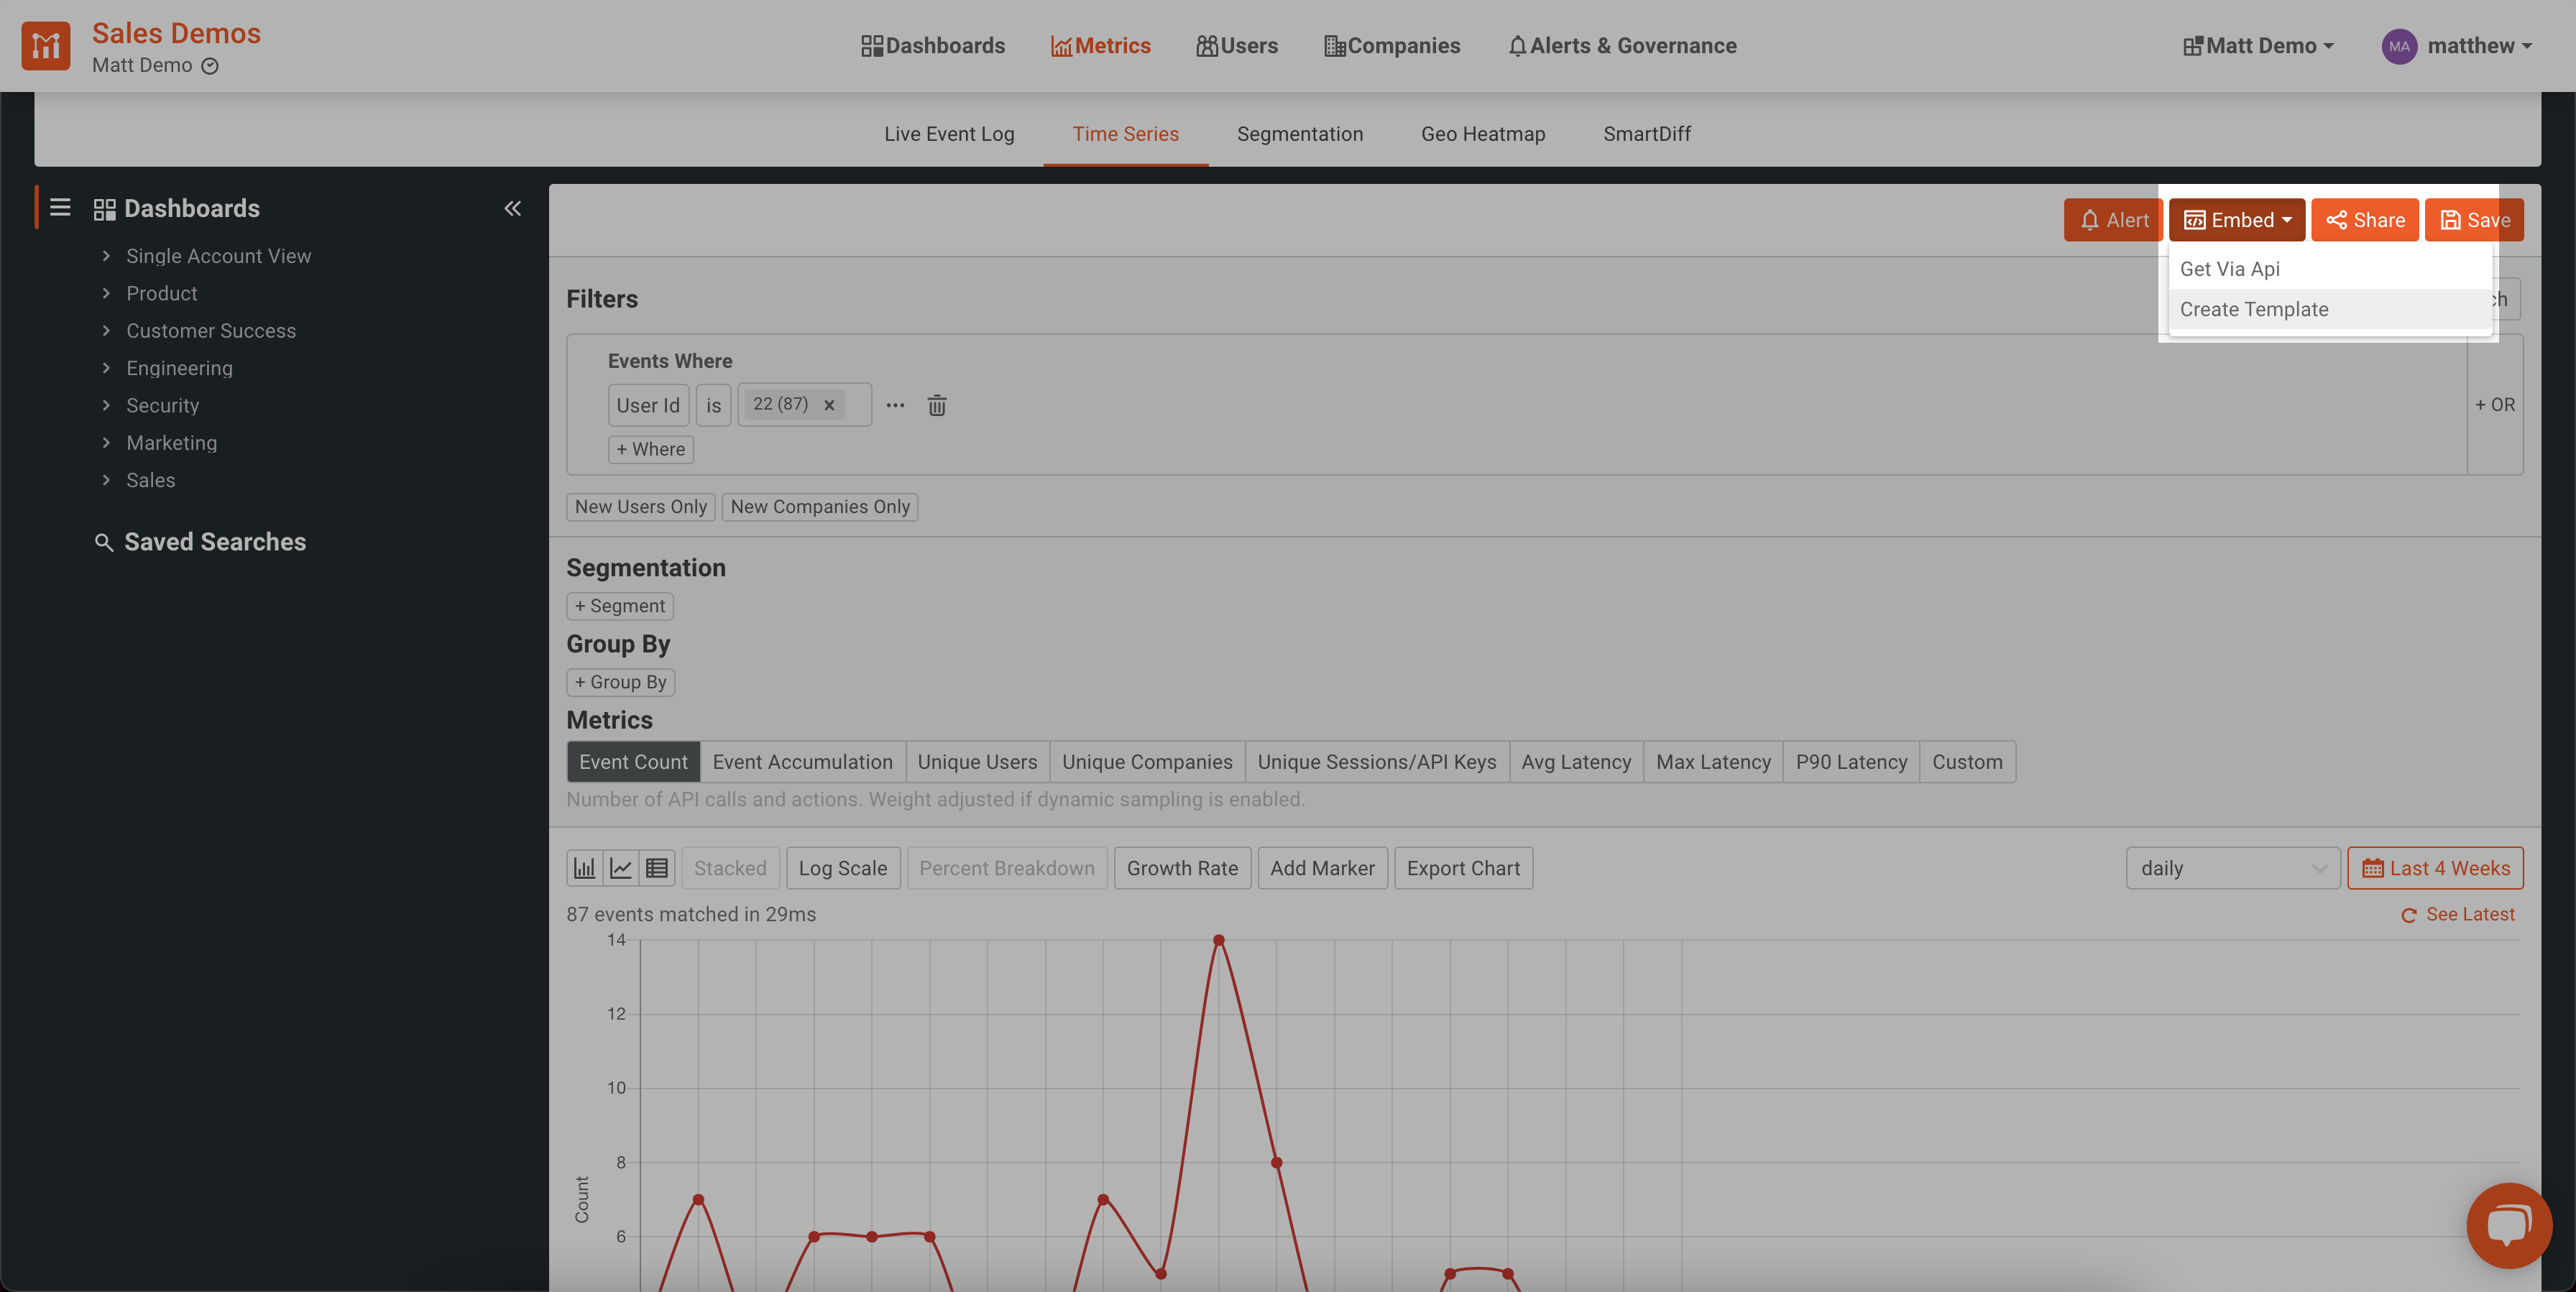
Creating the template to render in your UI takes only a few clicks. In the Metrics screen, you can click “Embed” and in the dropdown click “Create Template”.
The next screen will ask for some dimensions including a Workspace Name (essentially your template name), your share type (public link, embedded template, etc), and an area to select which fields you’d like to dynamically supply to the template.
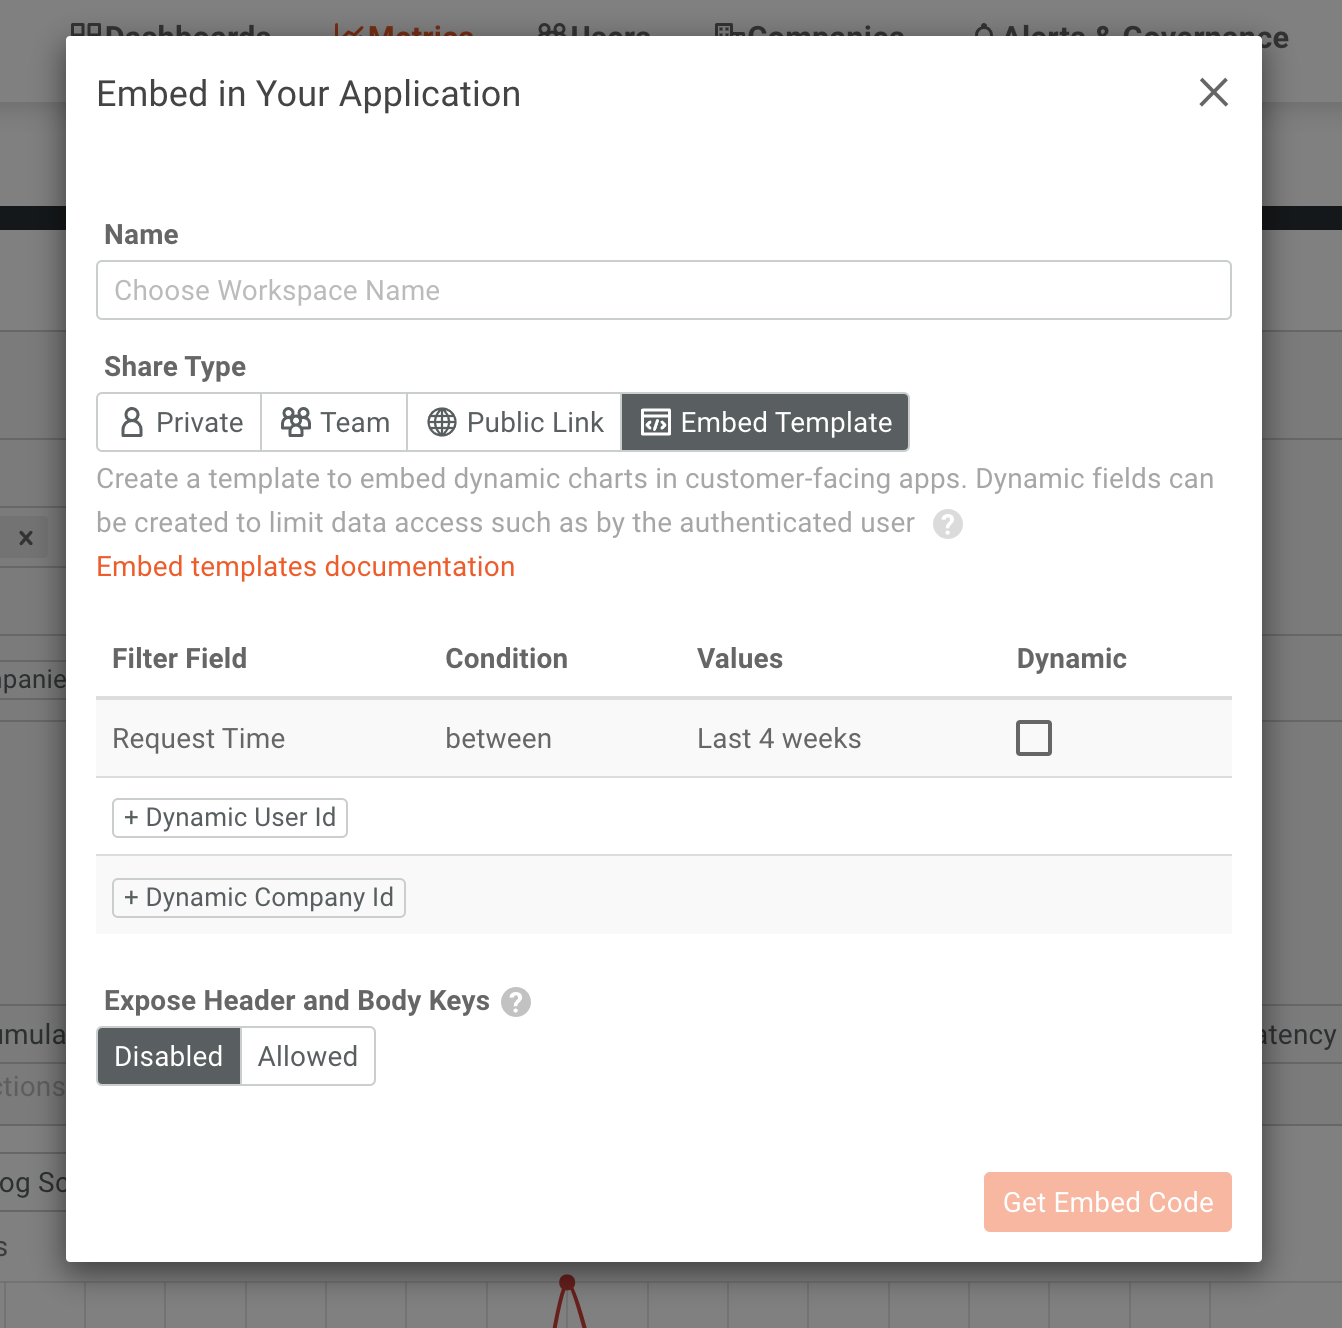
Once you do this, the template is created and you will see some instructions about how to add the chart into your UI. With a large amount of customizability, Moesif allows you to share data and tables with your team in a meaningful way.
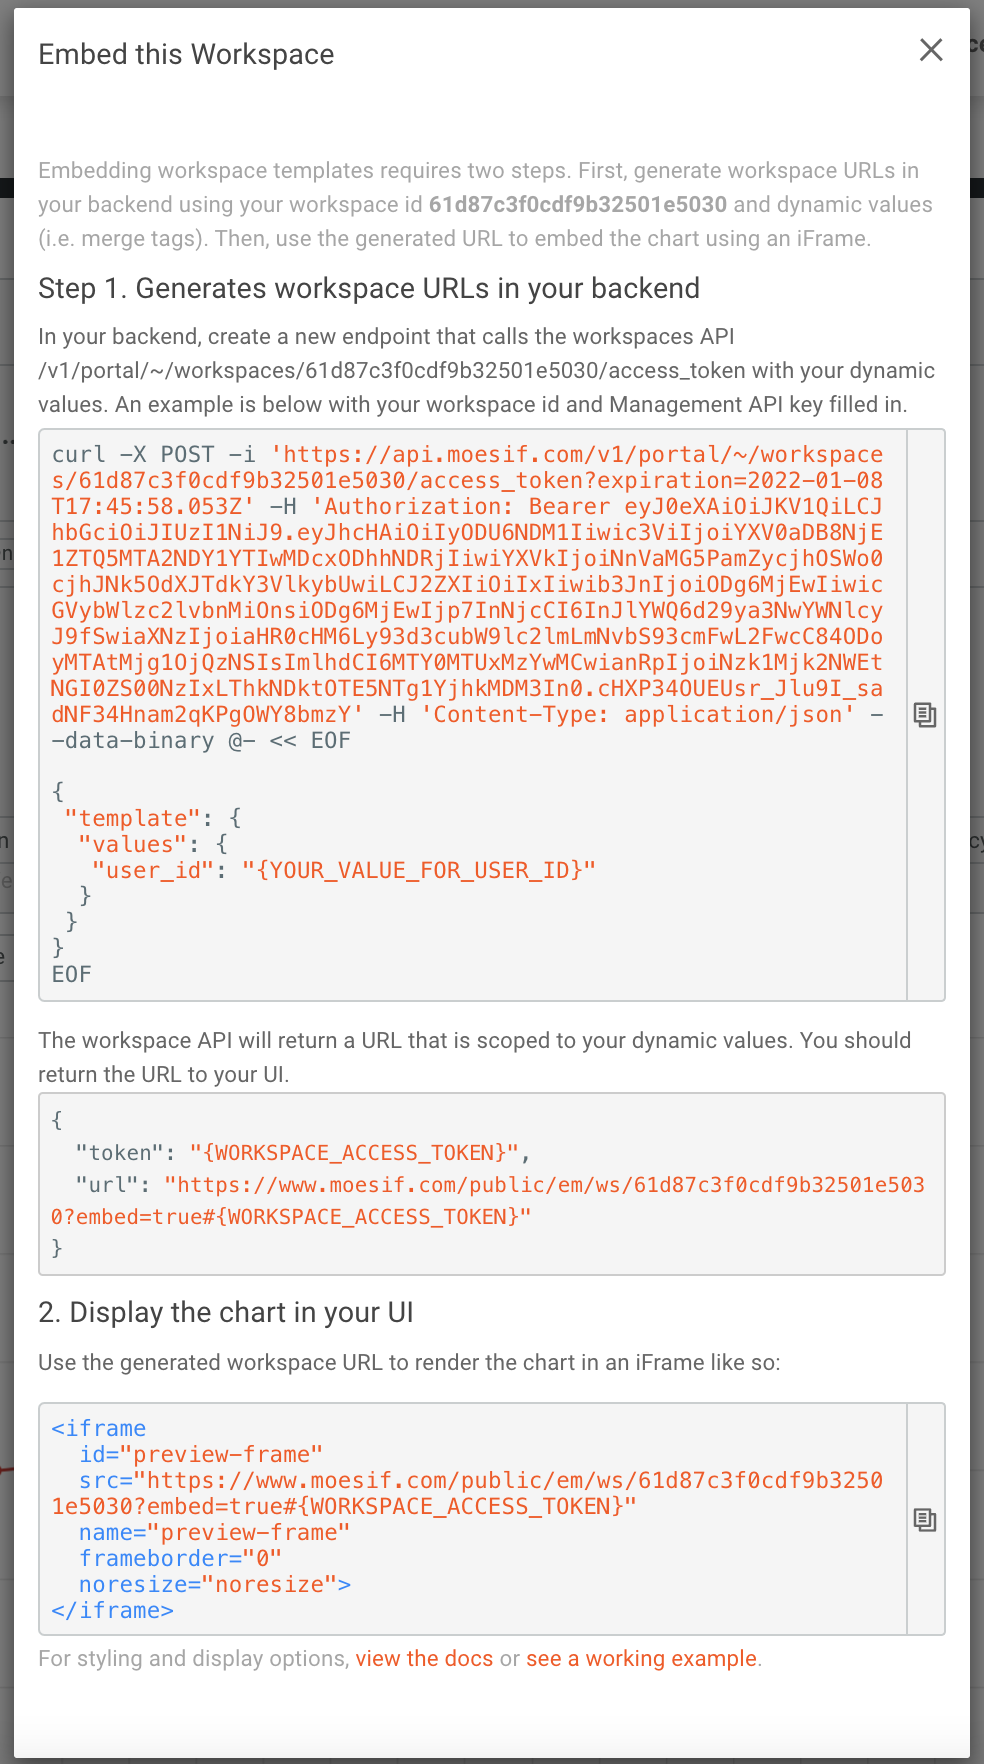
Add an endpoint to API server
Once your template has been created in Moesif, you should create an endpoint on your API server that will fetch the data and return it to your UI. The data returned will contain everything that you need to actually render the chart in the iframe you will embed in your frontend code.
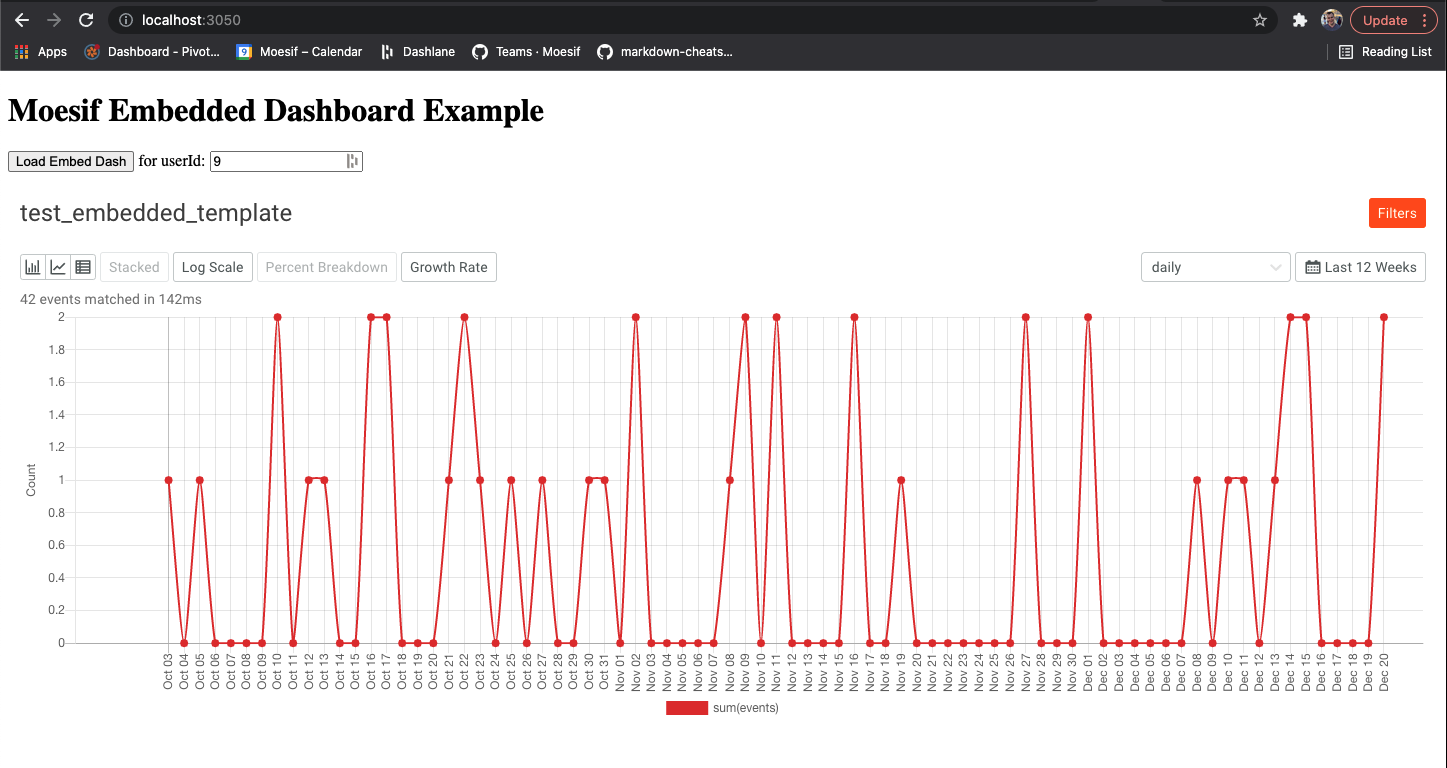
Embed the iframe in the UI
Lastly, you’ll need to add an iframe element to your UI code. Your code will call your new API endpoint and return this data to iframe to be rendered. Once the data for the chart is returned from Moesif (through your API), you’ll have a nice rendering of the chart in your UI.
If you want to see a more detailed walkthrough of these steps, check out our guide on embedded templates.
A real-world example
Many Moesif customers rely on embedded templates to give them a simple way to display important metrics to their users and decision makers for purchasing decisions. This saves them time and makes rendering real-time charts in their applications simple and easy to maintain.
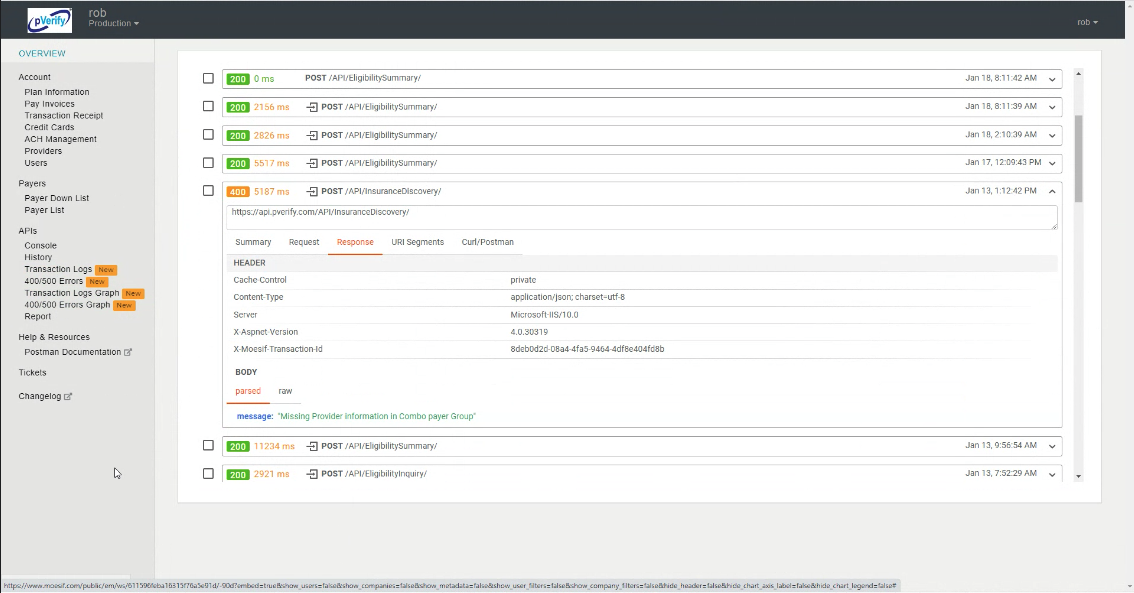
pVerify, a real time insurance eligibility verification software, uses embedded templates to help customers to see API activity and trends. Instead of creating their own charts and analytics solution, they decided to use Moesif to easily display the required info to their users.
pVerify also leverages encryption available within Moesif to make sure that while using embedded templates they are still HIPAA compliant. This was an important part of the solution since pVerify works with highly-confidential health care records.
pVerify has a few examples of how they are using embedded templates to help customers monitor and observe their API usage. This includes using Moesif’s Live Event Log display.
They also use time-series charts to give a better visual representation of trends.
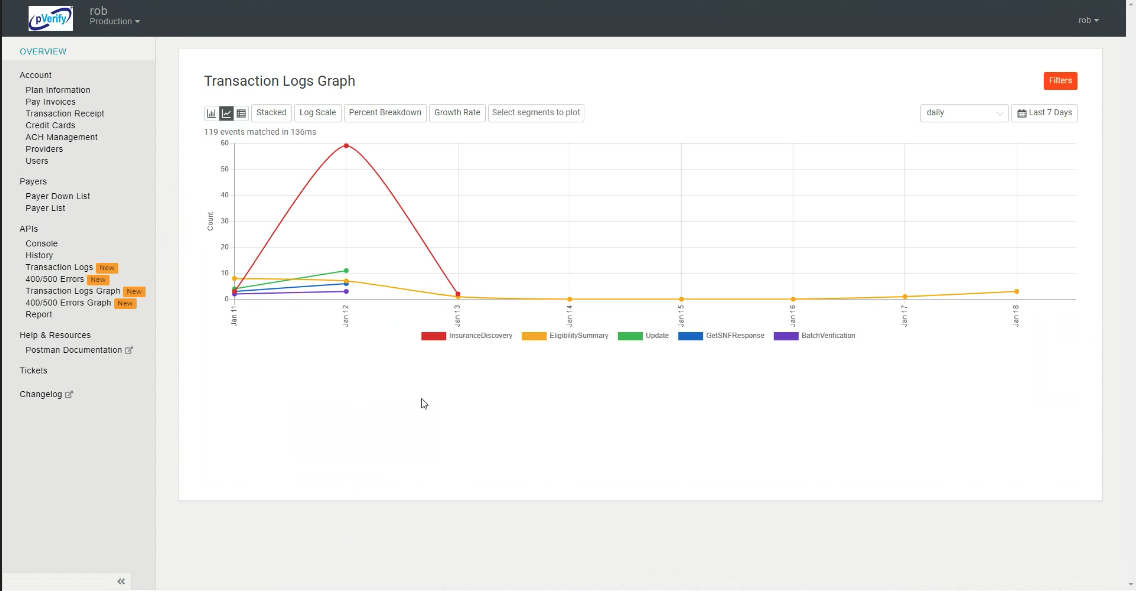
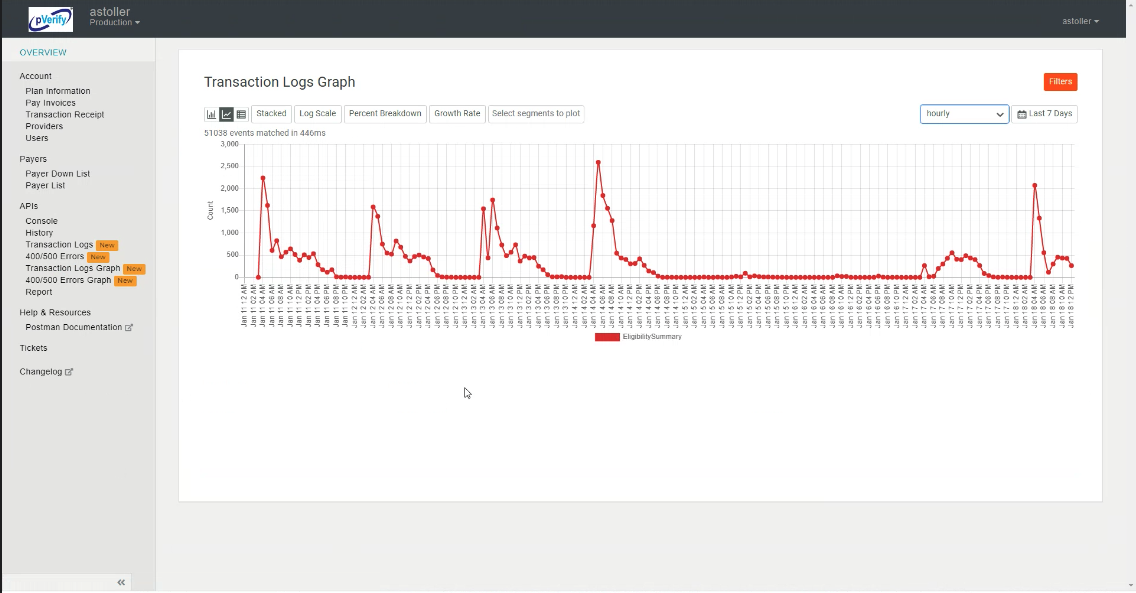
By allowing users to filter and view data in different ways, users can easily view trends and also dive into individual calls to explore in more detail.
Using embedded templates has allowed pVerify to easily add charts into their application with minimal development. Allowing their users to securely dive into API analytics, all enabled by Moesif.
Try it out for yourself!
If you’re already using Moesif, getting started is extremely simple. Embedded templates are available to all Moesif users and easily added into your existing applications. For new users, simply sign up for an account, integrate your APIs, and begin using embedded templates to display your favorite charts in your application.

Related Articles

API Strategy
Leveraging AI For a Better API Strategy
Learn how to leverage AI to build and fortify your API strategy. Improve design, governance, documentation, and align APIs with business outcomes.
API Strategy
The 5 Best Mixpanel Alternatives of 2025
Learn about the best Mixpanel alternatives to determine the right analytics solution for your use case.

API Development
How to Leverage Moesif Effectively for API Observability
Effectively leverage Moesif for API observability through best practices for integration, event enrichment, custom actions, and engineering workflow integrat...
API Strategy
How to Build an Internal Chargeback Model for Your API and AI Usage Using Moesif
Use Moesif to implement internal chargebacks and enable precise API and AI cost attribution for better transparency and resource optimization.