Comparison of Open Source API Analytics and Monitoring Tools
For any API-first company, implementing the right API analytics platform is critical for tracking the utilization of your APIs and to discover any performance or functional issues that may be impacting customers. Developing the right API endpoints to meet customer needs and monitoring these endpoints, along with focusing on the API business logic, is crucial for performance optimization. There are a variety of open-source projects you can leverage to build a complete API analytics platform. API analytics can visualize data with graphs and charts for better understanding, making it easier to identify trends and areas for improvement.
Analytics can improve API efficiency and help businesses make informed decisions related to their API programs. Before jumping into building an API analytics solution yourself, you should first list out your requirements and use cases. Not all tools support all use cases directly, and may require heavy investment in development and integration. Analytics dashboards and reporting tools help in visualizing API performance, enabling teams to monitor and analyze data effectively.
Introduction to API Performance Monitoring
API performance monitoring is a critical aspect of ensuring the success of applications and services that rely on APIs. As software design has evolved from monolithic systems to distributed software components, the need for effective API performance monitoring has become more pronounced. In a microservices architecture, hundreds of services perform discrete functions and communicate with each other using APIs. This complexity makes it essential for DevOps teams to proactively address concerns, identify root causes, and ensure third-party API providers adhere to expected service level objectives.
Effective API performance monitoring allows teams to track the health and performance of their APIs in real-time. By doing so, they can quickly identify and resolve issues before they impact end-users. This proactive approach not only helps maintain a seamless user experience but also ensures that the APIs meet the required performance standards. In today’s fast-paced digital landscape, where flexibility, scalability, and modularity are paramount, robust API performance monitoring is indispensable.
What is API Performance Monitoring?
API performance monitoring is the process of tracking and analyzing the performance of APIs to ensure they are functioning correctly and efficiently. This involves collecting and scrutinizing data on key API metrics such as response time, latency, throughput, error rates, and availability. By doing so, organizations can identify performance bottlenecks and areas for improvement. Effective API performance monitoring is crucial for the success of applications and services that rely on APIs, as it helps detect and resolve issues before they impact users. This proactive approach ensures that APIs meet performance standards and provide a seamless user experience, which is essential in today’s fast-paced digital landscape.
Importance of API Performance Monitoring for App Developers
For app developers, API performance monitoring is indispensable. It ensures that APIs are performing optimally, thereby providing a superior user experience. By continuously monitoring API performance, developers can quickly identify and address issues such as slow response times, errors, and downtime. This not only improves the overall quality of the app but also boosts user satisfaction. Moreover, API performance monitoring enables developers to optimize their APIs for better performance, scalability, and reliability. In a competitive market, maintaining high API performance is key to retaining users and ensuring the success of the application.
Infrastructure and DevOps
Infrastructure and DevOps teams play a critical role in API performance monitoring. These teams are responsible for ensuring that servers are running smoothly, resources are allocated correctly, and API performance metrics are monitored to identify potential issues. By leveraging API monitoring tools and best practices, infrastructure and DevOps teams can ensure their APIs are performing optimally and meeting service level objectives.
API metrics provide valuable insights that inform decisions related to resource allocation, system design, and operational priorities. By prioritizing API performance monitoring, infrastructure and DevOps teams can ensure a seamless user experience and drive business success. Unique API consumers measure the number of distinct users interacting with the API, offering a clear view of user engagement and adoption.
Robust API performance monitoring is essential for the success of modern applications and services. By understanding key metrics, leveraging the right tools, and following best practices, organizations can ensure their APIs perform optimally, meet service level objectives, and provide a seamless user experience.
API Metrics and Monitoring
Understanding the performance and behavior of APIs hinges on tracking key API metrics. These metrics provide a baseline for performance and inform decisions related to resource allocation, system design, and operational priorities. Key metrics for API performance monitoring include response time, latency, throughput, error rates, and availability. Error rates indicate the percentage of API calls that result in errors or failures, serving as a critical indicator of system health.
-
Response Time: Measures how long it takes for an API to respond to a request. Lower response times are crucial for a smooth user experience.
-
Latency: Refers to the delay before a transfer of data begins following an instruction for its transfer. Minimizing latency is essential for real-time applications.
-
Throughput: Indicates the number of API calls processed within a given time frame. Higher throughput signifies better performance.
-
Error Rates: Tracks the frequency of errors in API calls. High error rates can indicate underlying issues that need immediate attention.
-
Availability: Measures the uptime of the API. High availability is critical for ensuring that the API is accessible when needed.
-
Requests per Minute (RPM): Measures the number of requests the API handles every minute, providing insights into the API’s load and usage patterns.
API monitoring tools typically use logging and alerting mechanisms to help meet service level objectives. By tracking these metrics, organizations can identify performance bottlenecks, detect security threats, and ensure a seamless user experience. Monitoring these key metrics allows teams to make informed decisions and maintain the health and performance of their APIs.
API Performance Metrics
API performance metrics are essential for measuring the efficiency and effectiveness of APIs. These metrics help identify areas for improvement and ensure that APIs are meeting performance standards. Some common API performance metrics include:
-
Response Time: The time it takes for an API to respond to a request. Lower response times are crucial for a smooth user experience.
-
Latency: The delay before a transfer of data begins following an instruction for its transfer. Minimizing latency is essential for real-time applications.
-
Throughput: The number of requests that an API can handle per unit of time. Higher throughput signifies better performance.
-
Error Rates: The number of errors that occur per unit of time. High error rates can indicate underlying issues that need immediate attention.
-
Availability: The percentage of time that an API is available and functioning correctly. High availability is critical for ensuring that the API is accessible when needed.
API Usage Metrics
API usage metrics provide insights into how APIs are being utilized, helping to identify trends and patterns in API usage. These metrics are crucial for understanding the growth and adoption of APIs. Some common API usage metrics include:
-
API Usage Growth: The rate at which API usage is increasing or decreasing. This metric helps in understanding the adoption and popularity of the API.
-
API Traffic: The number of requests being made to an API. Monitoring API traffic helps in understanding the load and demand on the API.
-
Resource Utilization: The amount of resources such as CPU, memory, and bandwidth being used by an API. Efficient resource utilization is key to maintaining optimal performance.
-
API Endpoints: The number of endpoints being used by an API. This metric helps in understanding the complexity and scope of the API.
-
API Calls: The number of calls being made to an API. Monitoring API calls helps in understanding the usage patterns and identifying potential issues.
API Monitoring Tools
API monitoring tools are designed to help organizations track and analyze API performance metrics, providing real-time insights into API behavior. These tools can enable teams like DevOps to quickly identify and resolve issues, ensuring that APIs perform optimally and meet service level objectives. The ideal API monitoring tool provides real-time insights into API response times, error rates, throughput, and dependencies, ensuring comprehensive performance tracking.
-
Datadog: Offers end-to-end transaction monitoring, distributed tracing, and machine learning-based alerting. It provides comprehensive insights into API performance and helps teams quickly identify and resolve issues.
-
New Relic: Known for its robust monitoring capabilities, New Relic offers detailed performance metrics, real-time alerts, and advanced analytics. It helps organizations ensure their APIs are performing as expected.
-
Sauce Labs: Specializes in testing and monitoring APIs, providing detailed reports on performance and reliability. It helps teams identify potential issues and optimize API performance.
By leveraging these tools, organizations can gain a deeper understanding of their API performance, quickly address any issues, and ensure their APIs meet the required performance standards.
Open Source vs. Commercial API Monitoring Tools
When it comes to API monitoring tools, organizations have the option to choose between open source and commercial solutions. Open source tools like Prometheus and Grafana are popular due to their flexibility and cost-effectiveness. They can be customized to meet specific needs but may require more technical expertise to set up and maintain. On the other hand, commercial tools such as Datadog and New Relic offer advanced features, comprehensive support, and ease of use, albeit at a higher cost. The choice between open source and commercial API monitoring tools depends on the specific needs, resources, and technical capabilities of the organization. Both options have their own advantages and can be effective in ensuring optimal API performance.
By integrating these new sections, the article now provides a comprehensive overview of API performance monitoring, covering its importance, key metrics, and the tools available for effective monitoring. This ensures that readers have a thorough understanding of how to monitor and optimize their APIs for better performance and user satisfaction.
Need to answer engineering or business questions about API usage growth
Engineers commonly turn to API logs and metrics to understand what’s happening over their APIs, inspect payloads, and root cause issues with their services that come up. Real-time API logging capabilities is a must for engineers that want to depend on their API analytics solution to put out the (hopefully far and few between) fires due to an API outage or reliability issue. Because real-time logging can raise the compute and storage cost, not all analytics infrastructure maintains a real-time pipeline. On the flip side, only the most recent data is needed to answer hair on fire engineering problems, so data can be retired after a short time period such as after 24 hours.
Engineering and product leaders make strategic decisions based on lines, not dots. Business questions are answered from historical trends in data, which may be over months or even years. This means your API analytics build should be capable of storing data for long retention periods such as for multiple years. This also requires infrastructure that can roll up and compress your data as storing and running aggregations on raw event logs will cripple your analytics infrastructure. Measuring API usage growth over longer intervals, such as 28-day periods, is crucial to obtain a more accurate understanding of trends and avoid biases caused by fluctuations in monthly day counts.
Real-time alerting and API performance monitoring?
While building dashboards and throwing them up on a monitor can be a great way to monitor your metrics, it still requires manually checking them periodically. To become more proactive, many API analytics builds also have some sort of monitoring and alerting features. These can vary from simple threshold-based alerts that sends an email when a metric reaches a certain value, to complex monitoring rules and workflows that can perform complex aggregations in real-time and route alerts to incident response platforms like PagerDuty and BigPanda. An API monitoring tool should allow users to create alerts for critical metrics like response time and error rate, enabling timely responses to potential issues.
Some customer-facing teams like developer relations and customer success may want to build automated workflows to notify customers or internal specific internal stakeholders based on complex user behavioral flows.
Access API endpoints anywhere vs controlled access
The post-COVID world has accelerated the shift towards work from home. This means internal users of your API analytics build may need to access metrics on home networks or on the go without a VPN. Placing unnecessary security restrictions to access the API data may limit the value your API analytics provides to your company or can even backfire creating bad habits such as password sharing or exporting large amounts of data to a personal device rather than using the API analytics build the way it was designed.
On the flip side, providing self-service API analytics from anywhere also means having strong security and access control. If you think typical enterprise access control like single sign on and role-based access control may be needed in the future, you should plan your API analytics build accordingly even if not needed immediately. Ripping out and changing authentication and authorization design is not an easy task and could force a complete rewrite. You don’t want to be caught off guard and be the engineer who failed at foreshadowing typical future enhancements.
Flexibility of API metrics visualizations
While most analytics platforms can display event data or plot basic single-value metrics over time, you platform may also be used for more advanced and specialized analysis like funnel analysis or cohort retention analysis. These are common queries used by business functions like marketing and growth teams but rarely used by developers themselves. Yet, building a funnel can be quote challenging if the right data model was not used.
Many times, you don’t know the types of queries that need to be displayed but should choose a project that enables flexibility in both the data model and the visualization layer. Exporting API call log data allows for offline analysis and external use, providing additional flexibility for teams to work with the data in various contexts.
Comparison
There are a variety of open-source analytics and monitoring projects out there. Some are focused on monitoring infrastructure metrics like Kibana and Grafana. While others are more focused on web analytics like Matomo (also known as Piwik). While none of these are designed for API products, you could develop custom code to piece a few components together to build an open-source API analytics platform
Kibana
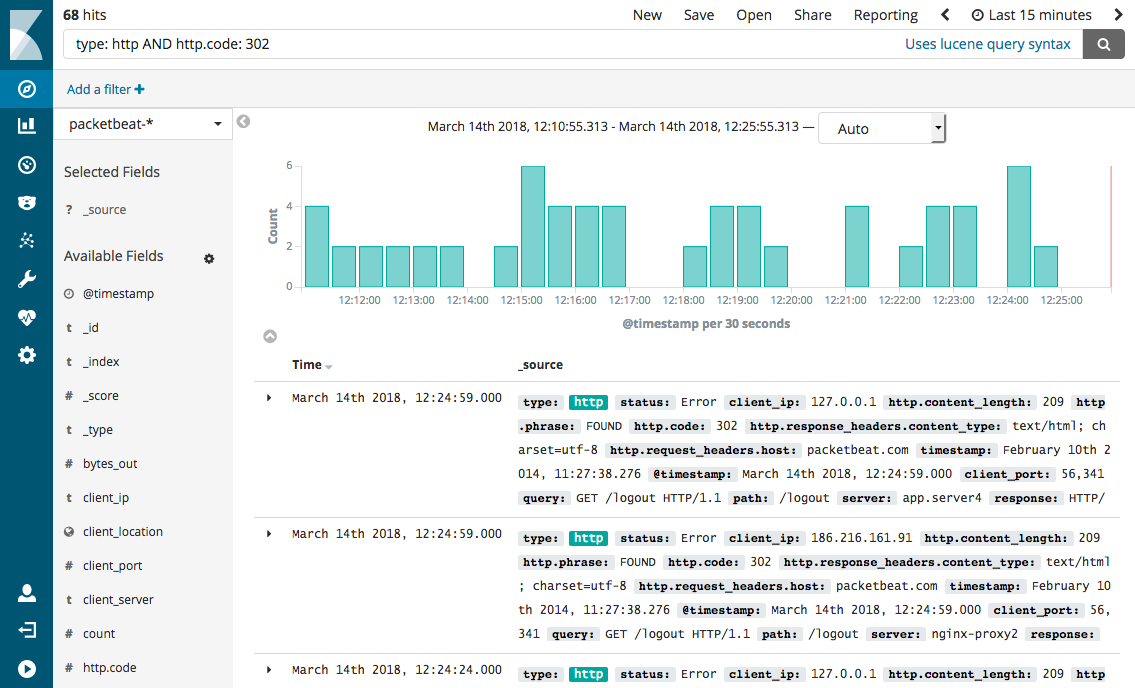
Kibana is one of the de facto open-source log visualization tools out there for engineers. It’s part of the official ELK stack (Elasticsearch Logstash Kibana) which makes it one of the quickest visualization tools to get up and running due to it’s tight integration with Elasticsearch relative to tools like Grafana which are far more complex to set up. Elasticsearch itself is well suited for high-cardinality, high-dimension log data which is a must for API logs. The downside is that Kibana is only compatible with Elasticsearch. If you want to visualize data stored in a SQL database or other data store, you’ll need to look elsewhere.
While quick to set up, Kibana is also quite limited in the types of visualizations and flexibility supported. Kibana’s primary use case is to provide log search and light analysis on raw event data rather than offering a true API monitoring tool. For debugging use cases, this may be sufficient, but popular business metrics like funnels and retention analysis cannot be performed by Kibana limiting it’s application outside of engineering teams.
Kibana and Elasticsearch is designed to be paired with a Logstash instance which enables you to design a logging pipeline to process and enrich API logs such as normalized any HTTP headers or add geo IP information to each API call. Keep in mind Logstash cannot perform aggregations across multiple events at a time. Such processing requires a separate cluster-computing framework for map-reduce operations like Spark or Hadoop.
Kibana is designed for use cases where you want to explore your data in an ad hoc fashion rather than create a daily dashboard. You’re able to leverage Elasticsearch query DSL or Lucene query syntax providing great flexibility, but these do have a steep learning curve.
By default, Kibana is purely a visualization tool which means things like alerting, anomaly detection, and authentication are separate. This means anyone with access to your Kibana endpoint can access your data so you shouldn’t have it public.
However, you can purchase and install the Elasticsearch X-Pack to gain some monitoring functionality along with access control.
Grafana
Unlike Kibana which focuses on log search, Grafana focuses on time-series based metrics. You can visualize data in a variety of databases including Elasticsearch, InfluxDb, OpenTSDB, Graphite, and Prometheus. Grafana does one thing, and one thing really well, which is visualizing time series metrics stored in a database with beautiful dashboards. This does leave everything else up to you including configuring your data source and processing your data into a time series metric that can be displayed by Grafana.
Compared to Kibana, Grafana only works on time-series data already stored in a database and does not have any real-time log search nor a way to browse or explore your raw data in an ad hoc way. The primary use case for Grafana is to design a dashboard to monitor time-series metrics regularly such as on a TV in the office. For example, you may want to display disk utilization, system CPI, and requests per minute for your servers. Grafana has a lot of options to display your metrics in the way you want, like showing storage capacity using base 2 units and percentile based metrics.
Due to it’s time-series based architecture, Grafana’s application for high-cardinality, high-dimension analytics on API calls is limited. Instead, you need to spend time deciding exactly what specific time-series metrics you want to track ahead of time and model your data accordingly. This also limits Grafna’s use case for the self-service data exploration that business users may be looking for where you’re looking to segment with multiple group by’s or correlate multiple dimensions in your data.
Compared to Kibana, Grafana is known for built-in support for authentication and access control. You can also hook up your Grafana instance to an external Lightweight Directory Access Protocol (LDAP) server or SQL server to better control access in an enterprise setting.
You can also connect Grafana to an incident response platform like PagerDuty to create and trigger alerts from your Grafana instance. Keep in mind these alerts are limited to the same time series metrics you are already monitoring in Grafana.
Grafana does have a separate product called Loiki, which provides some of the log exploration features that Kibana has.

Jaeger
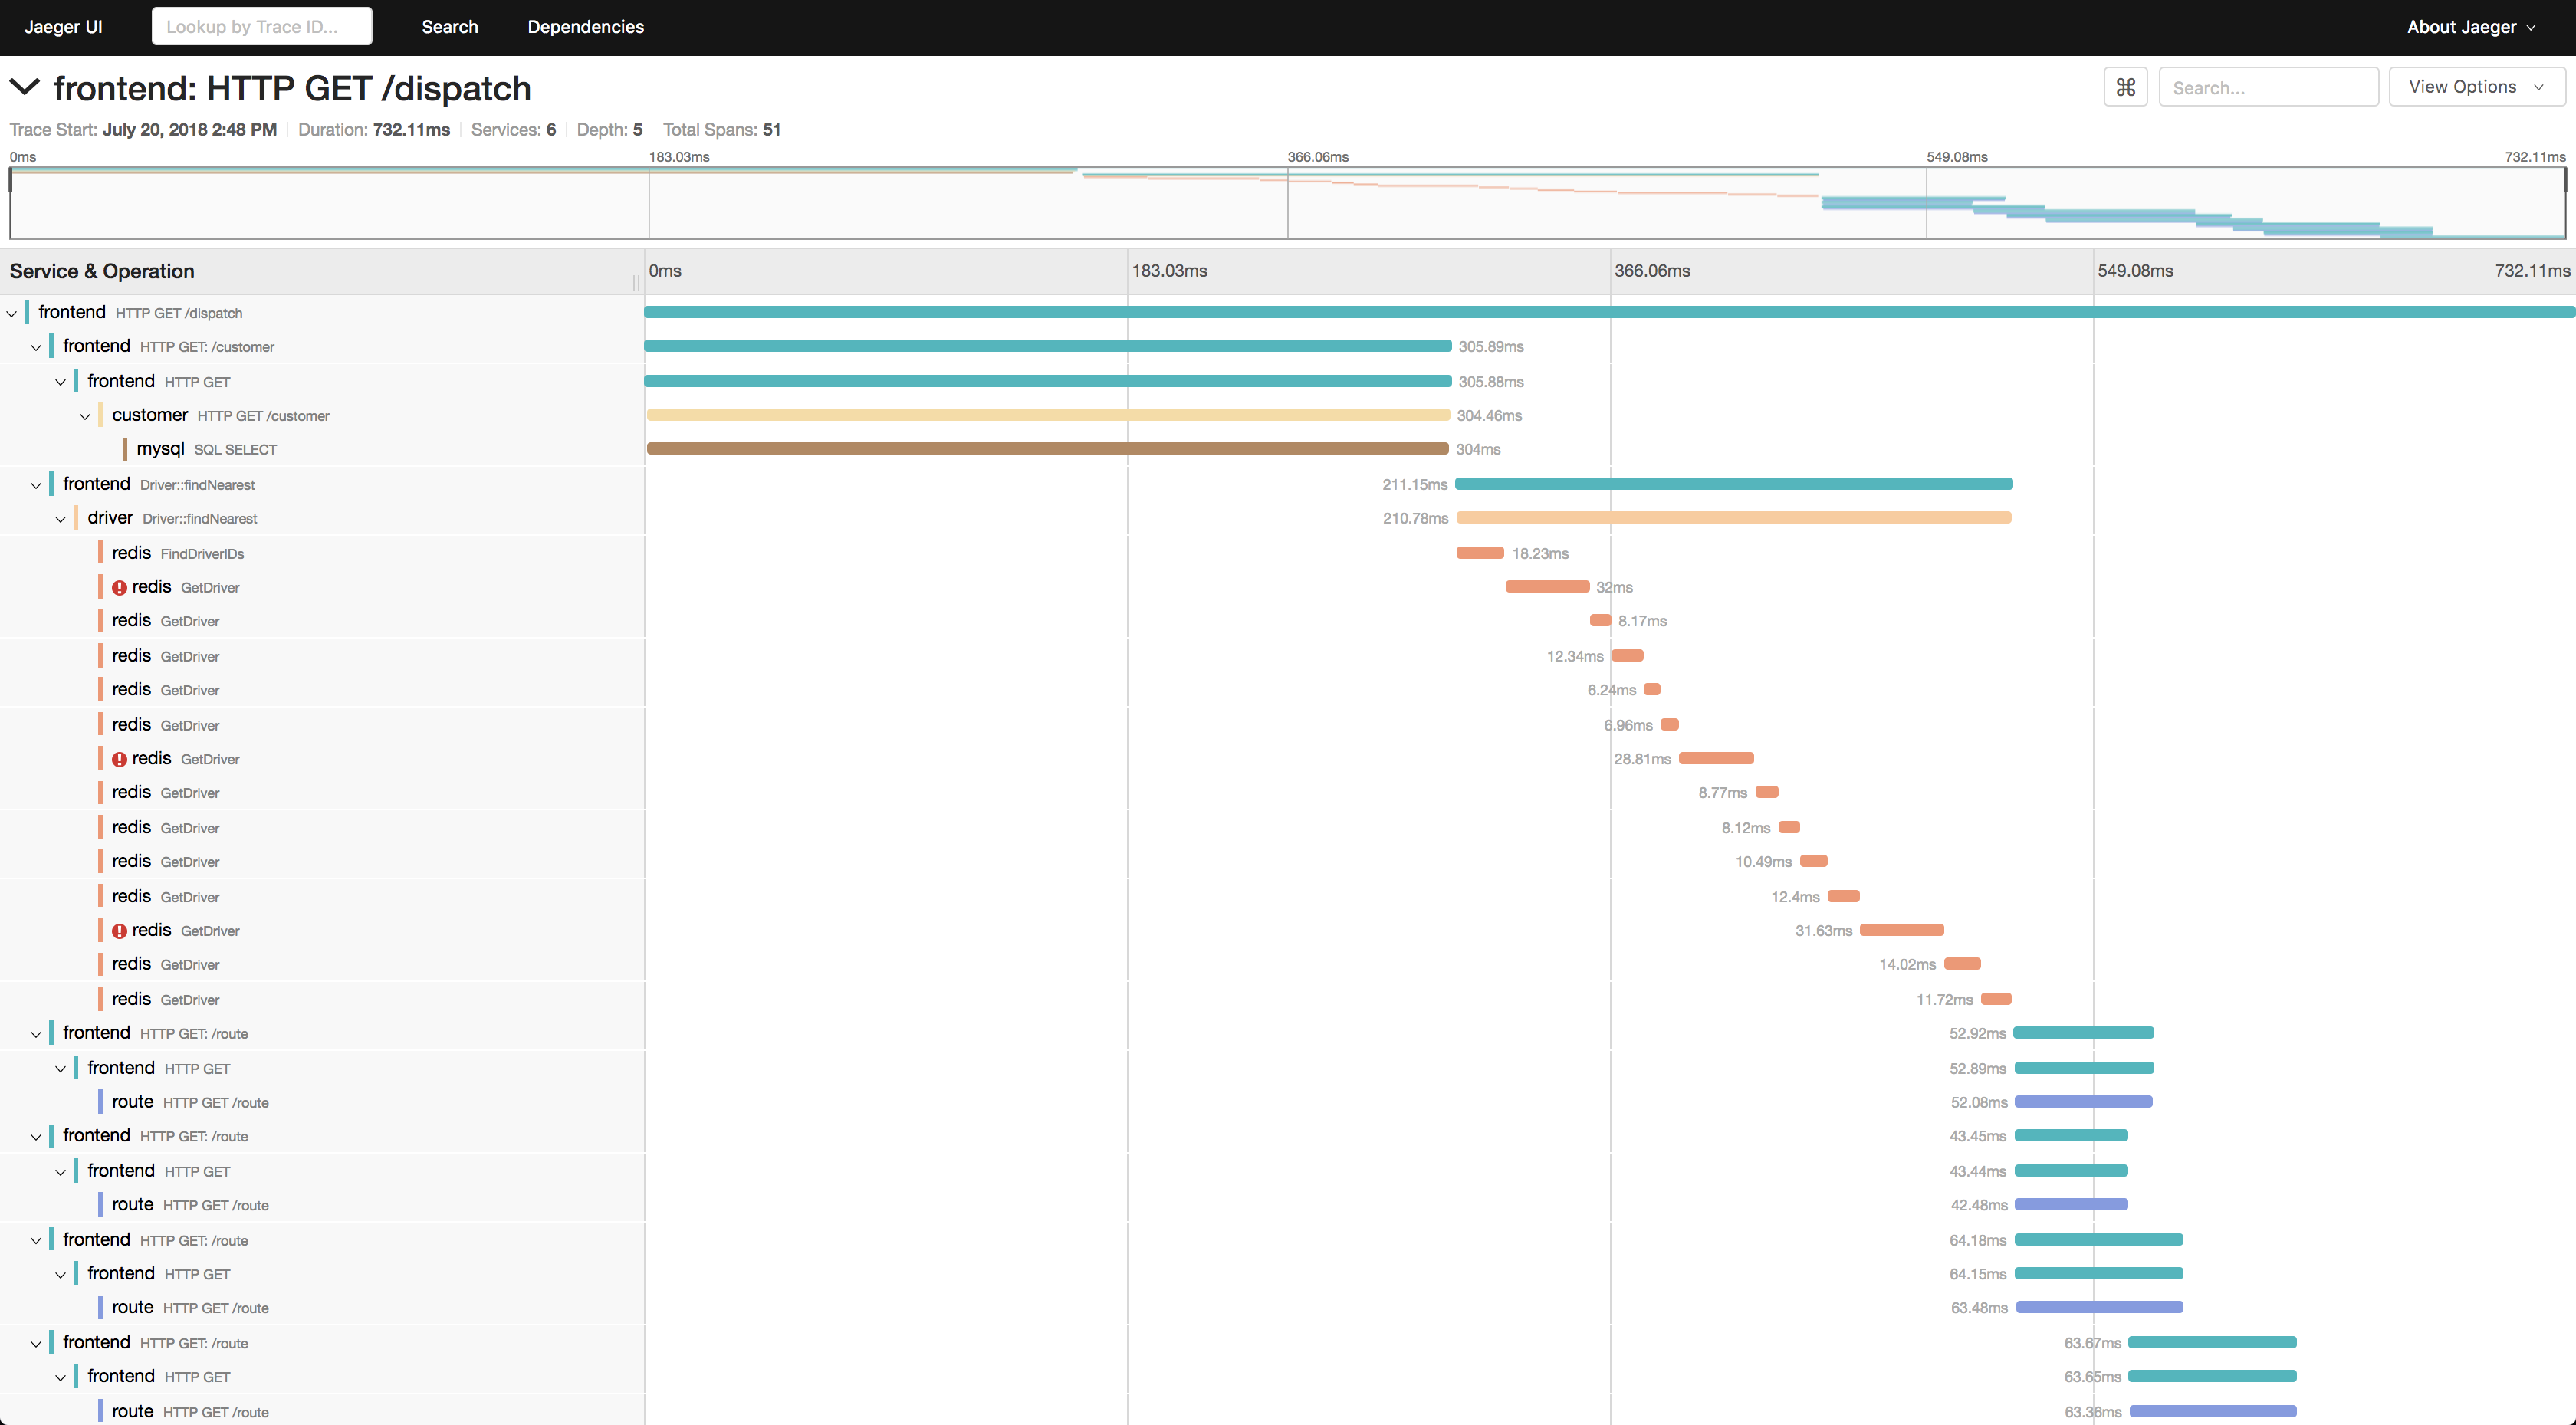
Like Grafana which specializes in time-series metrics, Jaeger does one thing and one thing well, which is visualizing distributed traces. This makes Jaeger quite a bit of a different tool than Grafana and Kibana in that each trace is created and viewed in isolation vs monitoring metrics or logs over time. A trace is a snapshot of all context and timing info as a request propagates through a service mesh or hits various services in a microservice architecture. Because trace generation is expensive, sampling is usually employed to snapshot every X requests or specific criteria.
Unlike Grafana which focuses on monitoring time-series metrics and Kibana which focuses on log search, Jaeger focuses on root causing specific issues with a service mesh or dependency issues. Jaeger supports multiple data sources like Grafana including Cassandra and Elasticsearch.
Since traces are created in isolation, the only view is a trace view as expected. There is no way to create trends over time. Jaeger also doesn’t have any alerting or monitoring features so you’ll want to still have a Grafana or similar instance handy.
Moesif
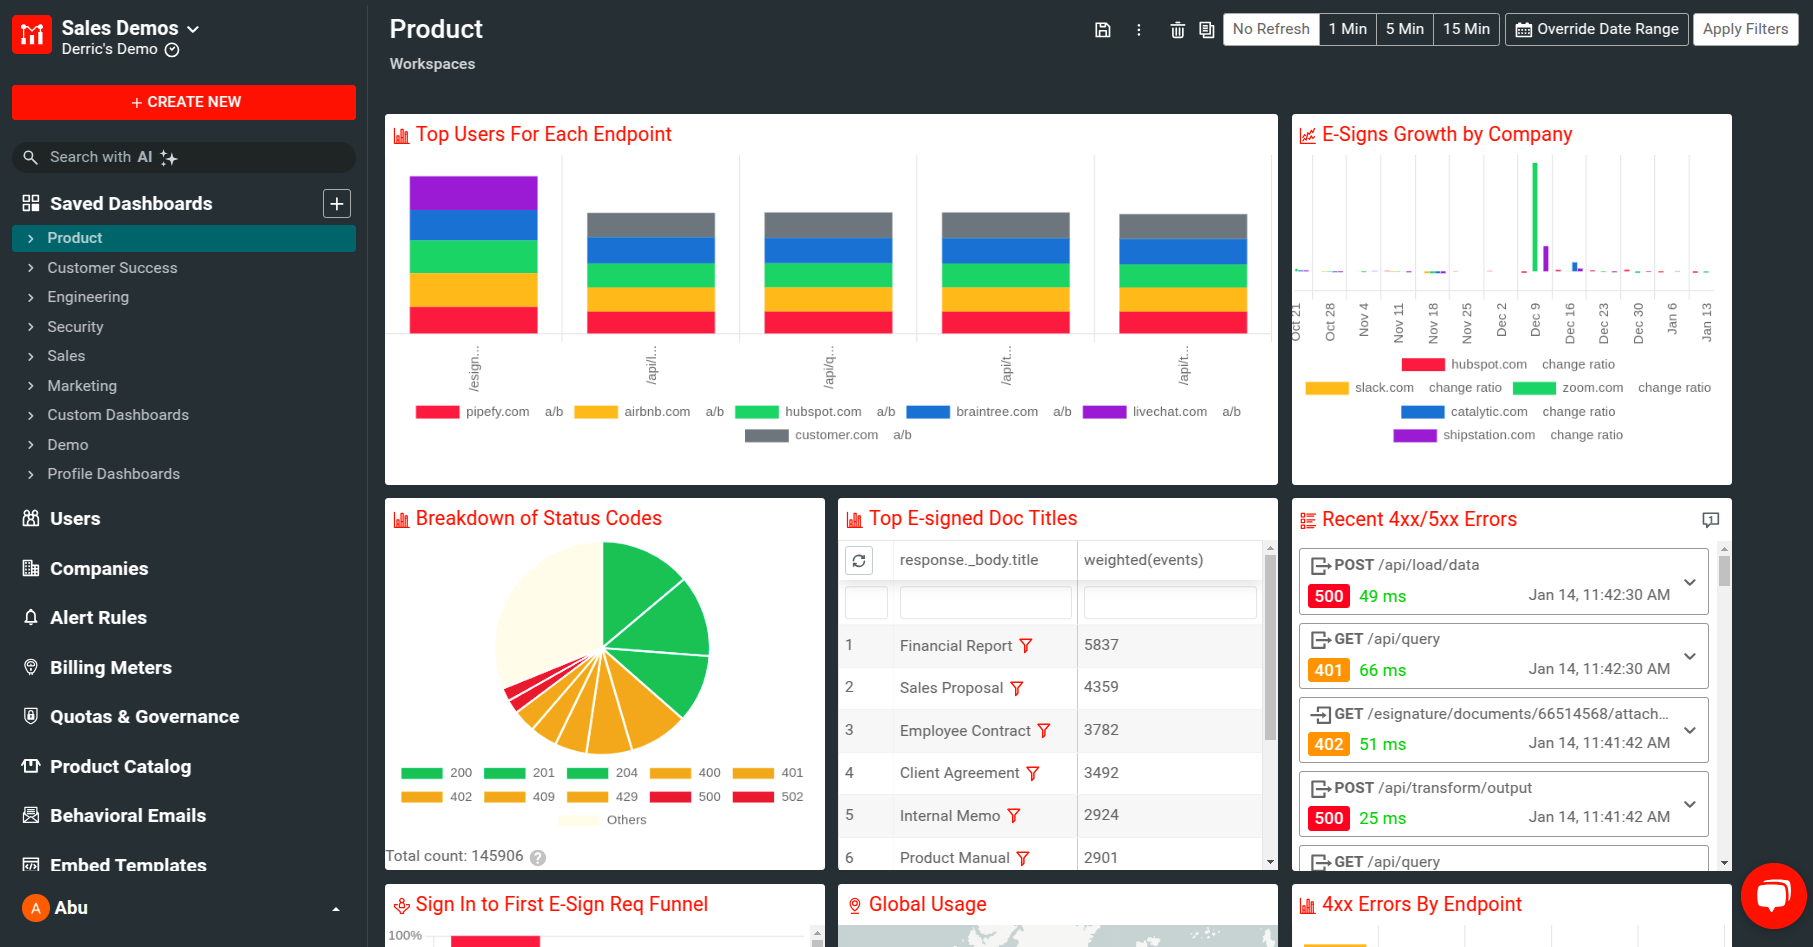
Many API teams find needing a multitude of tools for their monitoring needs. Grafana has time-series metrics whereas Kibana enables log search. A faster option is an end to end solution designed specifically for API products like Moesif. Unlike Grafana where time-series metrics need to be preplanned, Moesif is designed for ad hoc data exploration using high-cardinality, high-dimension API analytics which is a must for product and engineering leaders looking to make strategic decisions from their API usage data.
Compared to infrastructure monitoring tools like Kibana and Grafana, Moesif leverages a user-centric data model which enables you to align your API metrics to business goals by tieing API metrics to individual customers rather than tied to infrastructure. This is also known as user behavioral analytics which enables understanding complex user flows holistically across multiple user actions and API calls rather than looking at each time-series in isolation.
A classic example of user behavioral analytics is monitoring a conversion funnel and then breaking it down by user acquisition channel to decide where to invest marketing dollars or viewing user retention for different features or endpoints to make your API products more sticky. This also enables tracking higher level account health for security research and customer success.
Compared to Grafana and Kibana, Moesif also provides elaborate real-time alerting and reporting features. This enables you to see which endpoints are causing the most performance issues broken down by each customer email. With behavioral emails and workflows, you’re able to scale customer outreach and support efforts with automated emails with a set of steps.


Related Articles

API Strategy
Leveraging AI For a Better API Strategy
Learn how to leverage AI to build and fortify your API strategy. Improve design, governance, documentation, and align APIs with business outcomes.
API Strategy
The 5 Best Mixpanel Alternatives of 2025
Learn about the best Mixpanel alternatives to determine the right analytics solution for your use case.

API Development
How to Leverage Moesif Effectively for API Observability
Effectively leverage Moesif for API observability through best practices for integration, event enrichment, custom actions, and engineering workflow integrat...
API Strategy
How to Build an Internal Chargeback Model for Your API and AI Usage Using Moesif
Use Moesif to implement internal chargebacks and enable precise API and AI cost attribution for better transparency and resource optimization.