Creating Aggregate Dashboards to Monitor Your Third Party APIs
Moesif launched a free tool that can be used to monitor your 3rd party APIs. Many API providers have their own status dashboard such as status.dropbox.com or status.box.com. However, each is hosted at the individual company’s domain. Sometimes, you just want a centralized or global view of the operational status for all the services that you are dependent on, which is where this tool comes in.
Background
With the growth of APIs and SaaS, a company is able to outsource much of their non core product functionality to third parties. Everything from CI/CD to payment processing can be outsourced to third parties. However, companies are now dependent more than ever on these service’s reliability.
For example, an e-commerce mobile app can be dependent on Braintree’s uptime or Recurly’s uptime for payments, Twilio’s uptime or Mailgun’s uptime for SMS and Email, and even CircleCI’s uptime for continuous integration.
Because of these dependencies, it’s critical to know the status and availability of these services. While many of these companies host a status page for their customers, it’s not easy to unify that data into a centralized dashboard.
This is why we created a free tool that can monitor multiple APIs and services in one single dashboard.
Main Dashboard
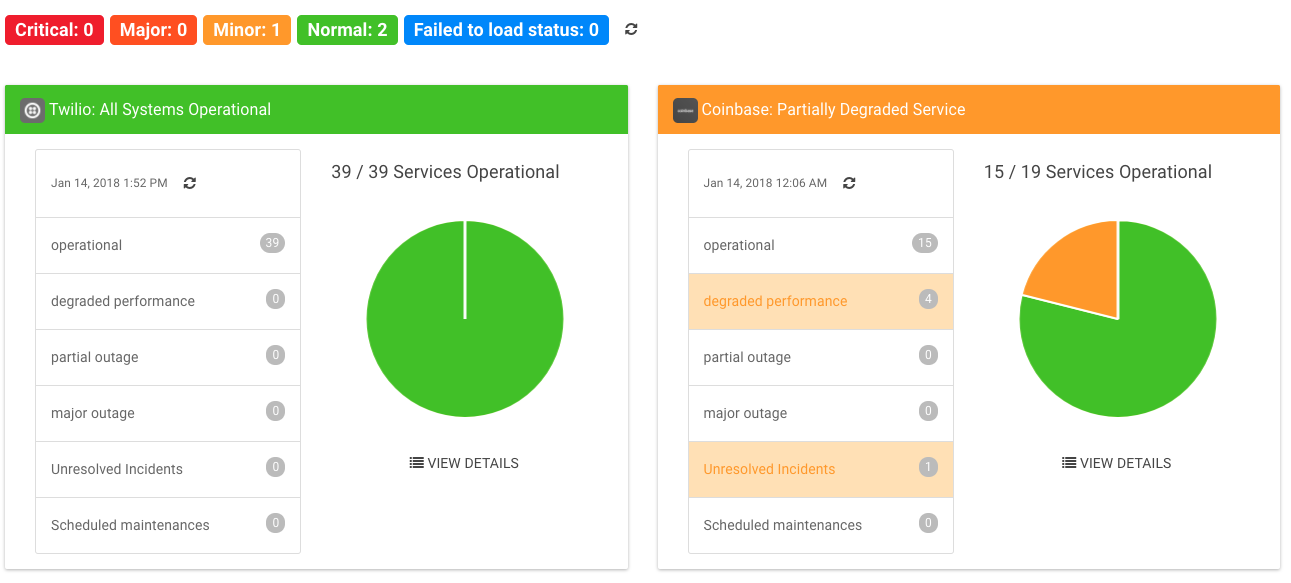
The main dashboard gives you a high level view of all the APIs and services that you chose for monitoring. Services and APIs are organized by five major status codes: operational, minor, major, critical, maintenance.
For each service, there is a status summary for the components of each service along with a highlight of unresolved incidents and any in-progress maintenance.
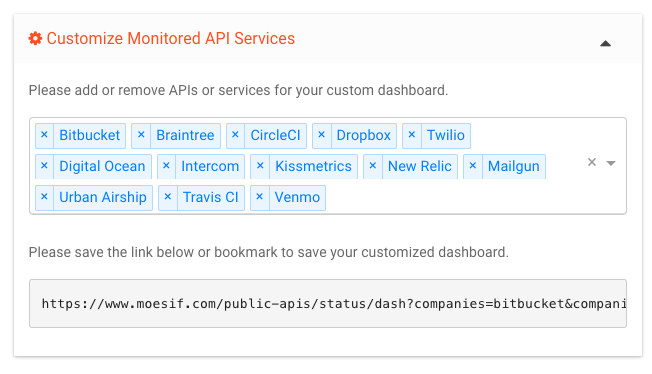
Choosing services
You can choose which services you want to monitor using a dropdown multi select on the top right. Simply search or select the service you want to monitor. The URL can be bookmarked and shared. When you revisit the URL, the same services that you previously selected will be shown. Be sure to bookmark your customized dashboard or save the link and share with others.
Viewing service details
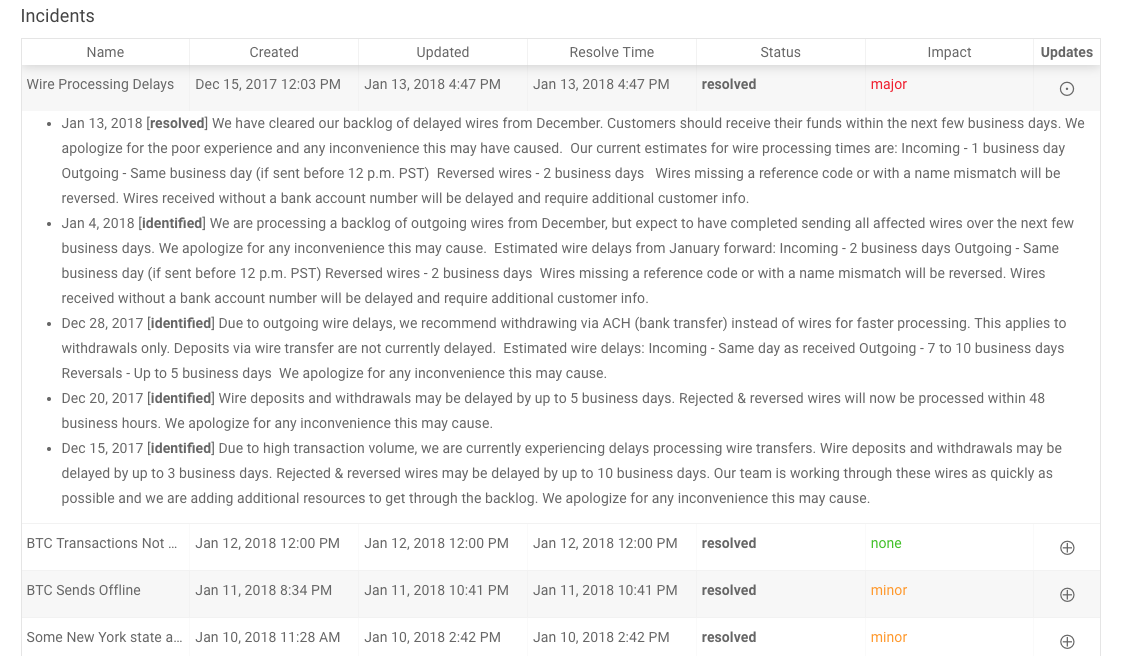
You click on an individual service to see more details. The details view will have a breakdown of status by each component along with a list of past incidents and maintenance events. There is also a section for upcoming scheduled maintenance.
You can also sort and filter based on variety of data such as: status, impact, updated time, resolved time, and more.
Future
We do realize the current list of supported organizations is not complete. We will continue to add missing services or APIs that you’re using. To help us prioritize, please feel free to contact us to let us know which ones should be added.
Many of these status pages are created using a ping like services. However, pings won’t give you insight into your specific API traffic or why errors happen. If you want in depth analytics and error monitoring for APIs, we shamelessly recommend our main product: Moesif API analytics. :)
Moesif is the most advanced API Analytics platform, supporting GraphQL, REST and more. Thousands of platform companies leverage Moesif for debugging, monitoring and discovering insights.
Learn More

Related Articles

API Strategy
Leveraging AI For a Better API Strategy
Learn how to leverage AI to build and fortify your API strategy. Improve design, governance, documentation, and align APIs with business outcomes.
API Strategy
The 5 Best Mixpanel Alternatives of 2025
Learn about the best Mixpanel alternatives to determine the right analytics solution for your use case.

API Development
How to Leverage Moesif Effectively for API Observability
Effectively leverage Moesif for API observability through best practices for integration, event enrichment, custom actions, and engineering workflow integrat...
API Strategy
How to Build an Internal Chargeback Model for Your API and AI Usage Using Moesif
Use Moesif to implement internal chargebacks and enable precise API and AI cost attribution for better transparency and resource optimization.