Debugging a Node js Express API in VS Code Debugger
Why
When we create software, we rarely do it without errors. API creation isn’t exempt from this fact, so sooner or later we’ll need to debug it. In JavaScript, the first stop for a debugging task is often logging to the console, but using a debugger can give us a more integrated experience.
Node js is a cross platform and open source JavaScript runtime environment that allows the JavaScript to be run on the server-side.
There are many guides out there for finding the best node js bootcamp, but in this tutorial we’ll learn how to debug an Express-based API with the help of Visual Studio Code, or VS Code for short.
What
Express is a “minimalist web framework for Nodejs”. It allows us to link functions directly to API endpoints, which is a quick and simple way to build an API.
Visual Studio Code is a “streamlined code editor with support for development operations like debugging, task running and version control.”
We will also use cURL to send requests to our API.
How
We will create a simple API with the Express framework and then try to debug it with the help of VS Code’s debugging features instead of the console. You can then go on to easily add API endpoints and make an API call.
API Setup
First, we create a new Node js project and install our dependencies.
$ mkdir api
$ cd api
$ npm init
$ npm i express body-parser
Next, we create an index.js file that will act as our main server script.
const express = require("express");
const bodyParser = require("body-parser");

const users = [{ id: 0, name: "admin" }];

const server = express();
server.use(bodyParser.json());

server.get("/users", (_, response) => response.send({ users }));
server.get("/users/:id", ({ params: { id } }, response) => {
  const user = users[id];
  response.send({ user });
});
server.post("/users", ({ body }, response) => {
  const { user } = body;
  user.id = users.length;
  users.push(user);
  response.send({ user });
});

server.listen(9999, () =>
  console.log("API running on http://localhost:9999")
);
We use the users array as our in-memory data store. It gets initialized with an admin user.
Next, we create our Express server and use the JSON middleware of the bodyParser package; it allows us to access the values of a JSON string stored in the body of a POST HTTP request.
Then, we create three API-endpoints. Two GET endpoints so we can request a list of all users and one specific user by its ID and one POST endpoint to create a new user.
Let’s start the API with the following command!
$ node .
API running on http://localhost:9999
Using the API
Now that our API is up and running we can try to query it with cURL. For this, we need to open a new terminal window and execute the following commands.
Create a user:
$ curl -H "Content-Type:application/json" -d '{"user":{"name": "kay"}}' localhost:9999/users
{"user":{"id":1,"name":"kay"}}
List all users:
$ curl localhost:9999/users
{"users":[{"id":0,"name":"admin"},{"id":1,"name":"kay"}]}
List one user:
$ curl localhost:9999/users/1
{"user":{"id":1,"name":"kay"}}
Create another user:
$ curl -H "Content-Type:application/json" -d '{"users":{"name": "xing"}}' localhost:9999/users
<!DOCTYPE html>
<html lang="en">
<head>
<meta charset="utf-8">
<title>Error</title>
...
Oh no! We have a typo in the JSON, users instead of user. Since we didn’t handle this in our POST /users endpoint, Express just responded with an HTML formatted error.
This is a simple example of a problem that could be fixed without much hassle, but let’s use it to start VS Code’s debugger so we can investigate what went wrong directly at runtime.
Using VS Code’s Debugger
Debugging Node js APIs with VS Code is very easy.
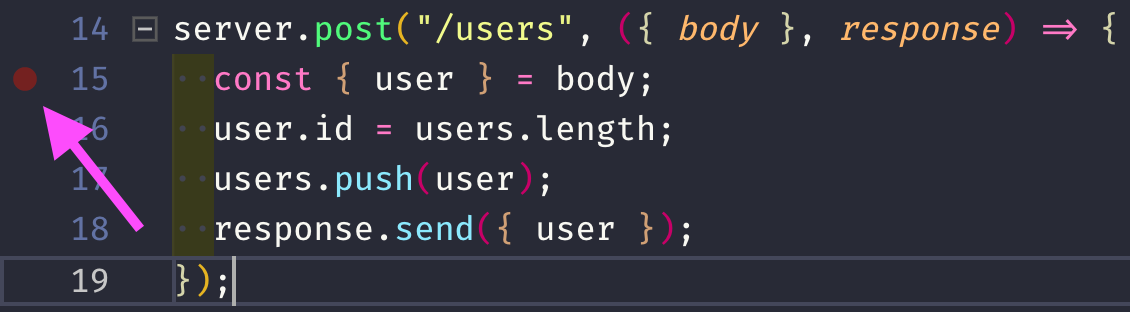
We check which endpoint we want to debug and set a breakpoint inside the function that endpoint triggers. This is done with a left-click left to the line number. Let’s to it on line 15, which should be the first line of our POST /users endpoint function.
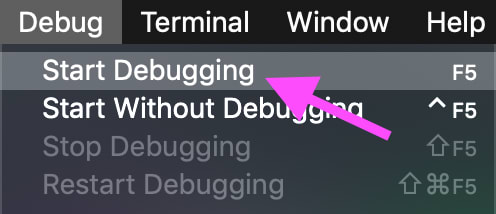
Then we start the debugger by clicking on Debug->Start Debugging at the top menu or by pressing F5.
VS Code will start our application and the debugger for us. It will also link the two together via Node.js’ debugging protocol.
Then we re-send the request that led to an error with cURL and try to find out what happens.
$ curl -H "Content-Type:application/json" -d '{"users":{"name": "xing"}}' localhost:9999/users
This request will run the function linked to POST /users and halt at the breakpoint in its first line.
If we look at the sidebar on the left of our code, we can see a VARIABLES category with various sub-categories like Block and Local. Let’s open Local and see what’s inside.
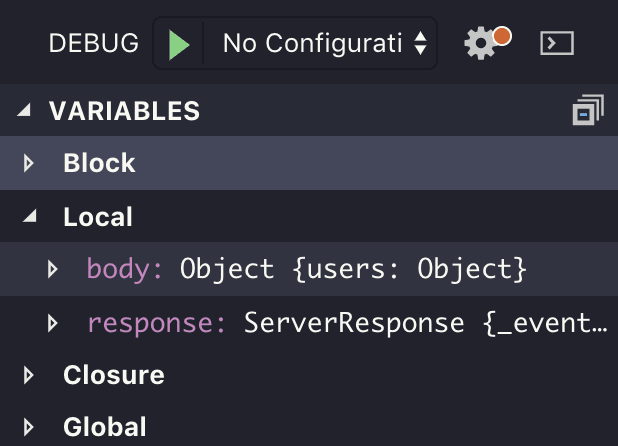
As we can see, we have two local variables, body which is of type Object and response which is of type ServerResponse.
Let’s step to the next line with F10 to see what happens.
All seems to work as expected.
Let’s step to the next line again.
BOOM!
Somehow we ended up in a whole different place of the codebase?
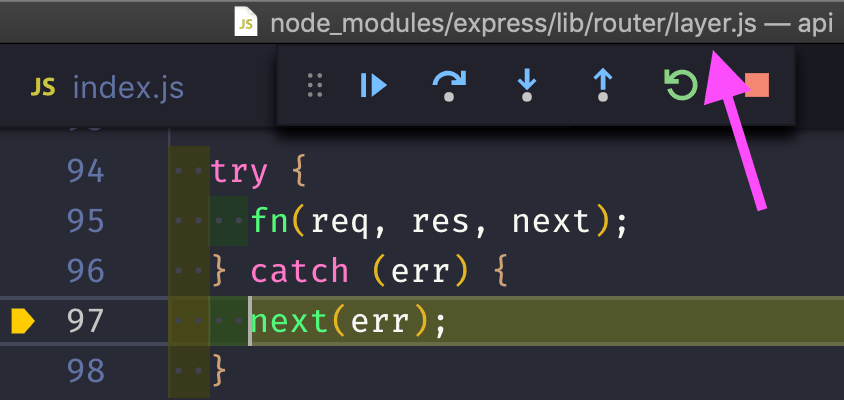
It seems like we created an error by setting the id of our user object, how did this happen?
Let’s open our index.js again, move the break-point to line 16 and let the debugger run to the end of the event loop by pressing F5.
Then re-send the request with cURL to see what happened before we tried to set user.id.
When we look into the side-bar in the VARIABLES/Block category, we can see that our user object is in fact undefined! If we open the VARIABLES/Local category, we can also see why.
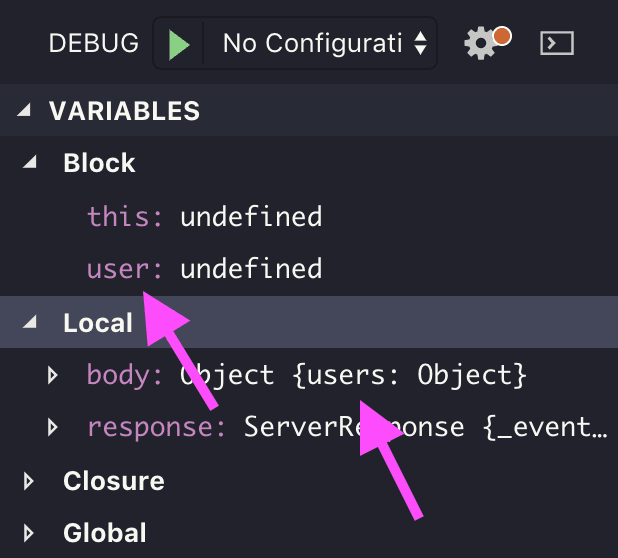
Our body has a users attribute, but we try to destructure a user variable from it in line 15, which leads to an error when we try to write to user.id in line 16.
Now that we now our problem, let’s stop the debugger and fix it.
server.post("/users", ({ body }, response) => {
  const { user } = body;

  if (!(user instanceof Object))
    return response.send({ error: '"user" object missing in JSON!' });

  user.id = users.length;
  users.push(user);
  response.send({ user });
});
Let’s restart our server, so it runs the new code:
$ node .
API running on http://localhost:9999
And resend our problematic request:
$ curl -H "Content-Type:application/json" -d '{"users":{"name": "xing"}}' localhost:9999/users
{"error":"\"user\" object missing in JSON!"}
Finally, we get a useful JSON formatted error message.
Conclusion
Debugging Node js based APIs with the help of VS Code’s integrated debugger is a straight-forward task. We just need to set a break-point, no additional code involved.
It gives us many runtime insights out-of-the-box, including:
- Values of current variables
- Ability to watch single variables
- Current call-stack
- Currently loaded scripts


Related Articles

API Strategy
Leveraging AI For a Better API Strategy
Learn how to leverage AI to build and fortify your API strategy. Improve design, governance, documentation, and align APIs with business outcomes.
API Strategy
The 5 Best Mixpanel Alternatives of 2025
Learn about the best Mixpanel alternatives to determine the right analytics solution for your use case.

API Development
How to Leverage Moesif Effectively for API Observability
Effectively leverage Moesif for API observability through best practices for integration, event enrichment, custom actions, and engineering workflow integrat...
API Strategy
How to Build an Internal Chargeback Model for Your API and AI Usage Using Moesif
Use Moesif to implement internal chargebacks and enable precise API and AI cost attribution for better transparency and resource optimization.