Why I started another application logging company

There are many logging and exception tracking companies out there. From Sumo Logic to Sentry, developers have more choices for application logging and exception tracking than ever. Why create a new logging company in a space that appears to have large players?
Background
Before starting Moesif, I was CTO at Trove and before that a CPU Architect at Intel. In each of these positions, debugging was always a large part of my day to day activities. There were periods in our project life cycles where majority of my daily work involved debug. I would be debugging customer reported issues, debugging errors that pop up in regression testing, debugging my own code before commit, and so on. There was no escaping the fact that majority of developers spend more time on debugging than on coding and product development.
For the Trove stack, we used Loggly for storing our application logs from our backend API driven services that we had. These were a combination of Scala, C#, and NodeJS services. For our web apps, we also used Sentry to log and track exceptions. For our mobile apps, we used Crashlytics.
We also used New Relic for some performance monitoring, although New Relic was mostly useful for the ops and performance guys, but not for application debugging.
Yet, even with all these services, debugging was still a manual and slow process. In the age of self driving cars, why can’t we make debugging more automated?
Breaking down the debug process
Gathering context
At Trove, I received a few customer support requests where customers would experience an error on login.
To start debugging, I would have to gather customer context like what device did the error occur on and the time of error. I looked up the user_id in our Users Db by searching for the customer’s email from the support ticket.
After getting a user_id, I searched Loggly in hope that the user_id was logged with the exception.
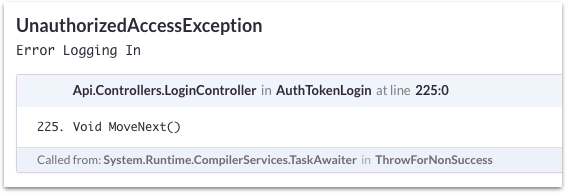
Alas, I found the error! The problem though is that the exception logged in Loggly and Sentry was very generic:
Narrow down the failing service
We had quite a few microservices powering our backend leveraging tools like Docker. Some were Node, some were Scala, etc. Then we had the mobile and web apps. The error in Loggly would only tell me where the error occurred. However, we all know that usually an error is the result of some causality, but that cause is probably way upstream from where the error occurred.
To narrow down the root cause, I continued my manual log search to find related messages trying to trace back to the source. For this particular login error, I was able to trace back to a 3rd party API, the Google Authentication API.
Process of elimination
Even though we see the error logged and now know it’s due to the Google API, it is still very transient. I can’t reproduce the error myself even when trying to go through the Google login steps.
I start gathering even more information.
- Does the error only occur in a certain datacenter?
- Does it occur With specific parameters into the Google login API?
- What was the first release where this error popped up?
The time doing this process of elimination can be very large and a time waster for any developer.

The result
We finally root caused the error to a case where a mobile client would call the Google Auth API to get a one time use auth code (OTU) in very rapid succession due to transient HTTP timeouts. This OTU token was passed to our own API, which then call a different Google API to verify the auth code and exchange for an access and refresh token. This final endpoint would error due to the auth code already been used or expired.
We had to trace back to the initial auth endpoint which was called twice. Google would return the same OTU code (maybe due to caching).
The API call flow:
-> accounts.google.com/o/oauth2/v2/auth
  -> api.usetrove.com/login
    -> www.googleapis.com/oauth2/v4/token
What’s wrong with this approach?
1. The customer had to tell me
Even with always connected alerting (Slack, PagerDuty, DataDog, etc), I still had a customer tell me something was wrong. Why didn’t our tests catch this? Why didn’t Sentry or Loggly alert me of the issues before the customer?
One hint: State space explosion and the dynamic nature of bugs.
Bugs manifest with a particular:
- State of a system
- Inputs to a system (which includes timing)
If I could re-create state and inputs precisely, then I can recreate any bug. The problem is the state of a modern web app is orders of magnitude more complex than a few years ago.
State is scattered across:
- Many different petabyte sized data stores
- Many different types of devices and clients which also store state
- State of build artifacts and code versions
- Configuration and environment state
- OS/VM/Container state
Inputs are now scattered across hundreds of containers and has to consider network latency input, user input to a device, etc.
Alerting is still static (i.e. I have to set up alerts to alert me if the error rate doubles in the next minute). Tests are also static. Tests are contrived scenarios and many times are written by the developer who also coded the feature. What if the feature has bugs due to an architectural assumption that was made for an interaction across services? Those assumptions may also be baked into the test creating false passes.
2. Log search is still very manual
Once I saw an error in logging or exception tracking software, I still had to do my own log search.
As seen from debugging the login issue, it takes time to lookup the user_id from the support email. Then I have to find the exception that occurred for that user.
Debugging is like trying a bunch of small experiments. You come up with a hypothesis based on current knowledge of the error scenario, then you investigate the logs to see if it validates your hypothesis.
You need to repeat this over and over until you have enough evidence to conclude the root cause is.
Doesn’t this process sound like something a computer could do faster?
3. Logs have to be manually coded
Most developers will log every exception or at least log what they believe to be an error. What if you need to trace back to the causing service and the messages were not logged? Just like contrived tests, developers can only log what they think they will need to debug a service. What if a new bug stresses a service differently than expected and not enough context was logged.
You have to add more log messages and then see if you can recreate the scenario. It takes time to release a new build that has more messages just to capture the problem.
4. Logs can’t show interactions
Most log and exception tracking tools show messages by themselves as a issue ticket or like tailing a log stream. What if the error is across multiple services? How do you show this in a concise way? When you start looking into more complicated bugs related to concurrency across multiple systems, it’s still very hard to use only logs for root cause.
Conclusion
Debugging can be fun and exhilarating, especially sometimes when I discover a crazy race condition, it’s fun. However, most companies don’t pay developers for “fun.” Time spent on debugging is time not spent on product development or growth which may impact revenue and the bottom line.
How does Moesif make debugging easier?
Learn More

Related Articles

API Strategy
Leveraging AI For a Better API Strategy
Learn how to leverage AI to build and fortify your API strategy. Improve design, governance, documentation, and align APIs with business outcomes.
API Strategy
The 5 Best Mixpanel Alternatives of 2025
Learn about the best Mixpanel alternatives to determine the right analytics solution for your use case.

API Development
How to Leverage Moesif Effectively for API Observability
Effectively leverage Moesif for API observability through best practices for integration, event enrichment, custom actions, and engineering workflow integrat...
API Strategy
How to Build an Internal Chargeback Model for Your API and AI Usage Using Moesif
Use Moesif to implement internal chargebacks and enable precise API and AI cost attribution for better transparency and resource optimization.