Using Moesif’s Live Event Log to Filter and Inspect API Calls and Events
As you may know, event logs are a common feature in operating systems and other software that keep track of system and application errors. When you have API traffic to follow or front-end actions you want to watch, using Moesif’s Live Event Log is a simple way to filter and find the data you need. In this article, we will go over the basics of Live Event Log, including how to filter for the data you want, different actions you can perform on the logs, and how to use them for troubleshooting and debugging.
What Is a Live Event Log?
The Live Event Log in Moesif is a real-time running record of all the API events and actions that are taking place within your application or services. The Live Event Log allows you to filter on specific attributes within the received API Calls and Actions. The Live Event Log gives you a raw and easy-to-navigate way to explore user-centric insights into API usage and user behaviors on your platform.
Why Use a Live Event Log?
Live Event Log can be an incredibly useful tool for tracking what’s happening on your website or application in real time. Using the Live Event Log can help you troubleshoot errors, track user activity, and gain insights into how your site or app is being used.
When looking at traditional logs, searching and filtering can be extremely difficult to do. Moesif supports extremely simple or complex queries with ease. Moesif allows you to build queries based on the data that is in the logs so that there is no guessing. For example, if you are filtering on an endpoint, Moesif will pre-populate the filter dropdown with the endpoints that are contained in the current data.
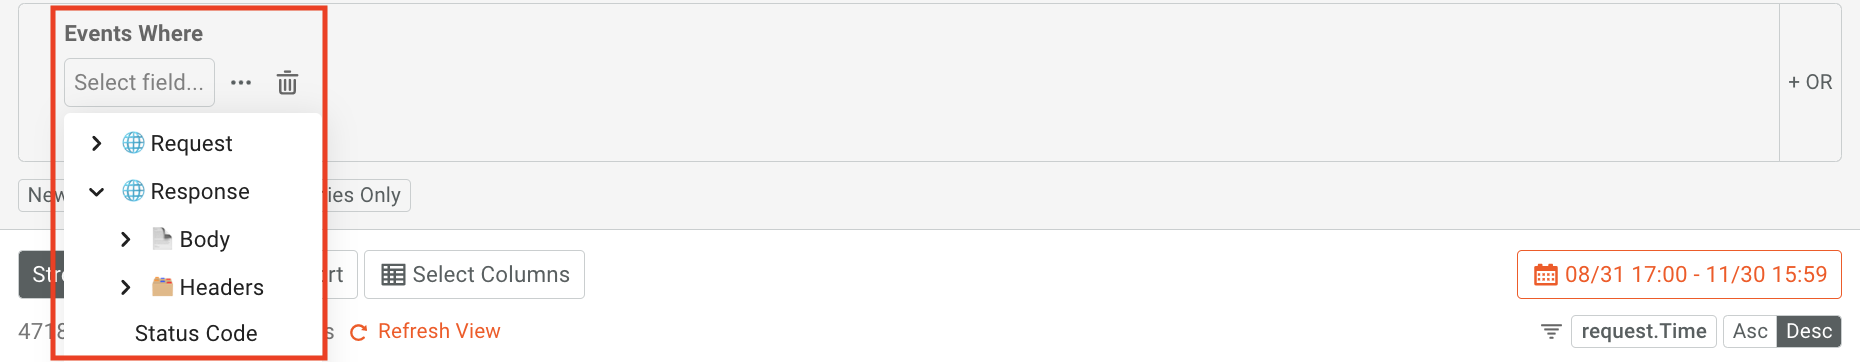
Moesif also supports Body and Header analytics which means that you can have a Moesif filter based on a specific body field and its contents. This level of granularity is part of what sets Moesif apart from other API and product analytics platforms.
Using the Live Event Log
Now that you know what the Live Event Log is and what it does, let’s take a look at how to use it in Moesif. Although this isn’t an exhaustive list of all the ways you can create and use Live Event Log, we will show you some common ways to create and use them.
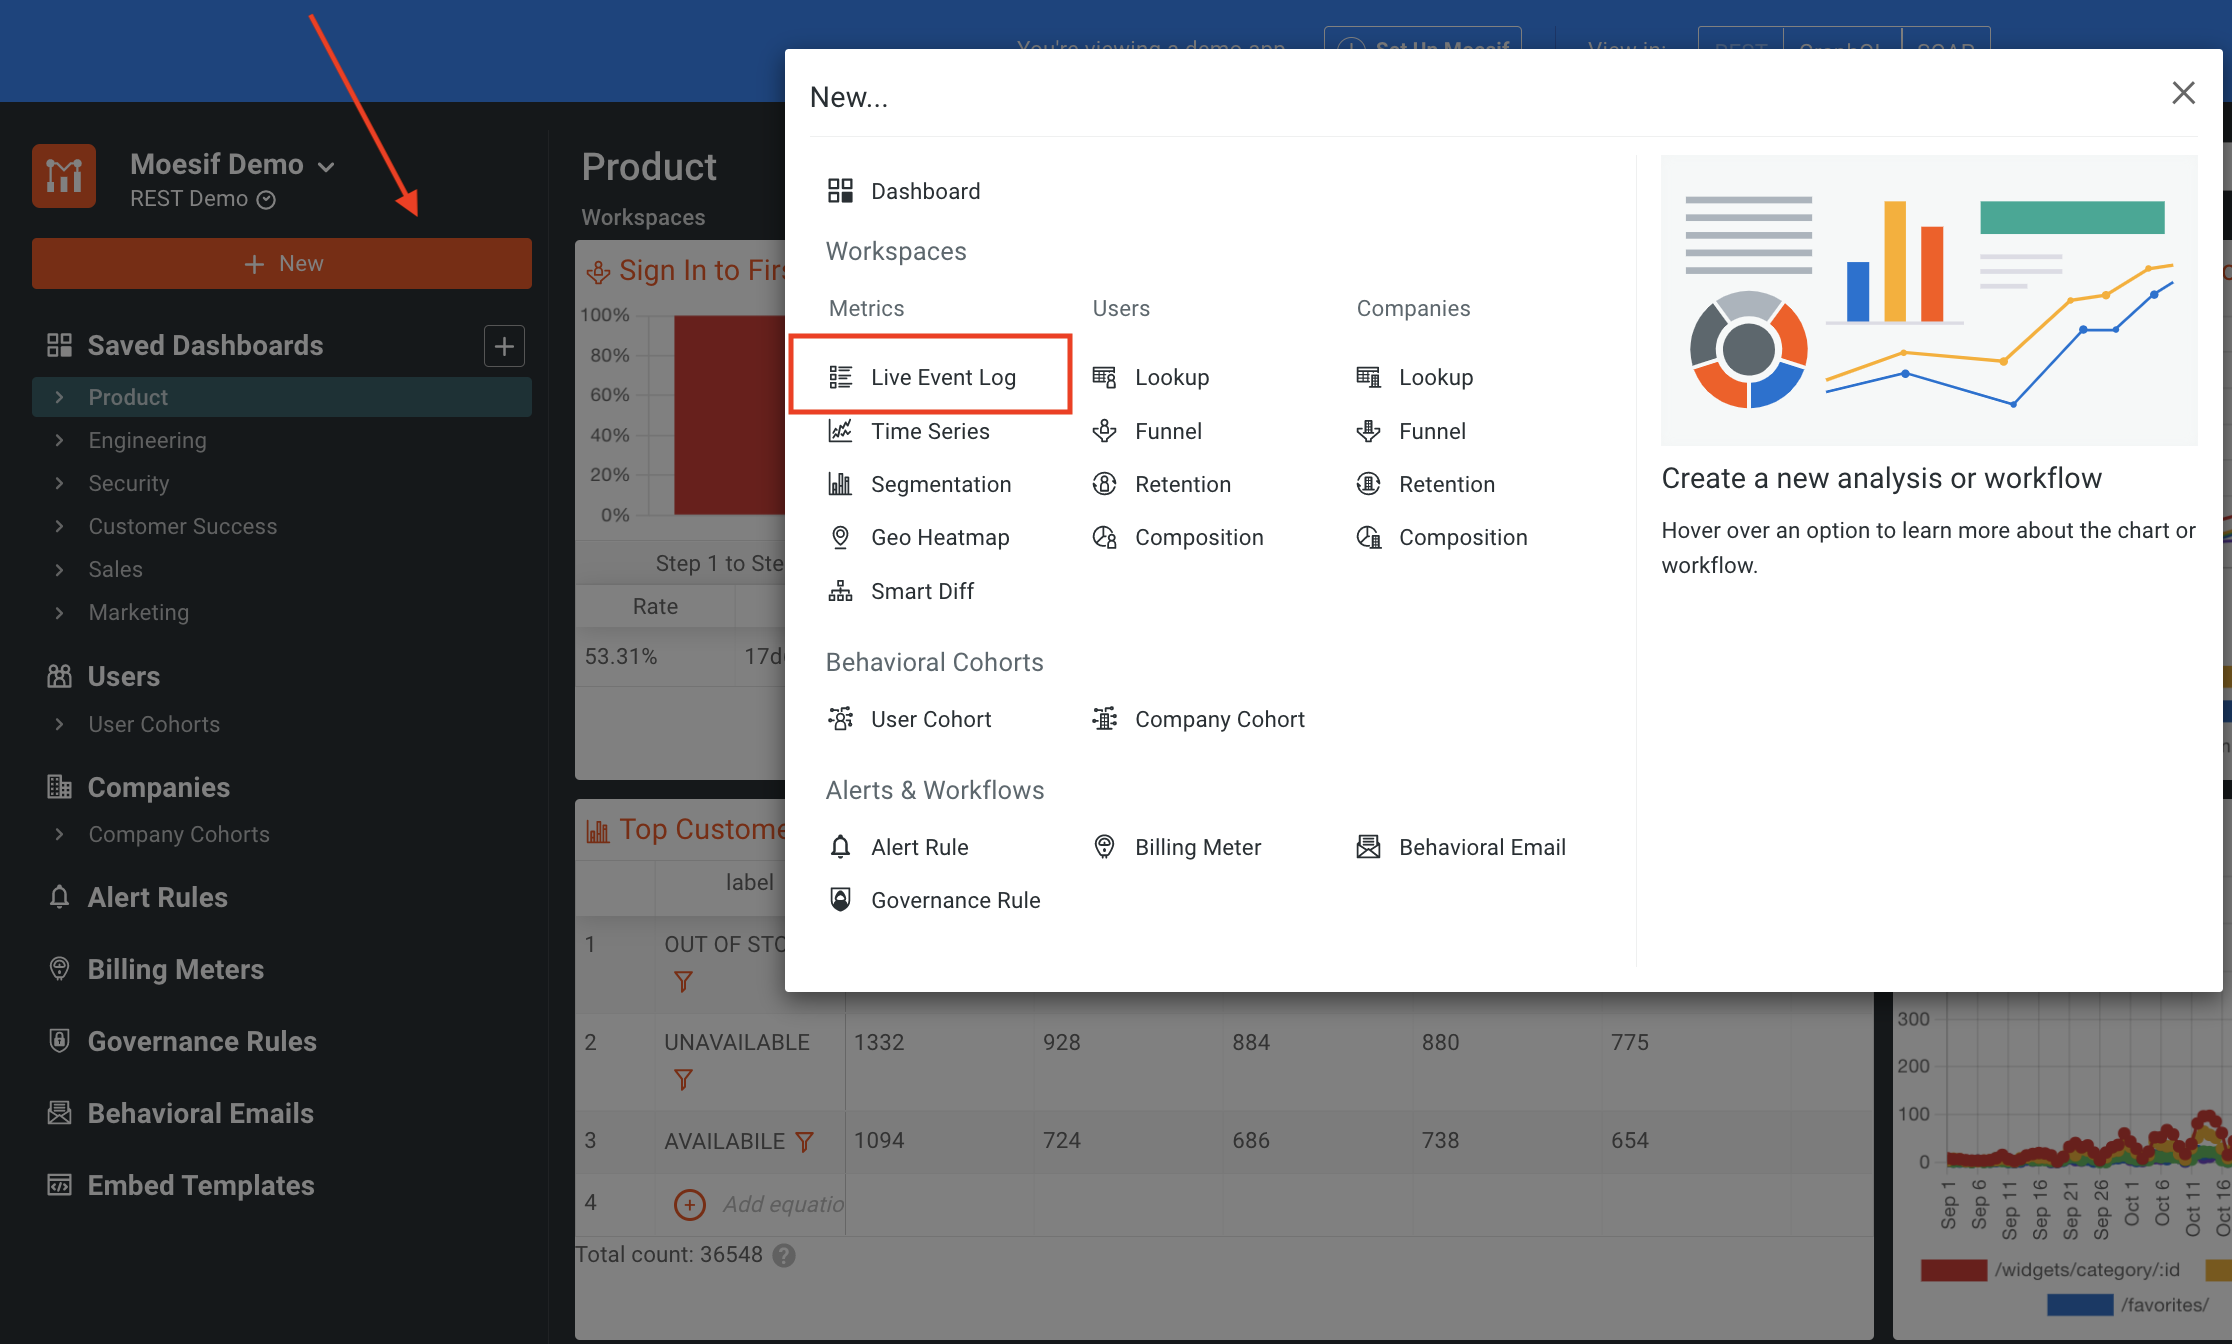
To get to the Live Event Log screen, click the New button and select Live Event Log.
How to create a filter
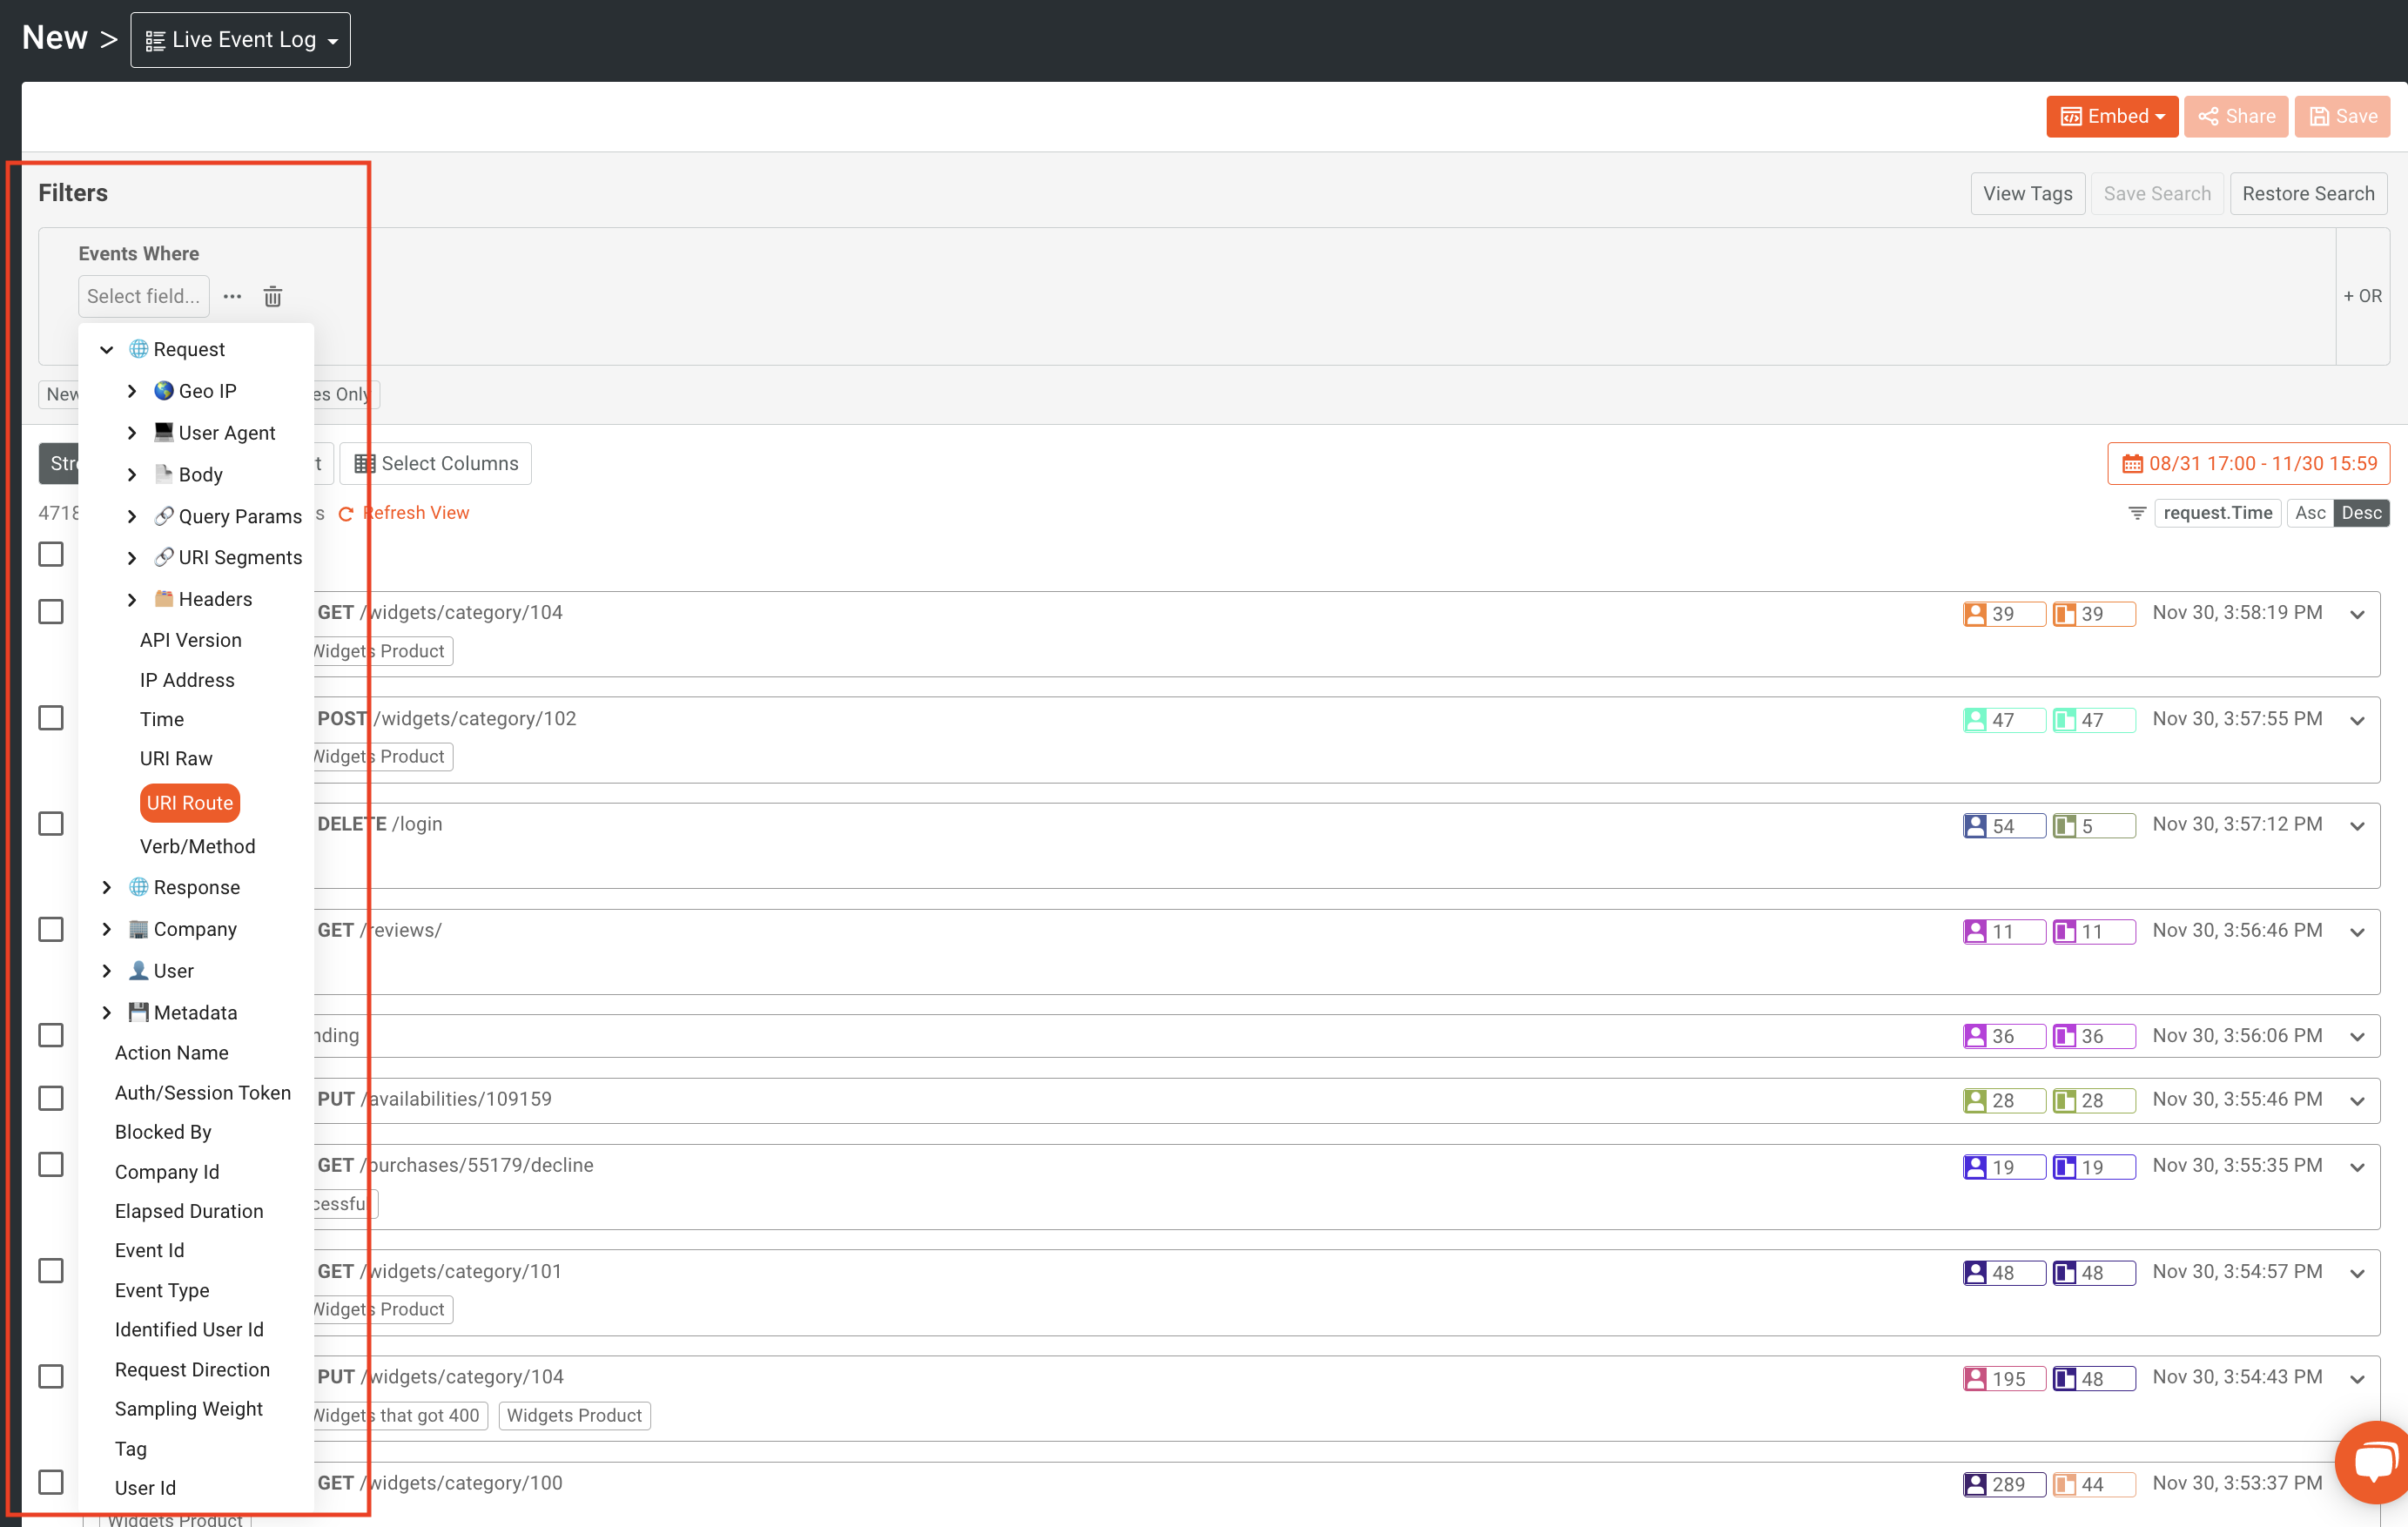
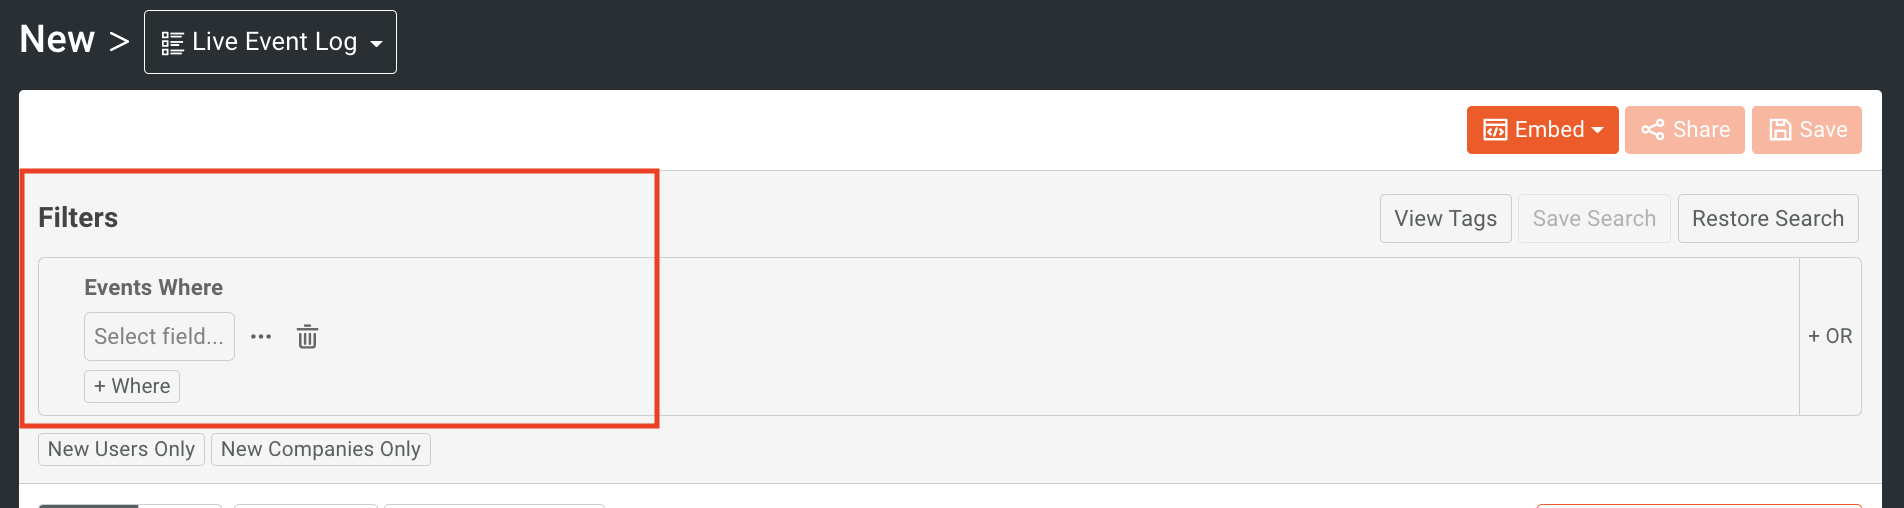
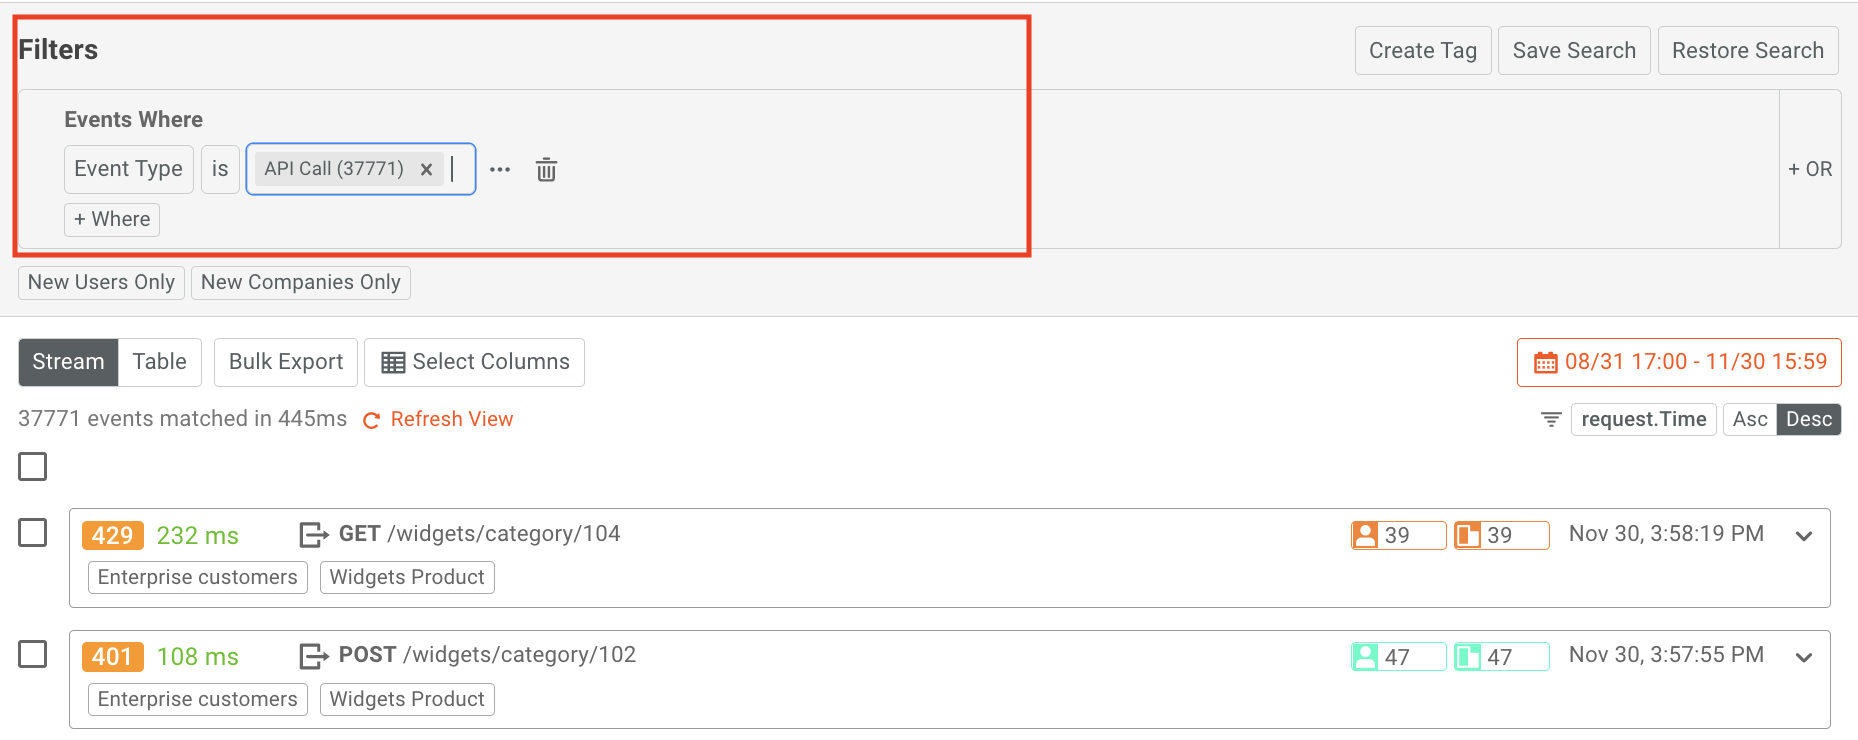
Creating a filter is the best way to view events that are in the Live Event Log screen. Once you are in the Live Event Log screen, the filter input is at the top.
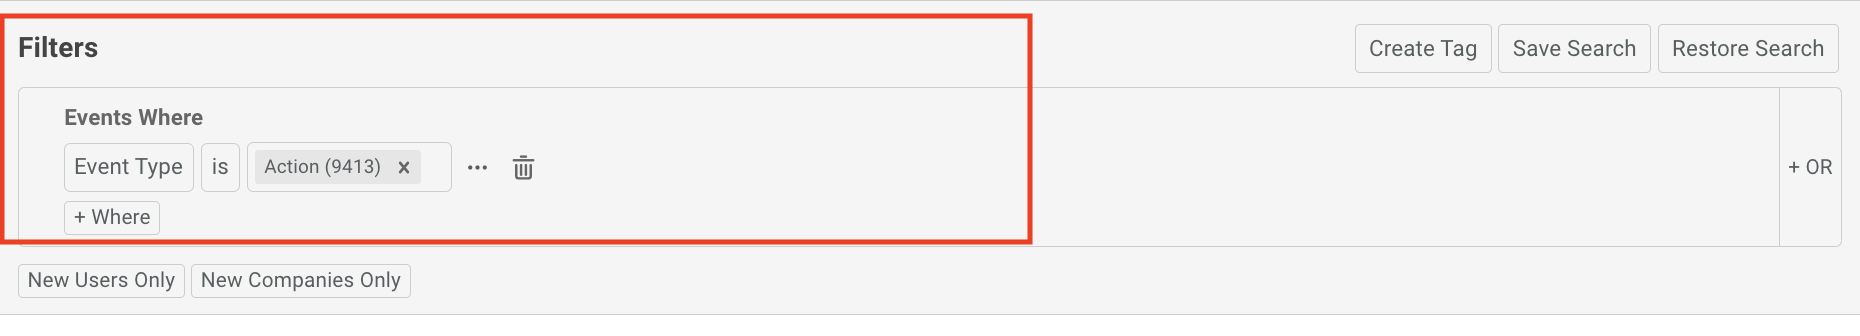
You can filter by a variety of API properties like URI route, query parameters, HTTP headers, and body fields. You can also filter based on whether an event is an API call or an Action. Actions show the activity of the customer in your UI, such as “logged-in” or “Viewed-Guides”.
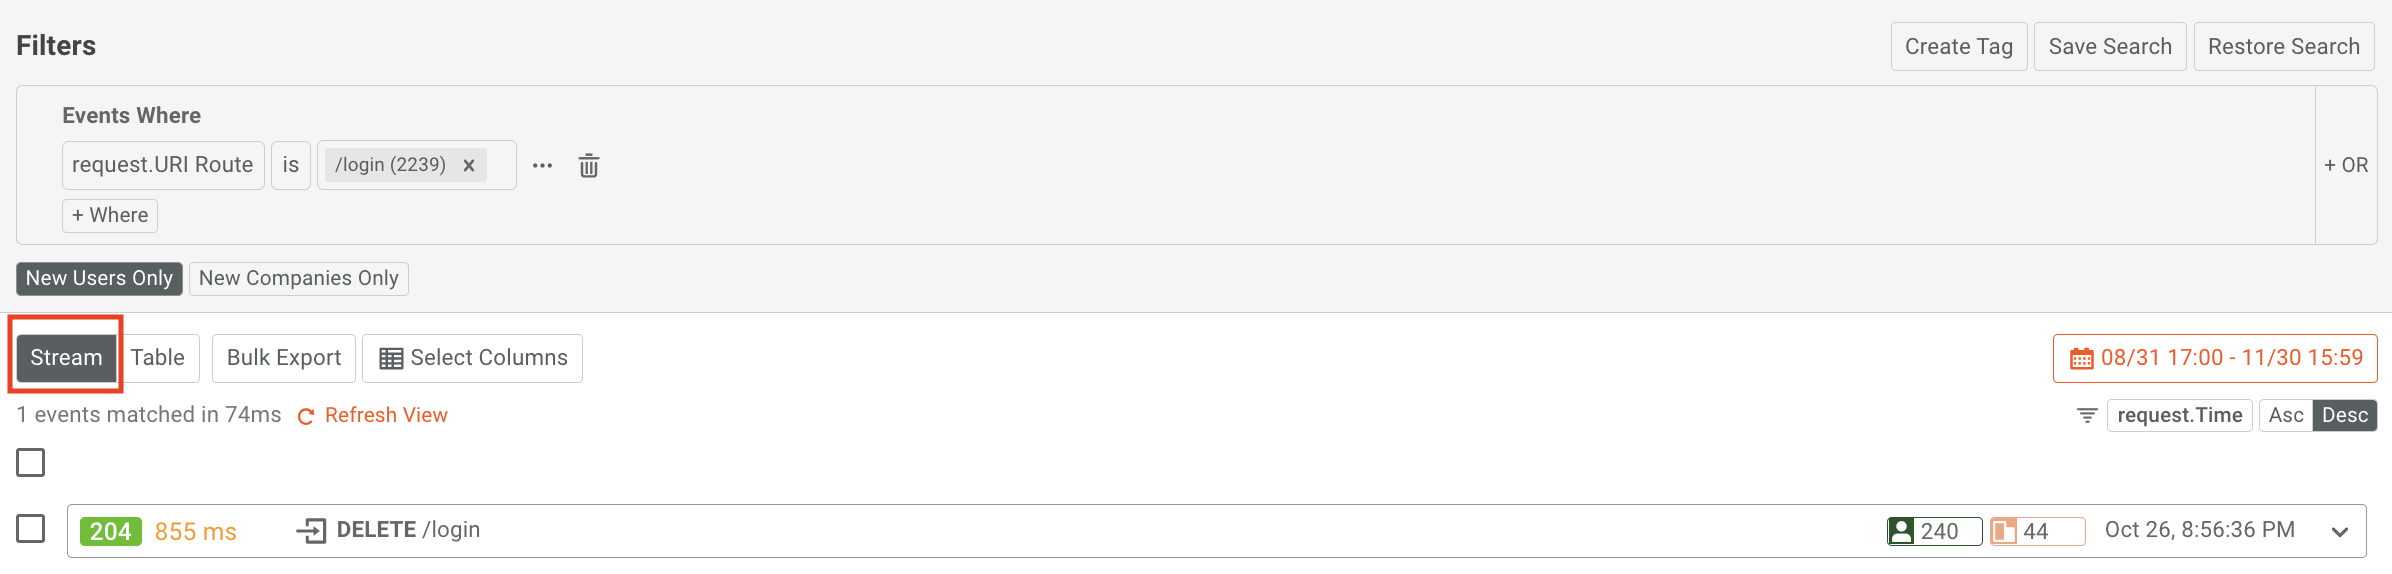
Live Event Log will also allow you to display the actions of new users and companies only. This can be done by using the New Users Only and New Companies Only filter buttons.
A filter can be extremely simple or complex depending on the data you are looking for. For more information on how to build filters, check out our docs.
Displaying the event data
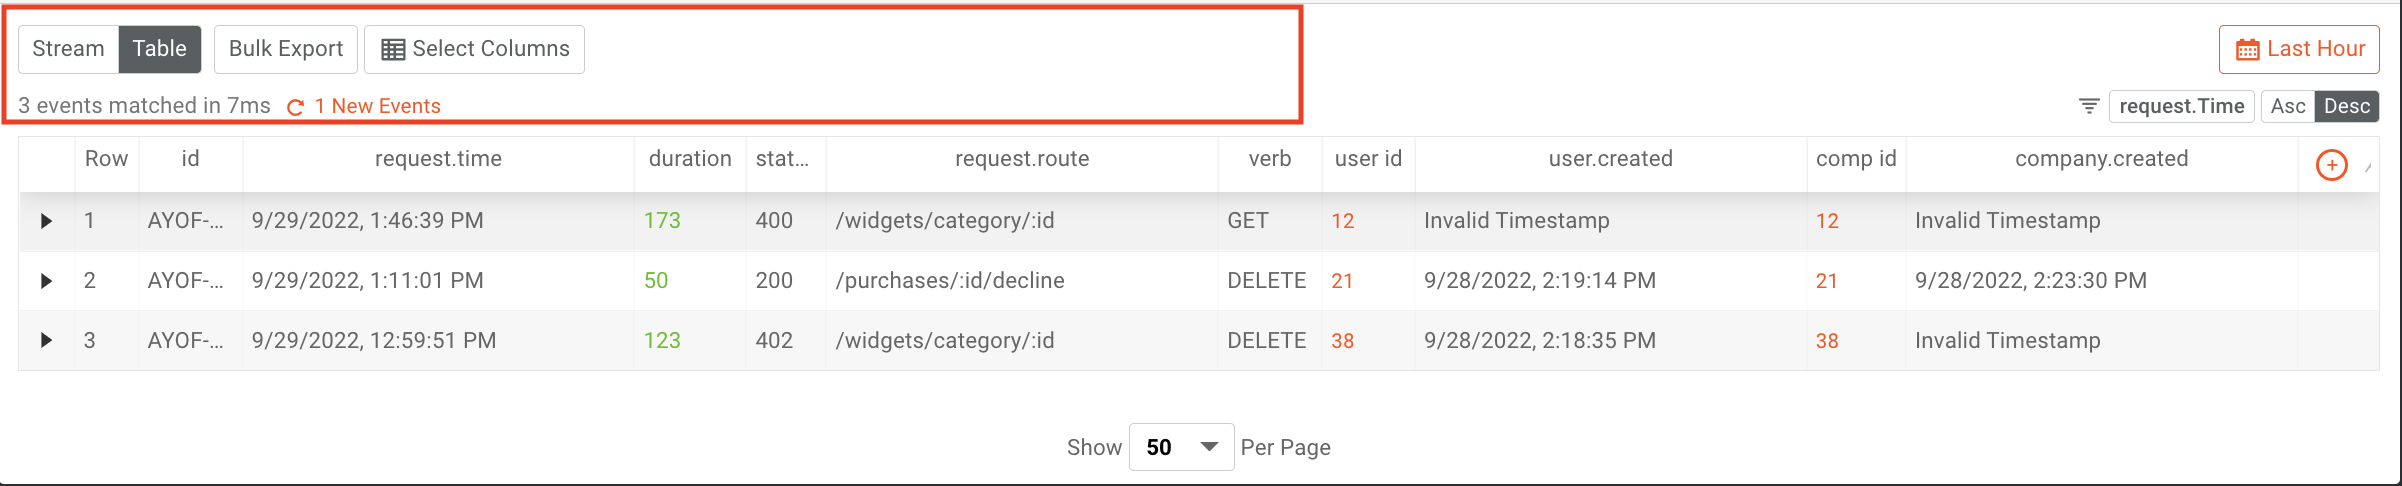
You can also customize how you view the Live Event Log. You have the ability to view the data from Live Event Log as a Stream or Table. The Stream view displays each API call or Action as clickable elements.
The Table view displays the events in a fashion similar to a spreadsheet.
Exporting the data
Other features offered by Moesif include the ability to download events through the browser or to export the events to run in Postman.
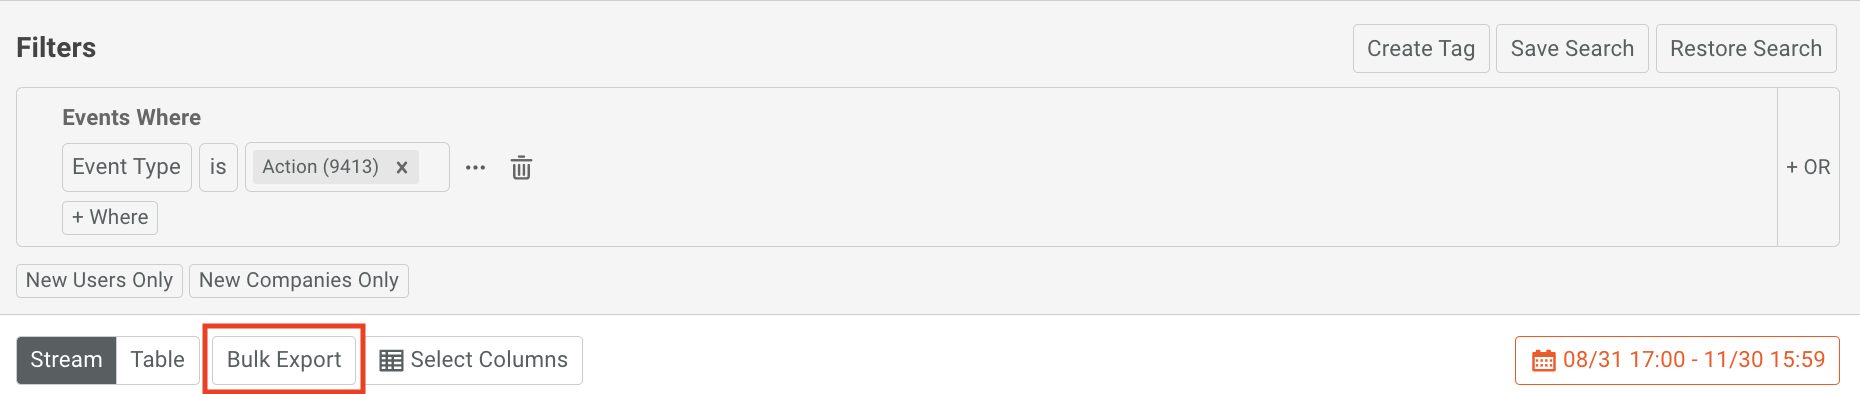
To export events, select some events and click on the Bulk Export button.
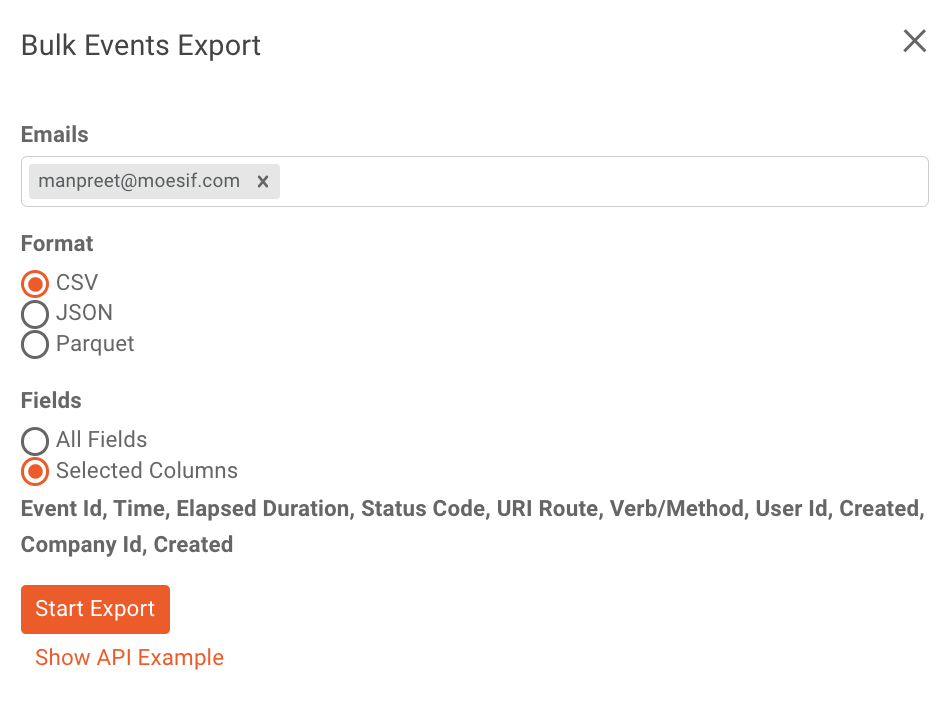
You will then choose if you want the output to be in JSON, CSV, or Parquet format and an email to send. Once the form is completed, click the Start Export button.
Once the export is complete, you’ll get an email with a download link to the email(s) specified in the previous modal.
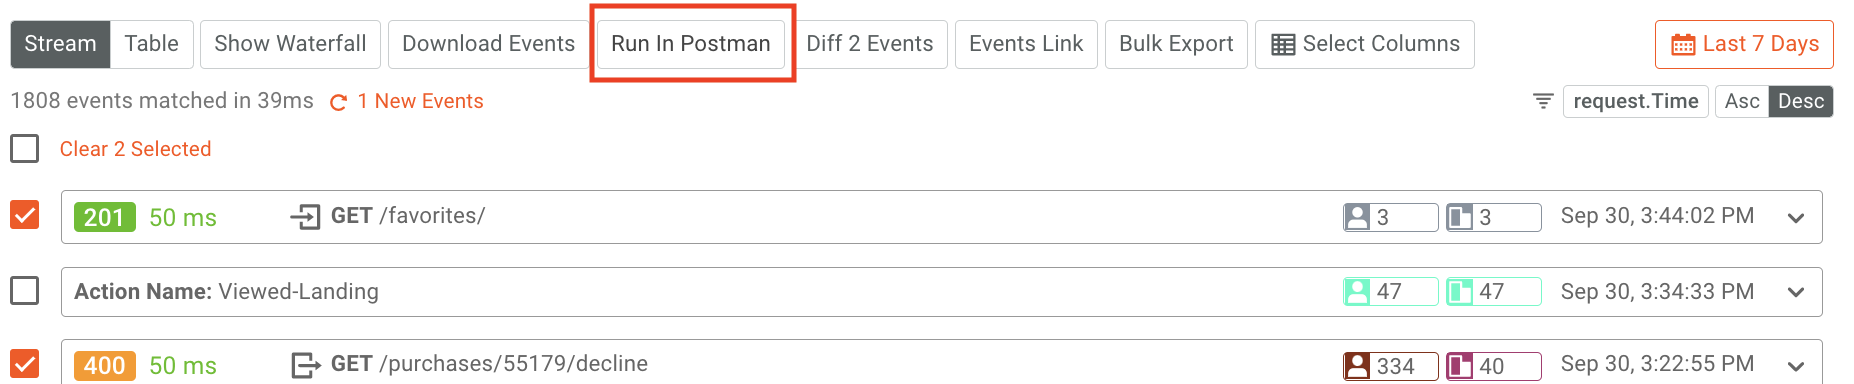
For Postman, simply select the API calls you want to export and click the Run in Postman button at the top of the screen.
You’ll then be prompted to Download Postman Collection. The collection will save and can then be uploaded to Postman. For more specifics, check out our docs which show the step-by-step procedure.
Comparing events using Diff 2 Events
Sometimes it makes sense to compare the request and response of 2 different calls. This is a common scenario when trying to debug issues within an API call. You may want to check the difference between a successful call and one that is causing an error. To do this in Moesif, you can use the Diff 2 Events function to compare two API calls.
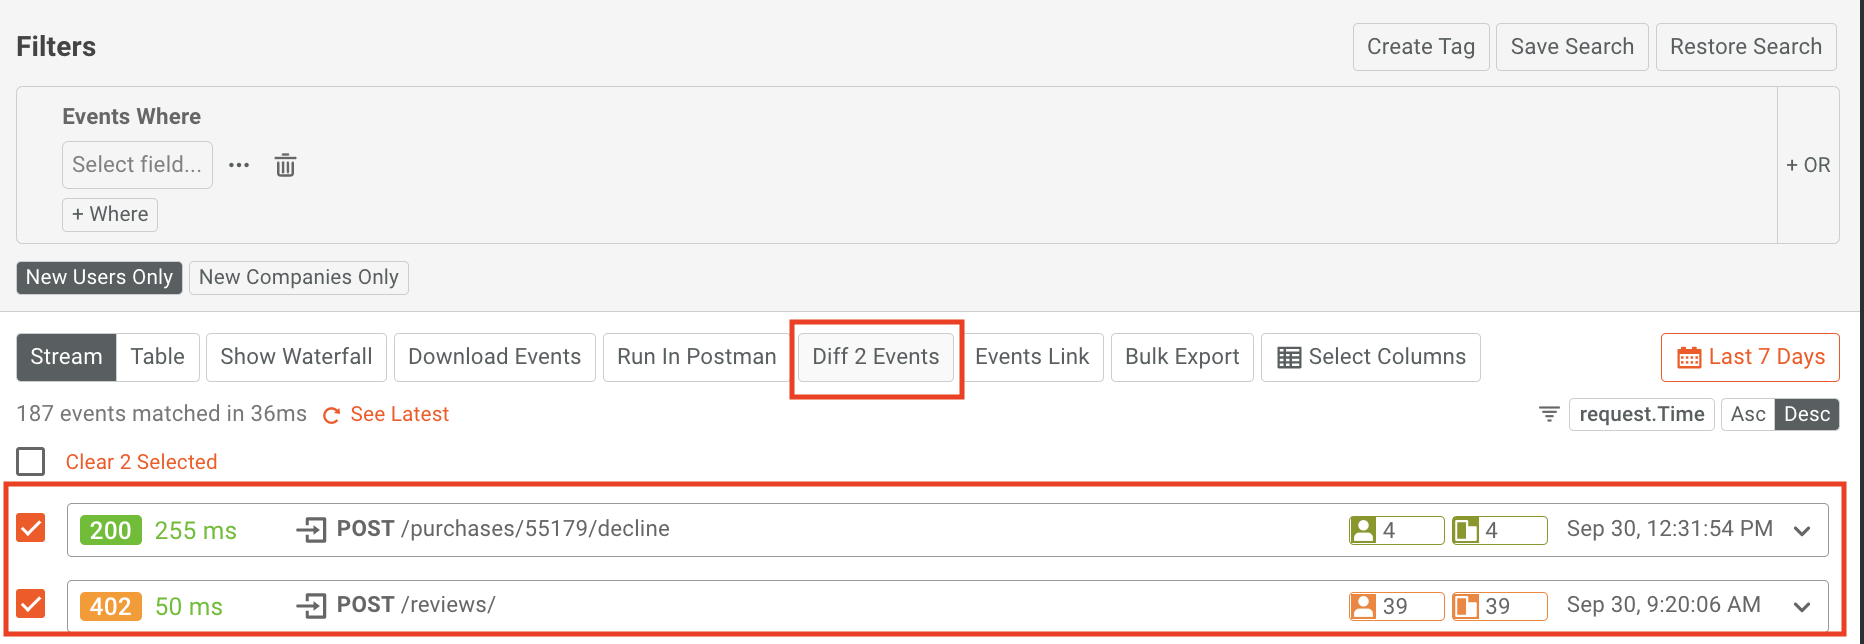
Once two calls are selected and the Diff 2 Events button is clicked, you will be able to see the red highlighted text showing changes removed while green showing implemented changes.
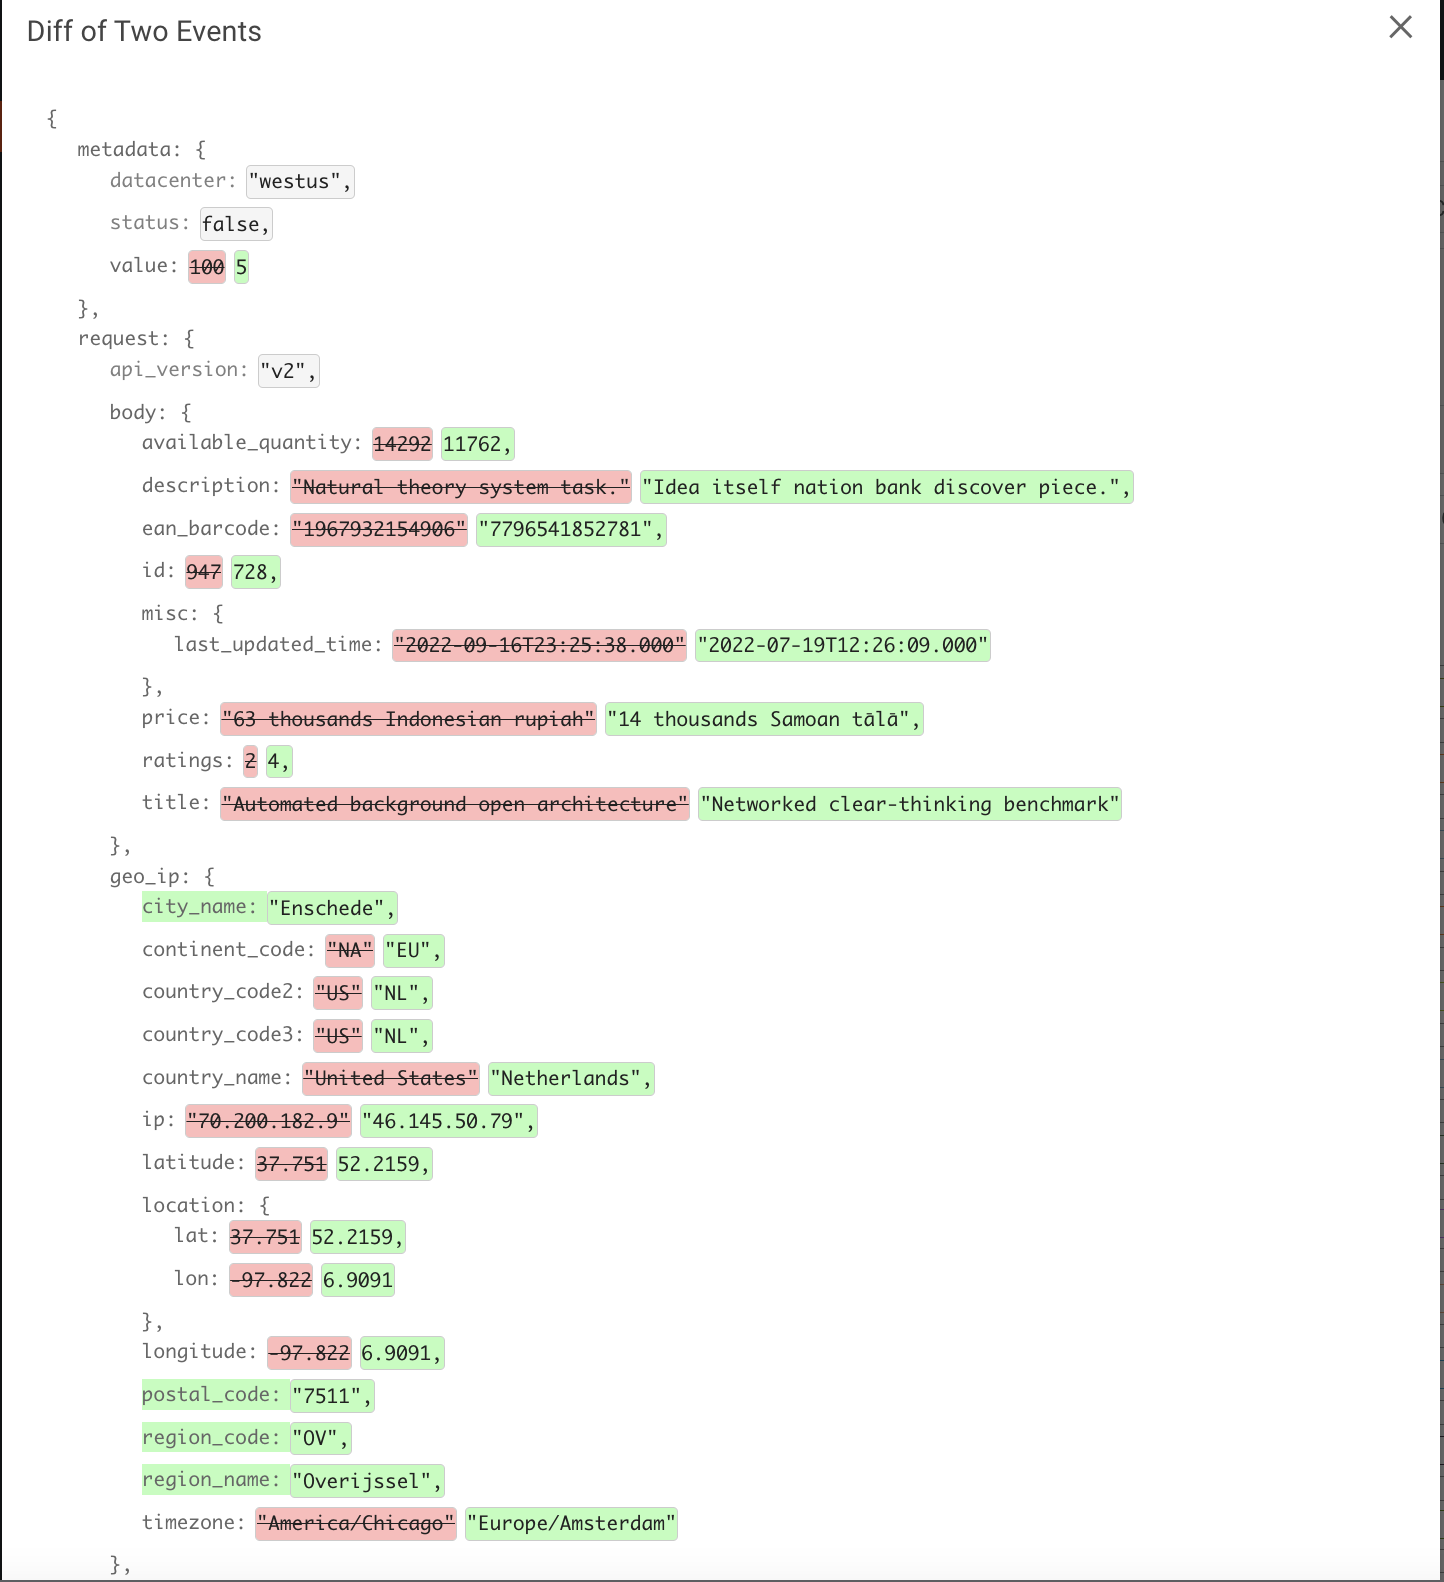
Using this functionality takes out the manual work of trying to find differences and easily shows the user in an easy-to-read fashion.
Saving your search to a Dashboard
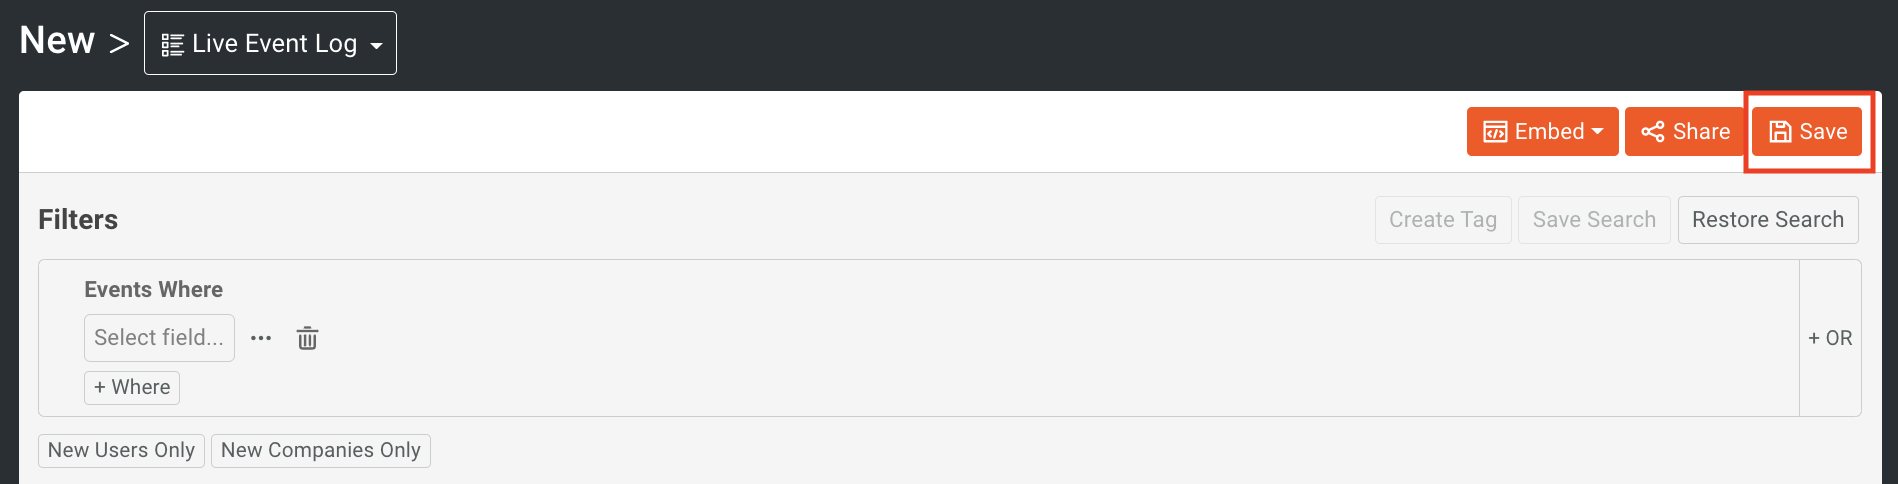
Once you can create a Live Event Log filter that you like, you may want to add it to a dashboard in Moesif. Moesif gives you the option to save and share your created logs with your team members or privately. To save a Live Event Log to a dashboard in Moesif, click the Save button.
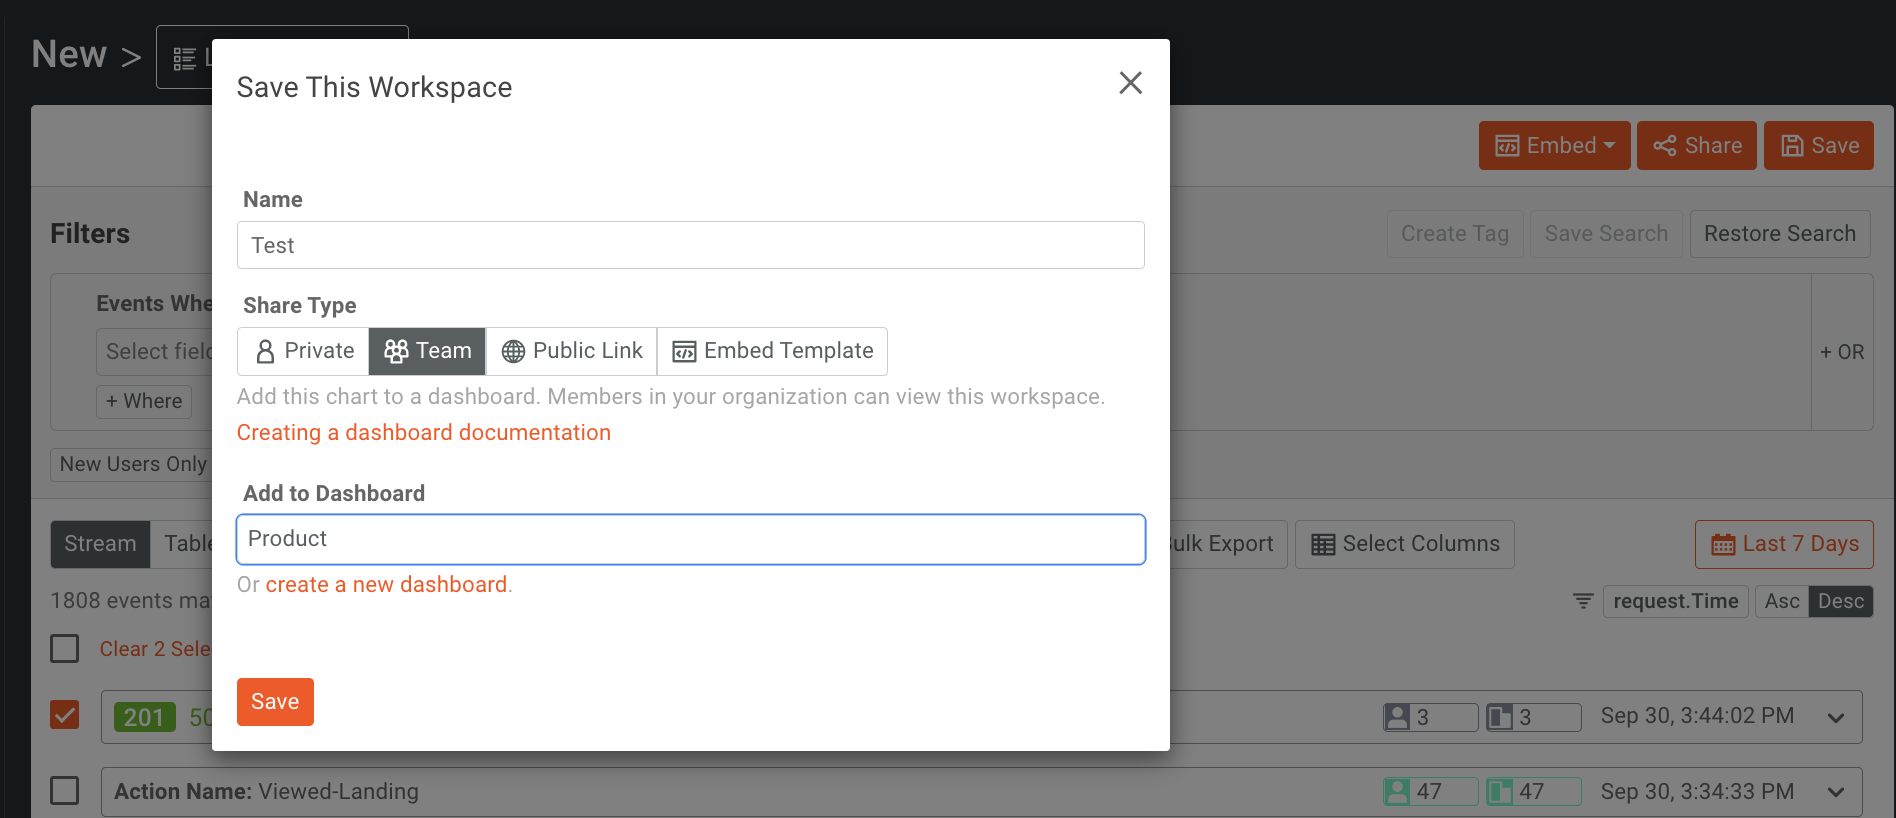
In the modal that appears, name your new workspace (the Live Event Log you just created), choose if you want the workspace to be private or for your team, and select the Dashboard you would like to add it to.
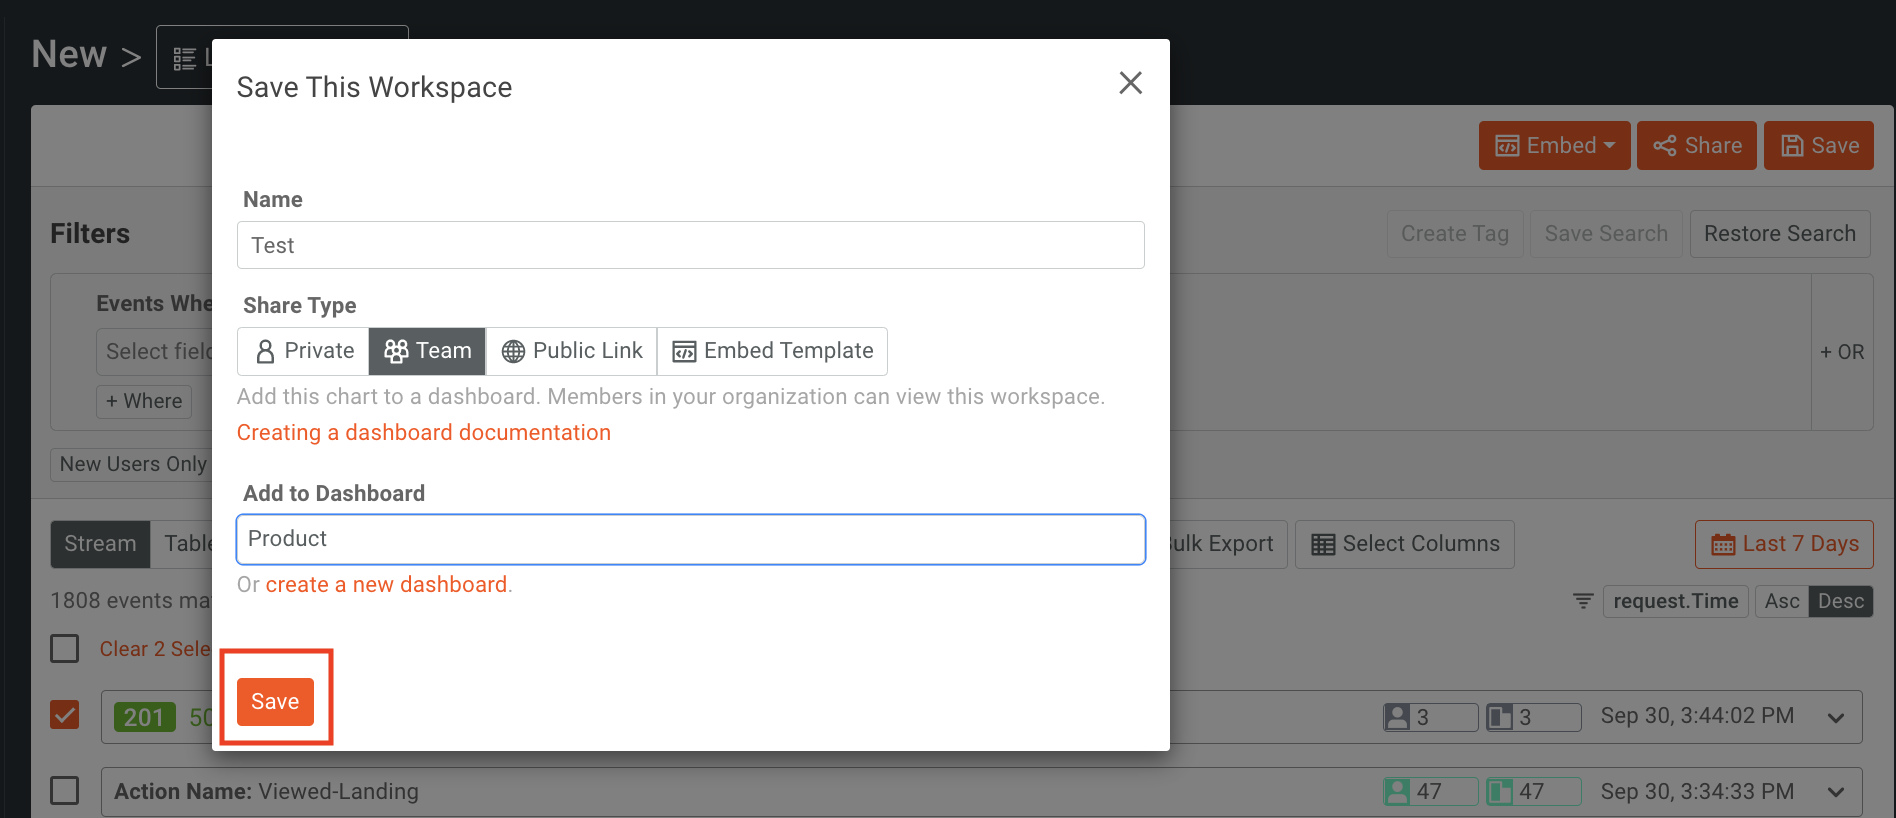
Lastly, click the save button at the bottom of the modal to save the workspace to a dashboard.
Exporting the Live Event Log as a public link or embedded template
If you’d like to share your Live Event Log to users who don’t have access to Moesif, including your customers, you can use a Public Link or Embedded Template.
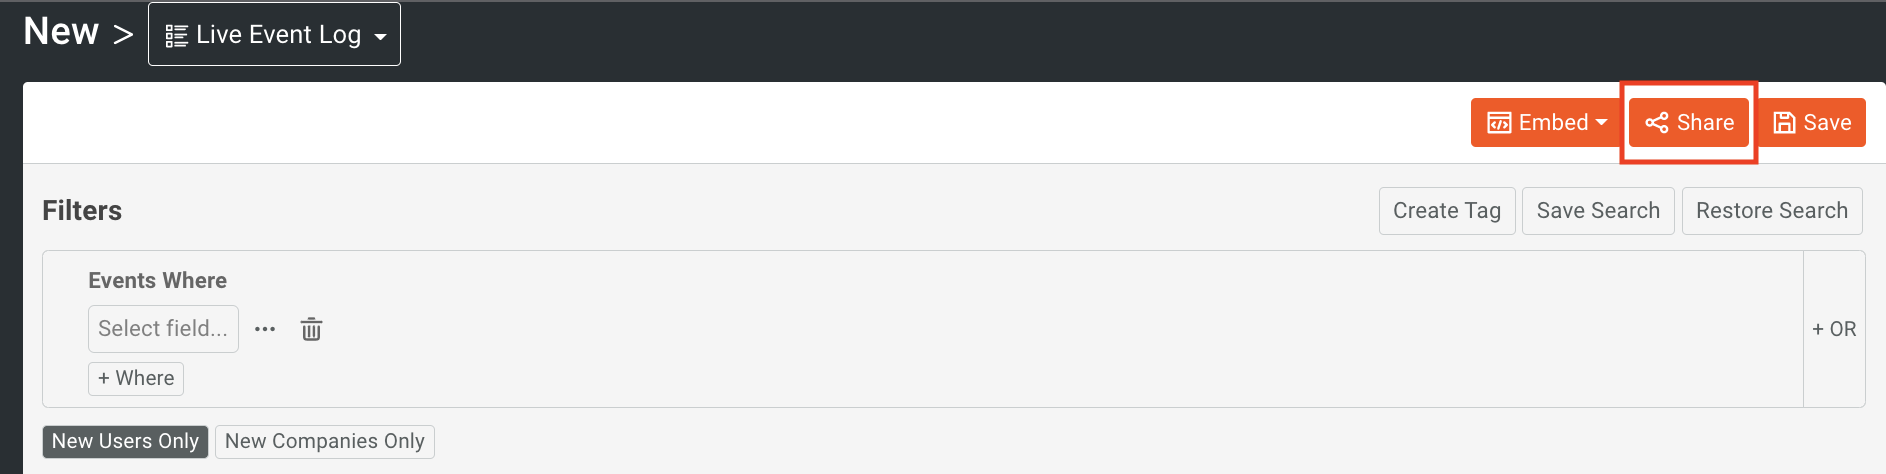
A Public Link can be used to securely share metrics with external parties or statically embed charts in an iFrame. A public link has a static filter that can not be changed. To create one, click on the Share button at the top of the Live Event Log screen.
In the modal that appears ensure that Public Link is selected.
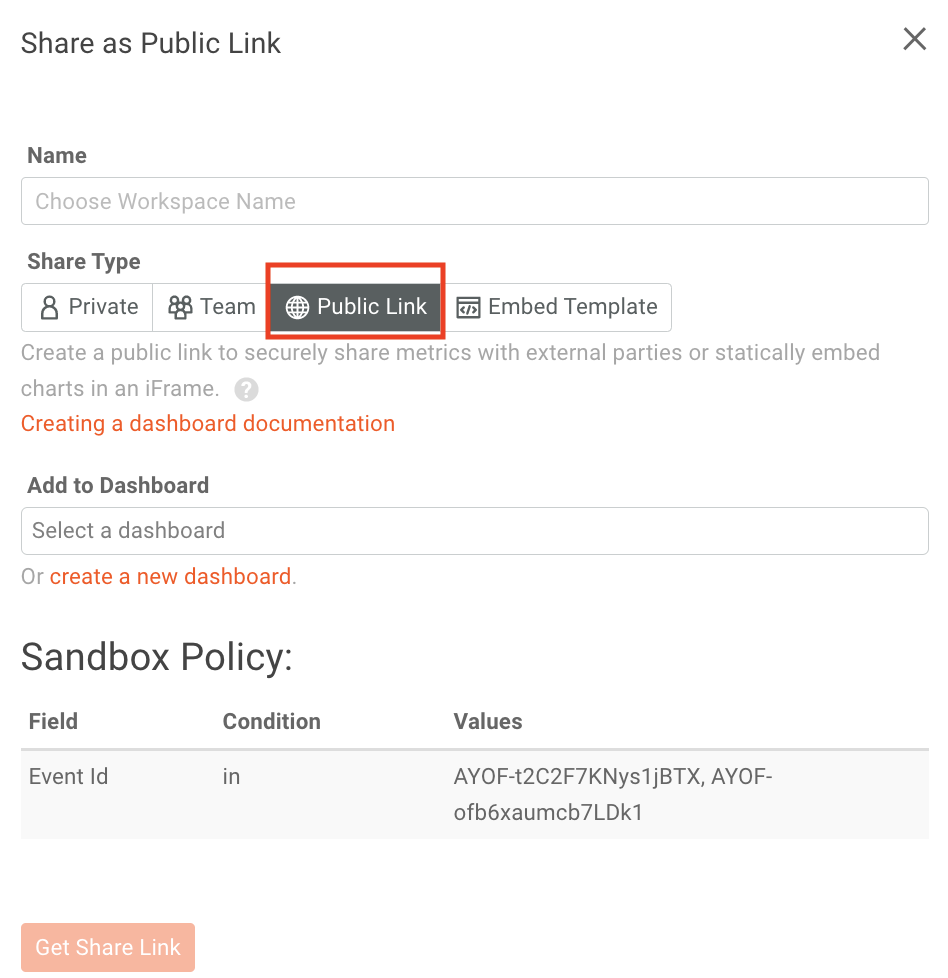
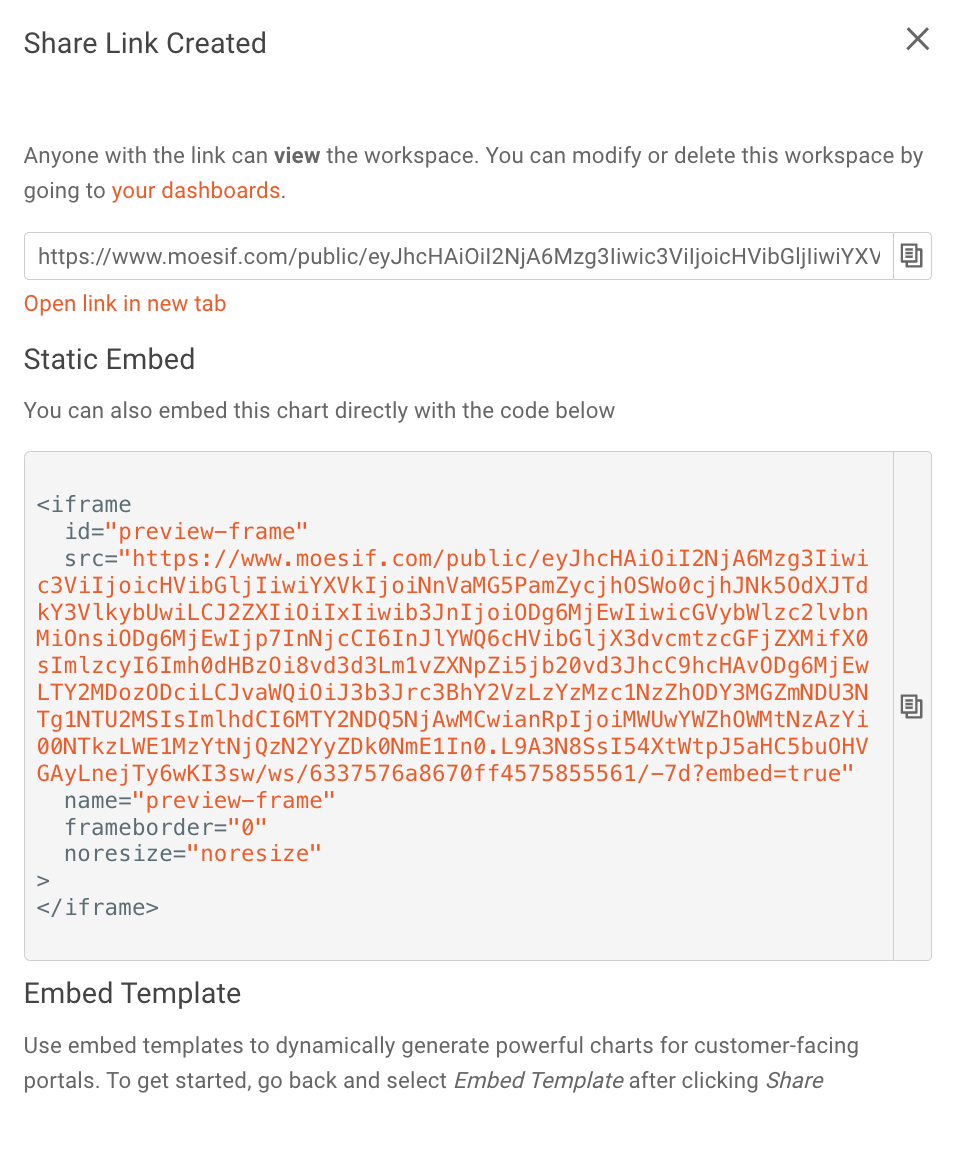
Grab the link or the static embed code from the modal.
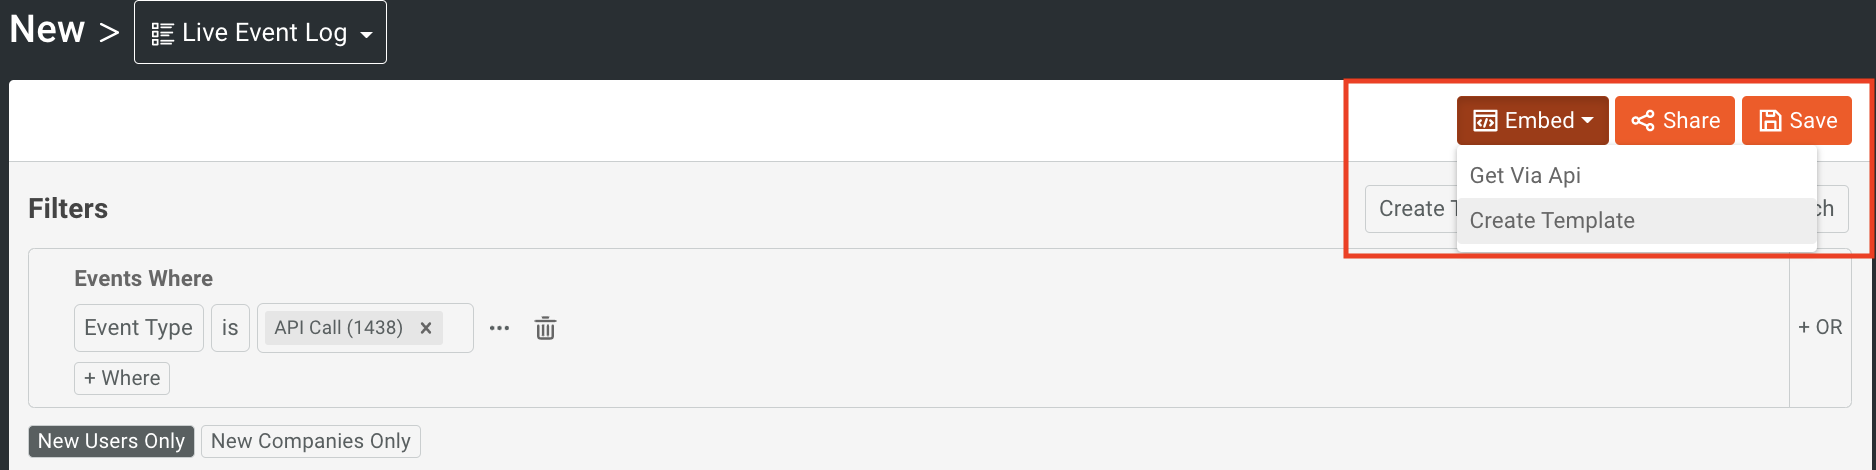
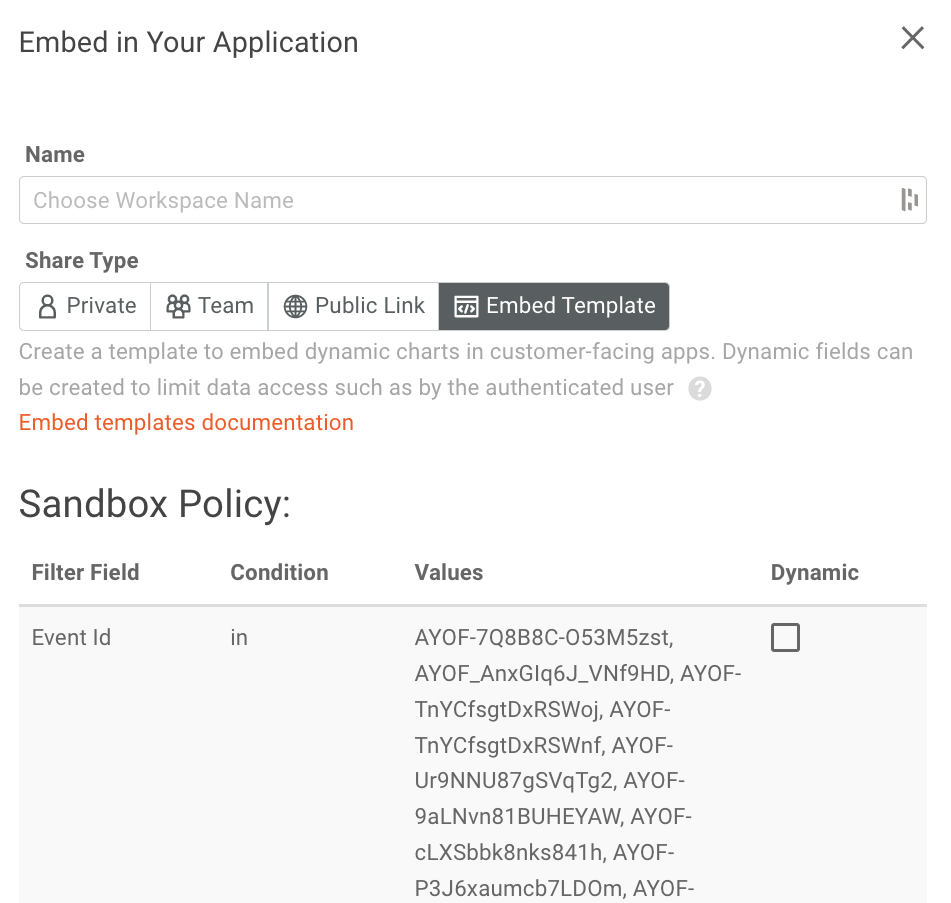
If you’d like to allow the user to adjust some filters, you can use an Embedded Template. This feature allows you to embed dynamic charts in customer-facing apps. Dynamic fields, such as authenticated users, can be created to limit data access. To create one, click on the Embed button at the top of the Live Event Log screen and select Create Template.
Here you can add in your Sandbox Policy and then click Get Embed Code.
Now you can take the generated code and embed it into your application.

Try It Out
Moesif’s Live Event Log can be an incredibly useful tool for businesses and developers alike. We hope that this guide has given you a better understanding of how Moesif’s Live Event Log works and some of its most useful features. Whether you just want an easy way to analyze every event that is occurring on your platform or are trying to troubleshoot your application and APIs, Live Event Log can be an indispensable tool. To try out Live Event Log for yourself, log in to Moesif or sign up today to get started.


Related Articles

API Strategy
Leveraging AI For a Better API Strategy
Learn how to leverage AI to build and fortify your API strategy. Improve design, governance, documentation, and align APIs with business outcomes.
API Strategy
The 5 Best Mixpanel Alternatives of 2025
Learn about the best Mixpanel alternatives to determine the right analytics solution for your use case.

API Development
How to Leverage Moesif Effectively for API Observability
Effectively leverage Moesif for API observability through best practices for integration, event enrichment, custom actions, and engineering workflow integrat...
API Strategy
How to Build an Internal Chargeback Model for Your API and AI Usage Using Moesif
Use Moesif to implement internal chargebacks and enable precise API and AI cost attribution for better transparency and resource optimization.
