Display Moesif Reports Within Tableau
As a product leader, there’s no better way to show the value of your API platform then by graphically displaying key metics. If you’re already working with Tableau, it’s easy to extract key charts, or workspaces, from Moesif’s dashboards and insert them into your visualization platform.
The information from Moesif will be inserted into Tableau as a web page object. Web page objects are fully-functional web browser windows based on Microsoft’s IE and, as such, all buttons, links and navigation features within the window will operate just as a regular browser.
This guide will take you through the steps required to set up and display Moesif workspaces within your Tableau dashboard: it’s as easy as 1-2-3.
Step 1. Moesif’s Workspace Public Link
Within Moesif’s API Analytics Platform create a workspace of a metric you want to track.
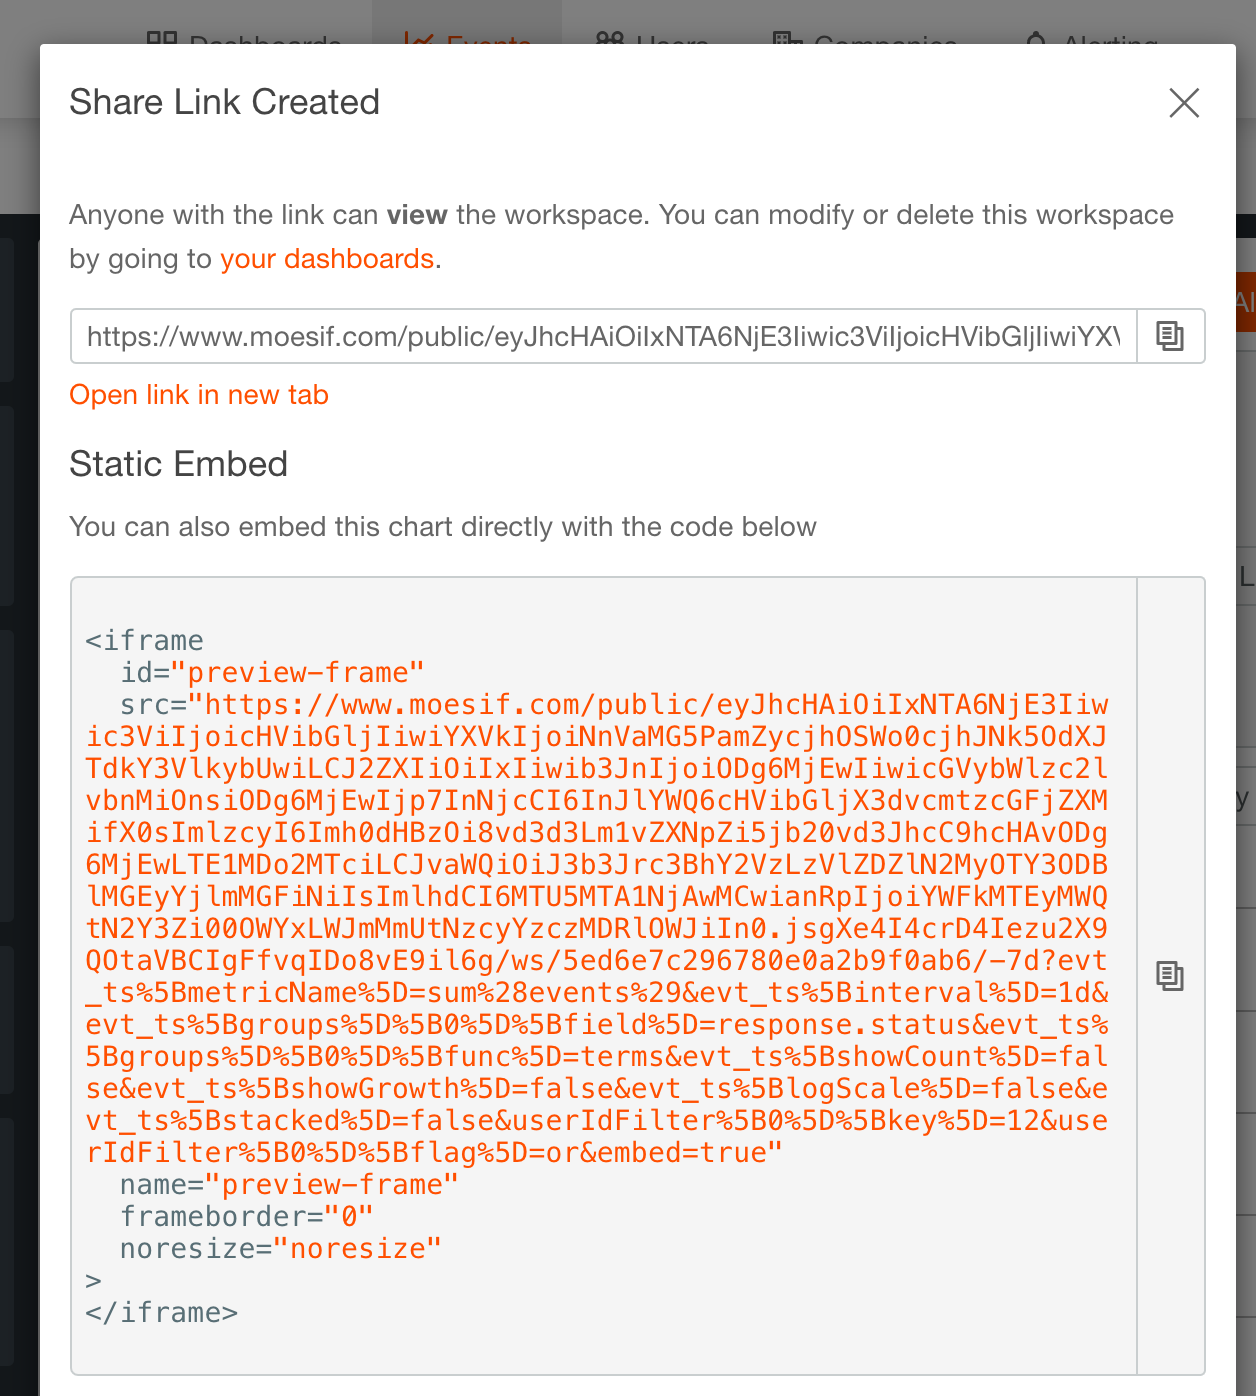
Save the workspace as a Public workspace.
We’re going to use the Share Link, as shown below, to embed the workspace directly within Tableau.
Step 2. Tableau’s Web Object
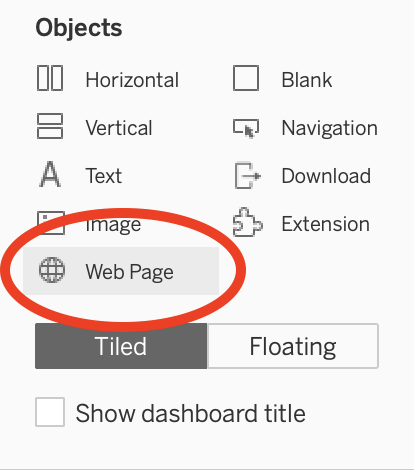
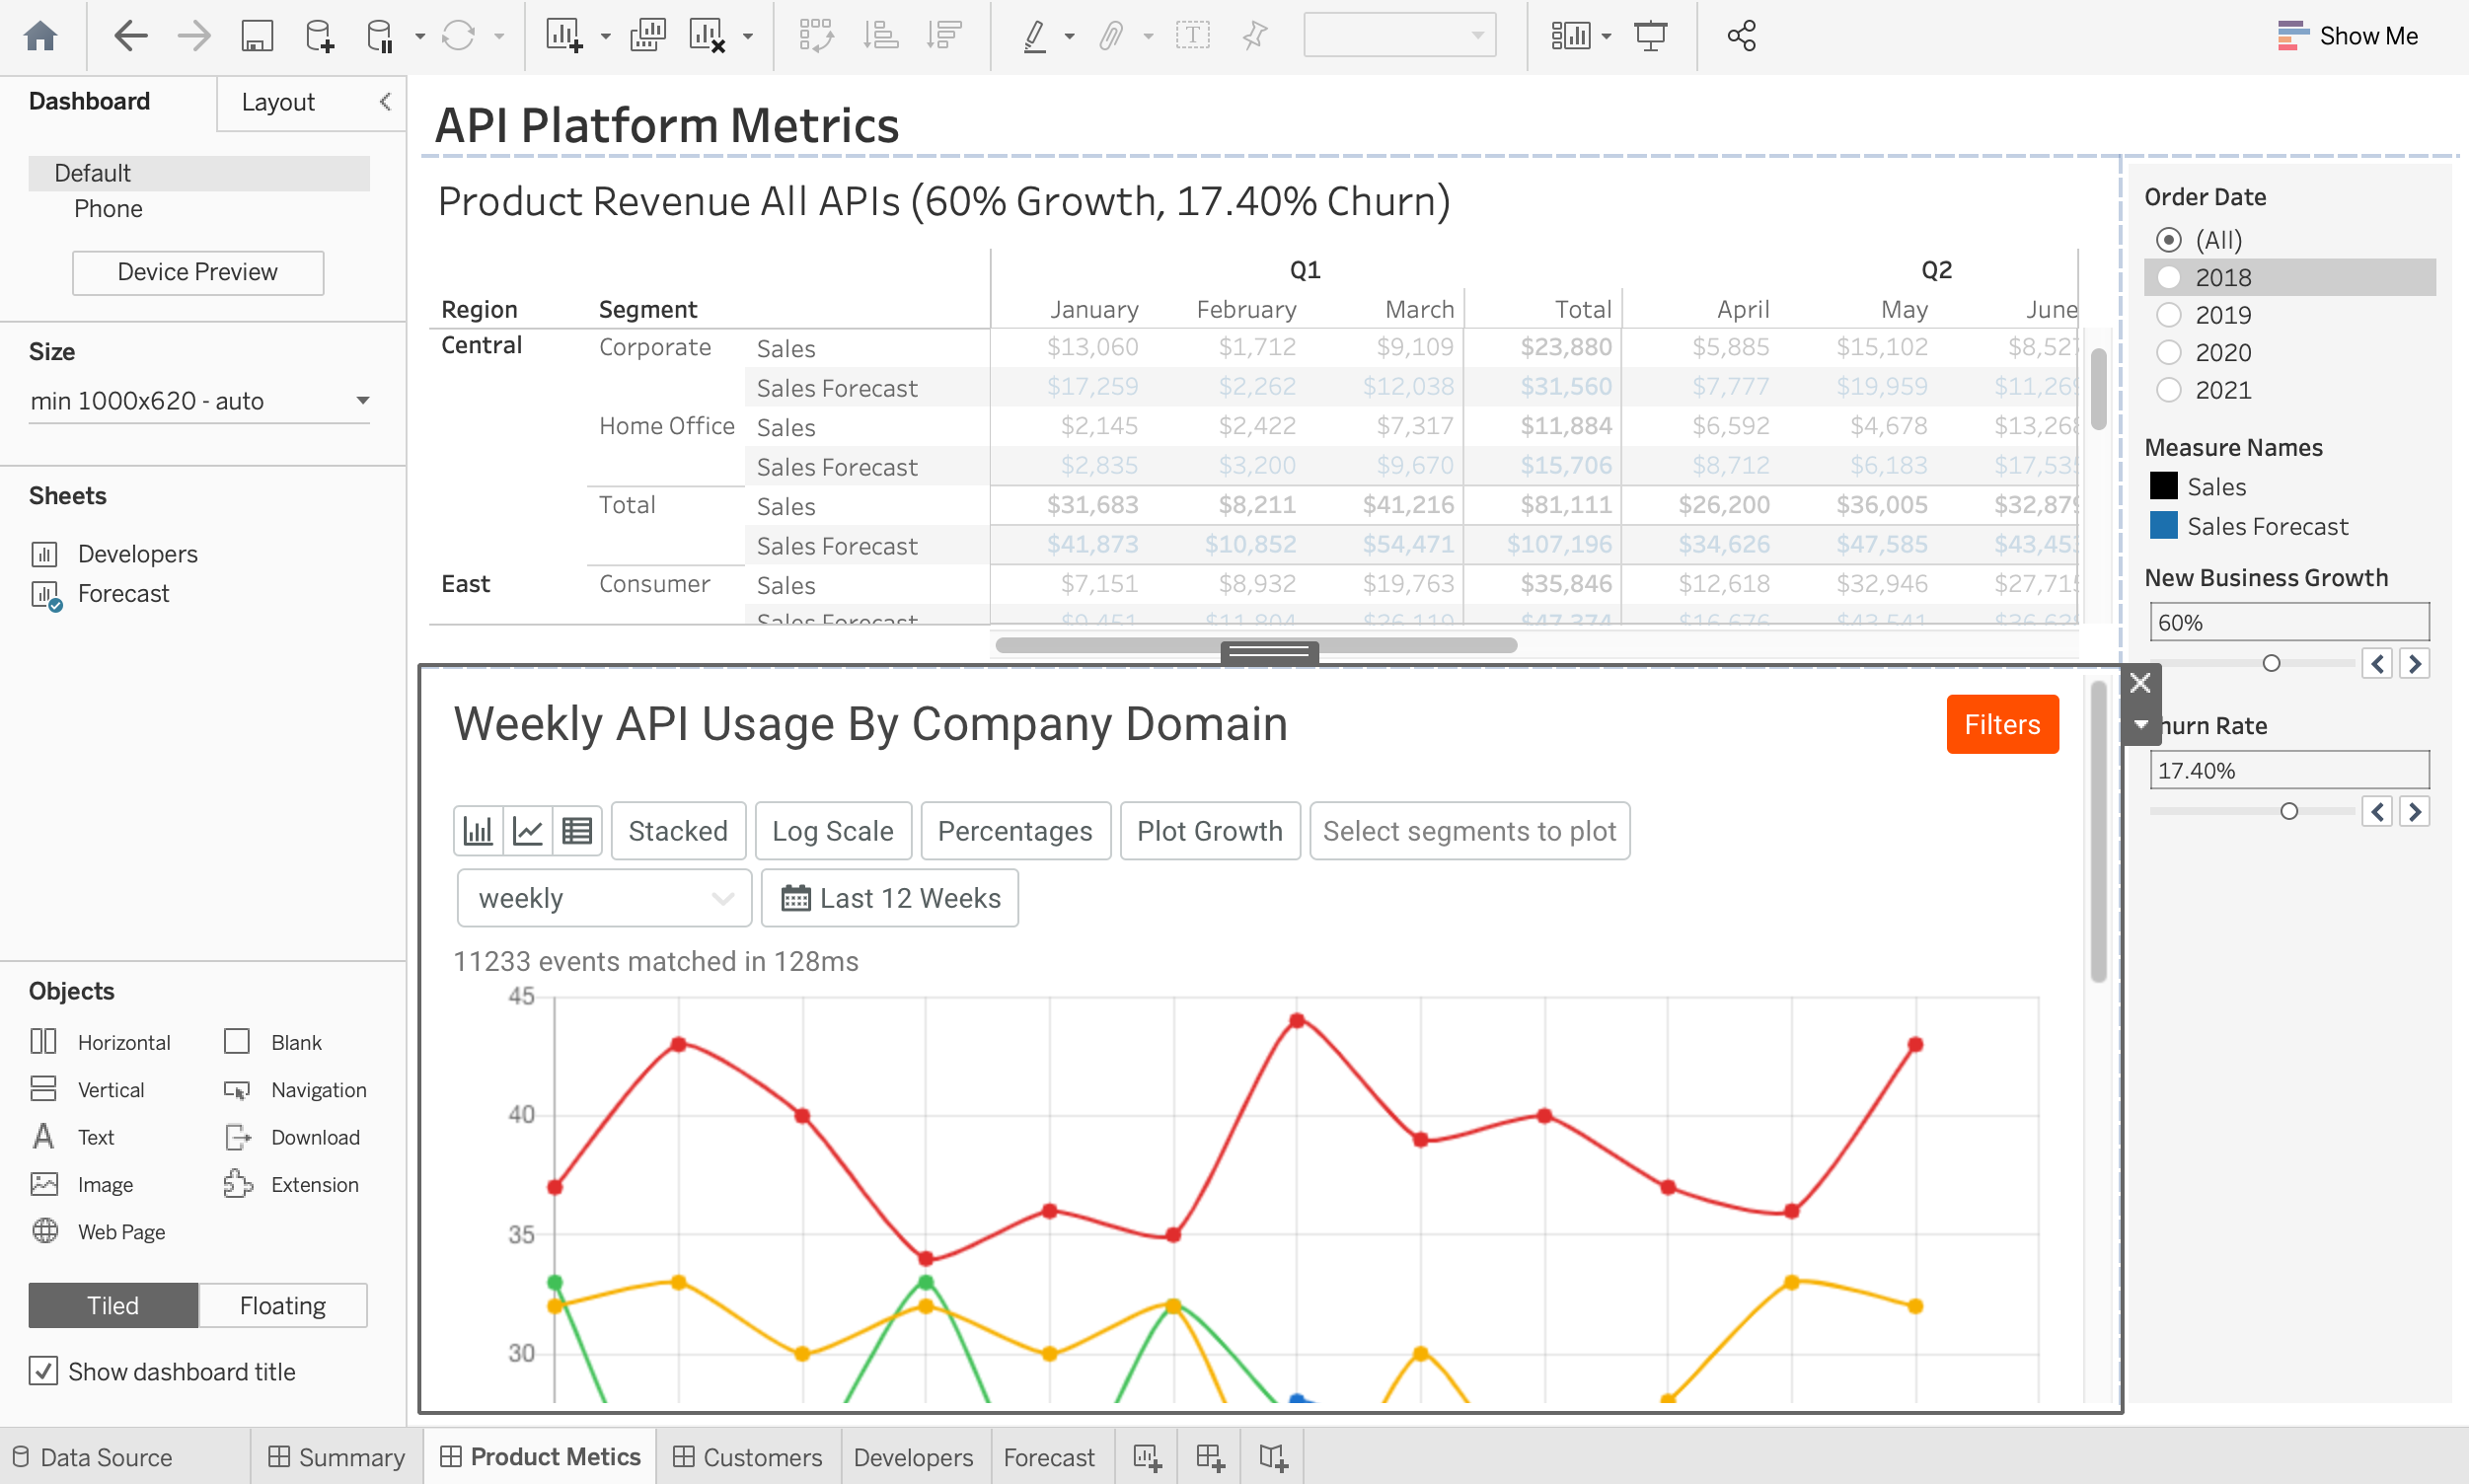
Once you’ve created your Tableau dashboard, you’ll need to insert a new web page object.
Click on the Web Page icon under Objects, as shown below, and drag it to the location on your dashboard where you want to insert the Moesif workspace.
When you release the icon, a pop up appears. Enter the URL from Share Link in Step 1.
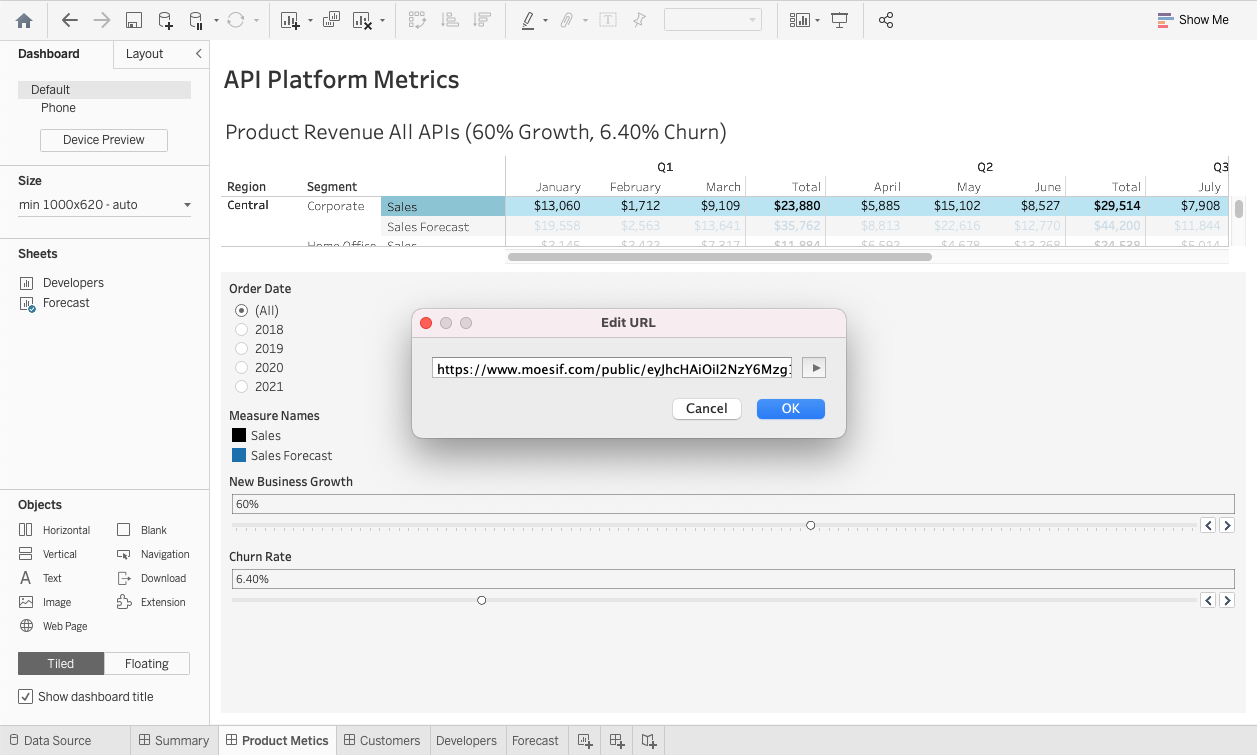
The Moesif workspace should appear. Resize the tiles in your Tableau dashboard to show your new metric in its best light.
Step 3. Add More Workspaces
Repeat Steps 1 & 2 and populate your Tableau dashboard with key metrics from Moesif to showcase the value of your API platform.
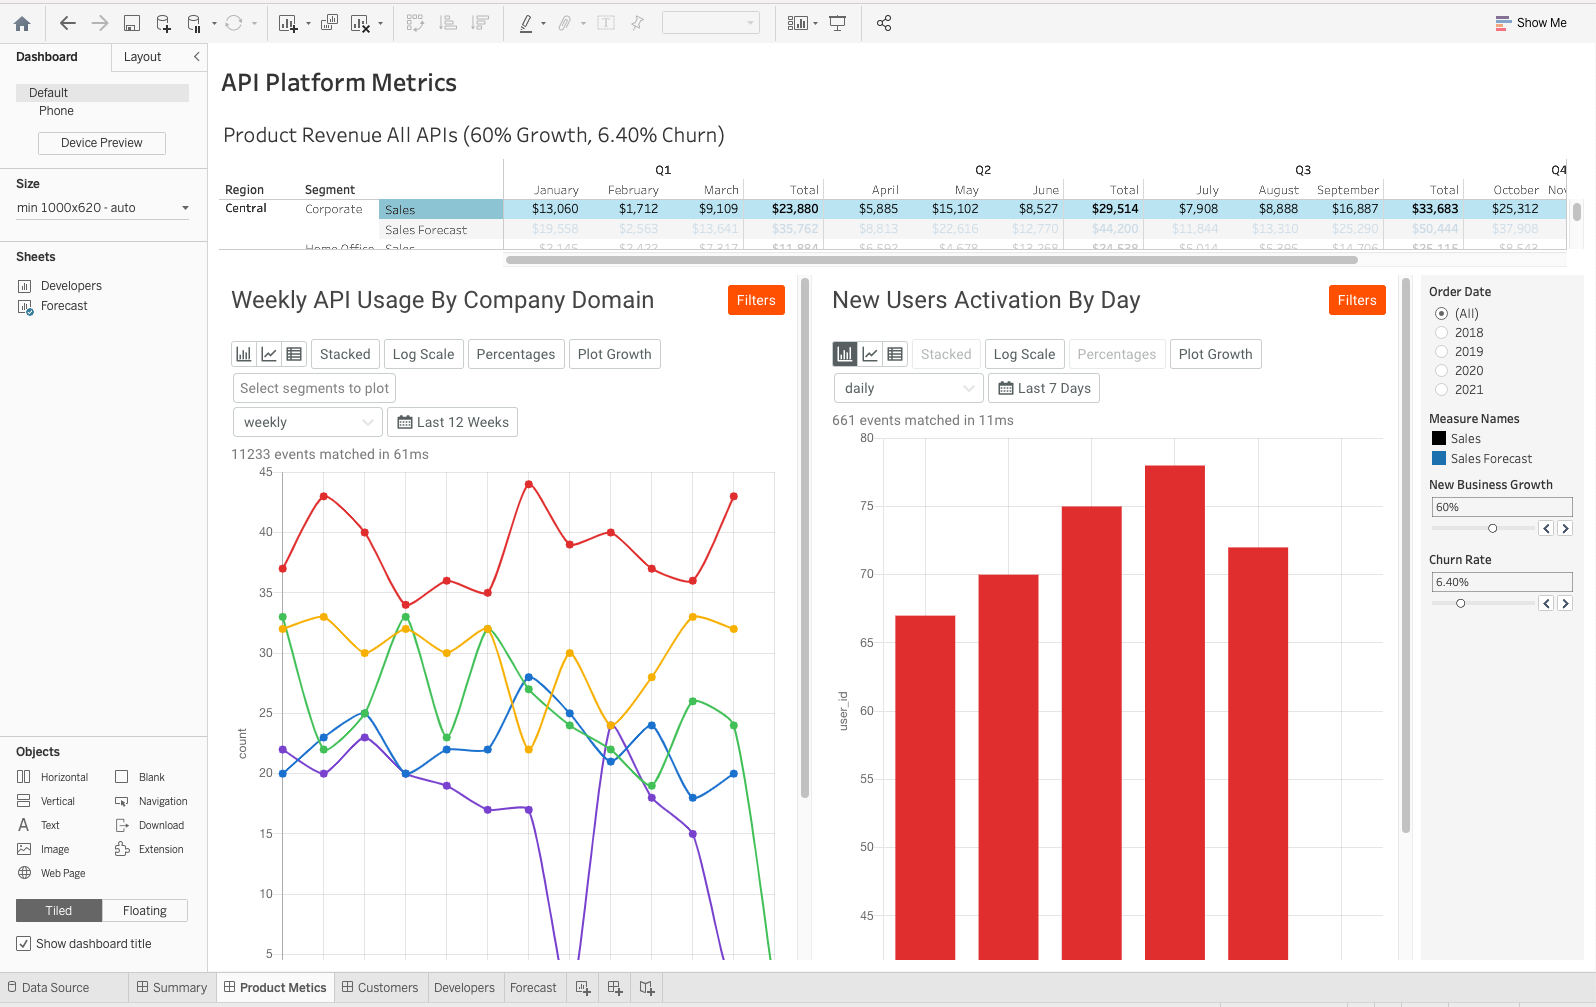
The example below shows the existing Tableau dashboard of a product manager, with two Moesif workspaces inserted:
- Weekly API usage grouped by company domain
- Newly activated customers
Easily Visualize Key API Product Metrics in Tableau
The data and analytics stack has become a key part of your enterprise solution. Tableau is a popular product to visualize data from your data warehouse. By using web page objects, you’re now able to bring in key API product metrics from Moesif without significant effort.
The combined solution offers a single point of reference for your decision making process.


Related Articles

API Strategy
Leveraging AI For a Better API Strategy
Learn how to leverage AI to build and fortify your API strategy. Improve design, governance, documentation, and align APIs with business outcomes.
API Strategy
The 5 Best Mixpanel Alternatives of 2025
Learn about the best Mixpanel alternatives to determine the right analytics solution for your use case.

API Development
How to Leverage Moesif Effectively for API Observability
Effectively leverage Moesif for API observability through best practices for integration, event enrichment, custom actions, and engineering workflow integrat...
API Strategy
How to Build an Internal Chargeback Model for Your API and AI Usage Using Moesif
Use Moesif to implement internal chargebacks and enable precise API and AI cost attribution for better transparency and resource optimization.
