User-Centric API Metrics vs Infrastructure Metrics and how to choose the right analytics architecture and data store
In just a few short years, data-driven teams went from not enough data to drowning in a sea of metrics. Every action, reaction, and result can now be tracked, processed, and analyzed. However, a key question we’ve received is which metrics are important and which analytics architecture and data store is best suited for a particular analytics requirement.
For technical product and engineering teams, there are two flavors of metrics that are important:
- Infrastructure metrics like EPM (errors per minute)
- User-centric metrics like MAU (monthly active users) and session length
What are product metrics?
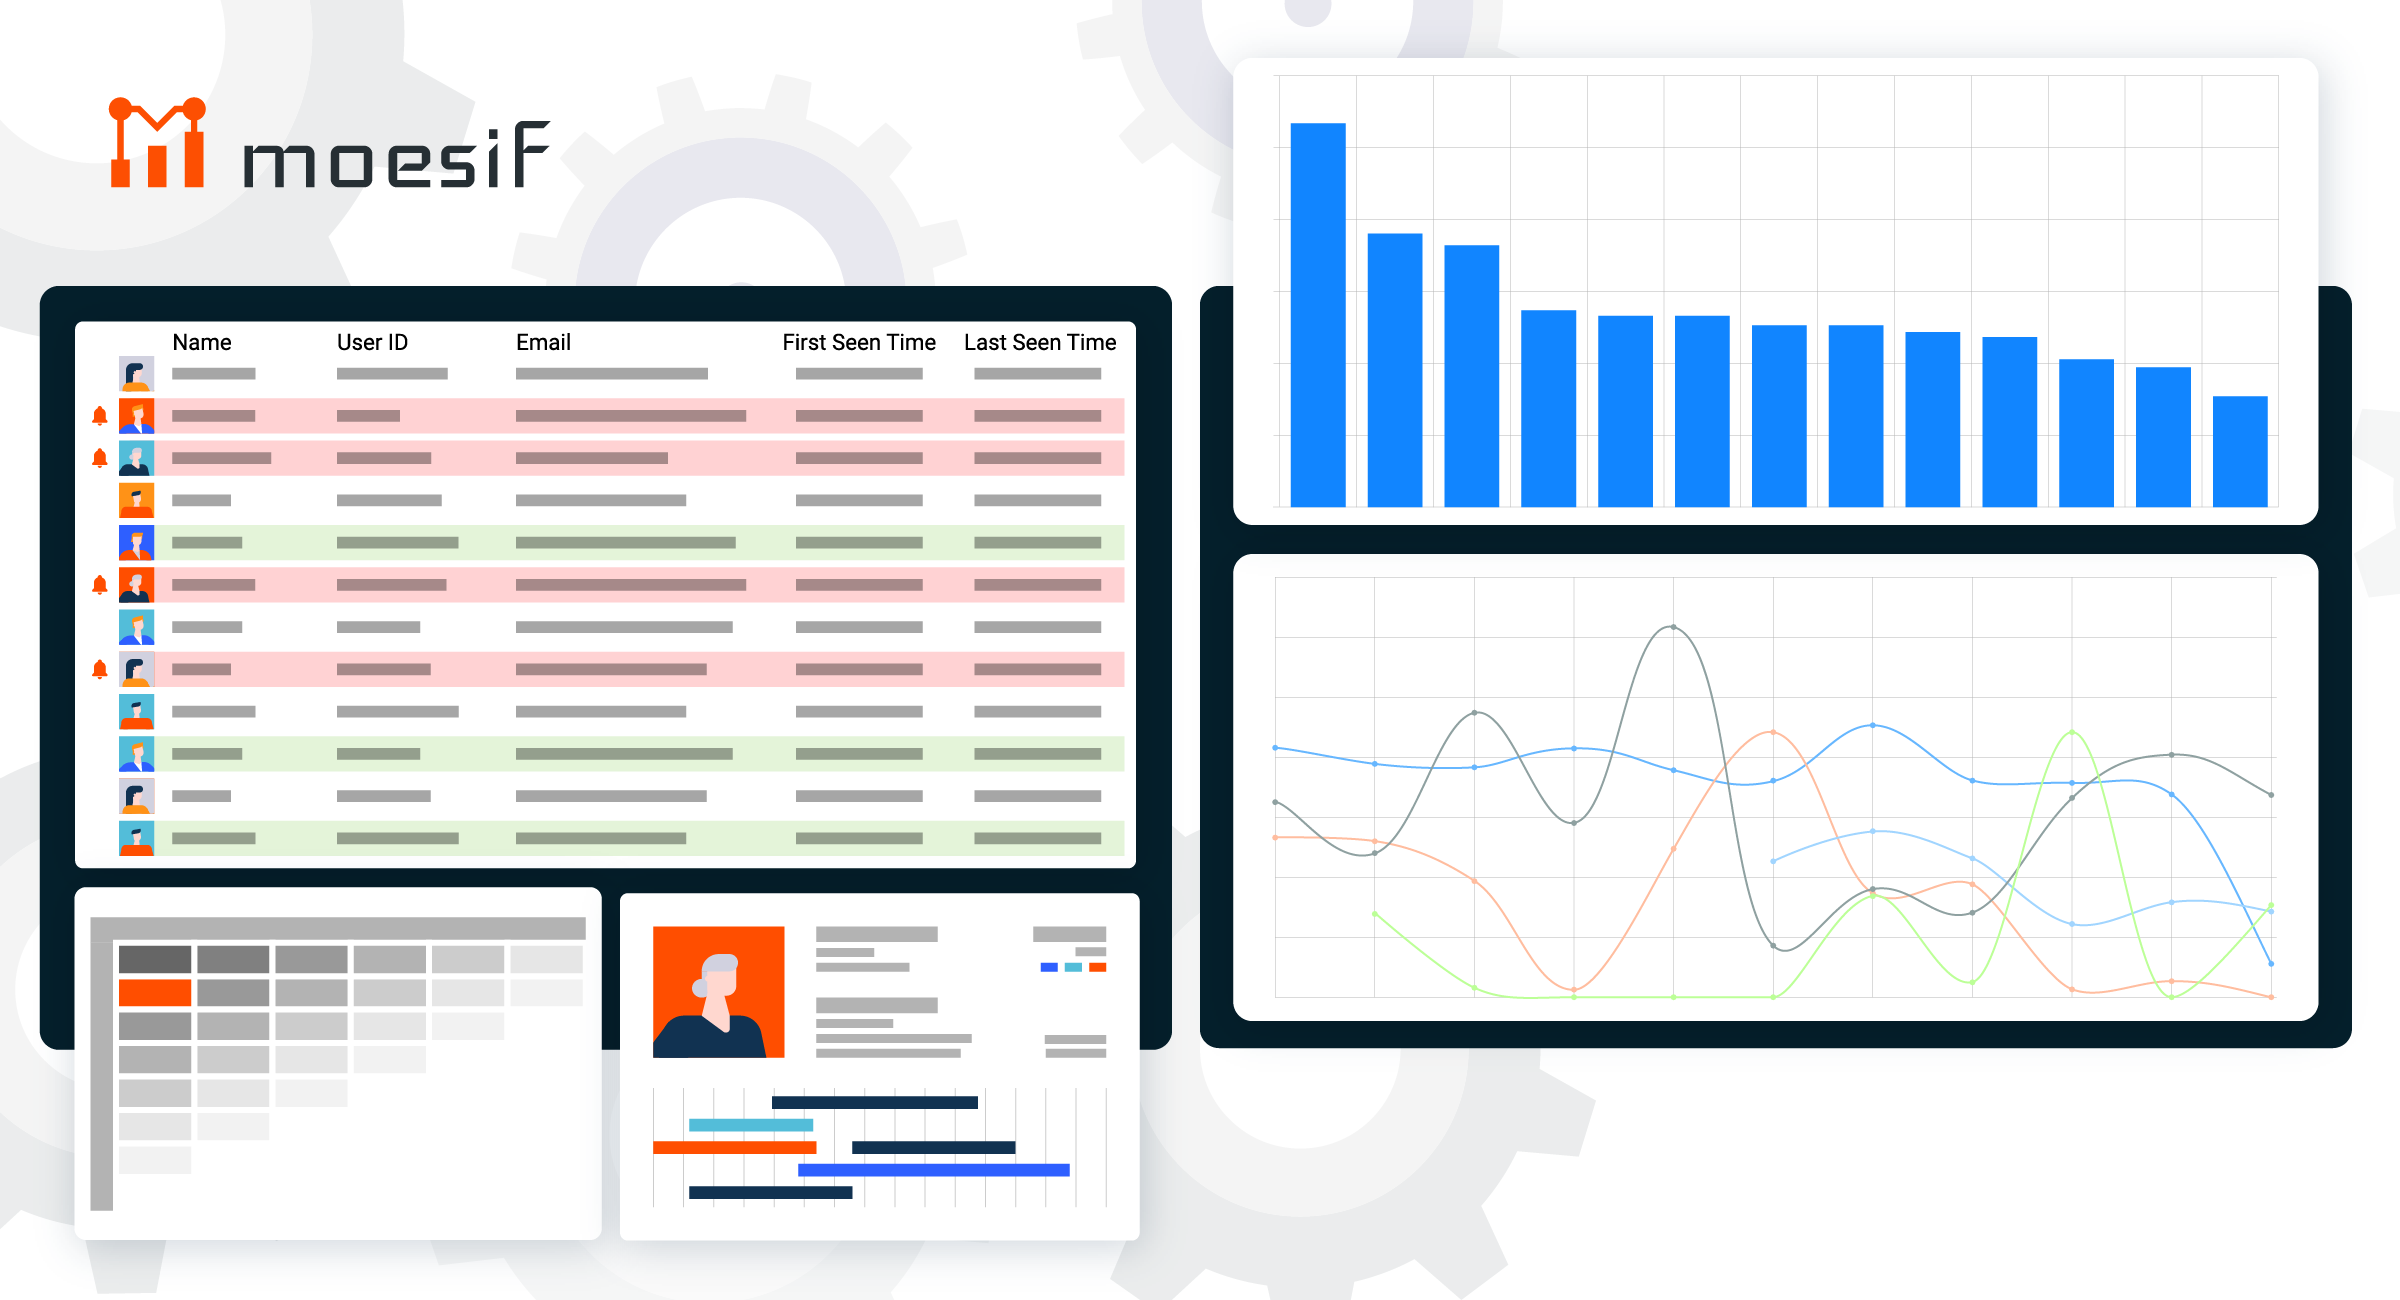
Product metrics such as API analytics or web analytics revolve around how users (or companies if your B2B) are experiencing your application. Also known as user behavioral analytics, every event or action can be linked back to an individual customer and behavioral trends can be discovered by looking at multiple events together.
By focusing on customer centric usage, we can find product issues such as why users stop using your API or which features or endpoints they engage with the most.
Product metric sacrifice sub-second visibility into backend infrastructure while providing far more visibility into a single user’s customer experience and behavior across many sessions and across users. A key differentiator for product analytics is that all event data is linked to a single user or company this enables the generation of aggregations like average session length or generating adoption funnels quickly. In addition, product metrics are usually rolled up to enable longer term trends such as month-over-month or quarter-over-quarter.
For product metrics, you’re less interested in what happened on one service in the last minute, rather you’re more interested in finding issues and longer term trends with your customer or product experience. A customer doesn’t care if a single request hits instance A or instance B, but they may stop using you’re service if a feature is confusing or no value created.
Tools like Moesif, Amplitude, and Mixpanel focus on product metrics and include:
- What is my monthly active users and users with the most API calls?
- Where do users drop off in my adoption funnel?
- Which users are most loyal? via cohort retention analysis
- Which users are having a bad customer experience or likely to churn?
- What is the average session length?
What are infrastructure metrics?
Infrastructure metrics don’t revolve around users. Instead, they revolve around trends in internal services over time. Rarely would you be tracking a user entity when looking at infrastructure metrics. Such tools include Datadog, New Relic, Kibana and other APM (Application Performance Monitoring) tools.
Infrastructure metrics include:
- How is my error rate and memory utilization trending over time?
- What happened in the last 5 minutes when a service failed?
- Which services are having communication issues via service maps
Because infrastructure metrics are usually stored in a time-based event store, you can have super fast filtering and metric aggregations since any time range or service/instance name filtering will reduce your data set significantly such as looking at only data created in last 24 hours or last hour.
Comparing time-based vs user-centric data models
If you’re building your own metrics system, the type of data model you choose will have large impacts on the type of analysis you can do with the data. As most engineers know, changing the data model after the fact is a lot of work and may require migrating old data.
Time-based data store
If you want to search and analyze logs for functional and performance monitoring, usually an append-only time-based data store is best. Since infrastructure metrics is mostly interested in what’s happening now, or what happened in the last 24 hours, leveraging a time-based model enables hot data such as last 24 hours to be stored on beefier noes whereas older data can be paged out or even deleted all together based on a retention policy. A huge benefit of time-based logs is that aggregations showing trends over time can be performed extremely fast since the aggregation is touching only a small subset of data. Any metric aggregation can be done in parallel via a simple map reduce which can be done via an internal database process or third party framework like Spark.
A downside of time-based metrics is it’s next to impossible to look at user behavioral trends by looking at multiple events together. Even the simplest query like finding the average session length will cripple time-based stores with out-of-memory errors as session length has to be derived from the first and last event for each user. This is because user id is a high-cardinality key and will require joining all events for each user in memory. More sophisticated analytics like funnel and cohort retention analysis cannot be done unless you wait for a long running job to load and transform the data over hours or days eliminating the advantages of self-serve interactive analytics.
User-centric data store
Instead of a time-based data store, user-centric data stores are organized by user records. All associated event data for a user is stored with that user.
So instead of a global event log, you have more of a two-level tree structure indexed on rollover period and user id and building user profiles where each user node is associated with their individual events. This makes performing calculations like average session length for all users in United States relatively trivial since all that needs to be done is filter for users located in the United States and then perform a simple map reduce function to calculate the average session length for each user. Once done, we can roll each user’s session length into a global one. There is no concern with the user id being high-cardinality.
Of course with user-centric data stores, a negative is that expiring data or moving specific time periods to beefier nodes is harder. While it is doable, the rollover period is longer such as every month or every year to avoid the join explosion from time-based indices whereas time-based can be rolled over each hour or day. This means even if you’re interested in only recent data like what happened in last hour, you’re still touching more data than a pure time-based approach. User-centric indices work best when you’re looking at week-over-week or month-over-month trends.
A second downside is building a pipeline to store data in a user-centric way is more complicated. Log aggregation pipelines like Logstash and Fluentd won’t be able to perform the shuffle and transform required to insert data in-order for the right user. Thus you’ll have to leverage a distributed cluster-computing framework like Spark or Hadoop to transform your data requiring much more engineering resources. One way to perform the shuffle is first store incoming events in a time-based data store and then run a Spark job. Keep in mind if you have a certain users that trigger a very large number of events, you can have hot spots reducing performance.


Related Articles

API Analytics and Monitoring
Monitoring MCP Security and Agent Behavior with Moesif
Monitor MCP server security and agent behavior with Moesif. Detect misuse, set alerts, and gain visibility into Model Context Protocol traffic.

API Strategy
Monetizing MCP (Model Context Protocol) Servers with Moesif
Learn how to monetize MCP server usage with Moesif. Track tool calls, enforce usage-based pricing, and meter agent access with full visibility.

API Development
Using Moesif for API Observability and Analytics in NGINX One
Enable API observability in NGINX One with Moesif to track latency, errors, and usage patterns through powerful API analytics and user-aware monitoring.

Podcasts
APIs Over IPAs 19: API Product Management with Emmanuel Paraskakis, Level 250
In this episode, Emmanuel Paraskakis of Level 250 joins to discuss the role and responsibilities of API product managers.