Debug Serverless AWS Lambda Functions locally with SAM CLI and VSCode
Why
When we build software, it’s always good to get a quick development cycle running. This setup can be a bit of a struggle with serverless development because the platforms that run our functions are in the cloud and uploading to test isn’t exactly what I would call quick.
Luckily most of the cloud providers supply us with tools to ease this pain, for example, the SAM CLI by Amazon Web Services. It’s a command-line tool to help with the creation of SAM-based applications.
In this article, we will learn how to set up a local debugging environment for our serverless applications with the SAM CLI.
What
We need the following software.
The SAM CLI is a command line tool written in Python that helps with creating and maintaining serverless backends. It uses AWS SAM, a dialect of AWS CloudFormation specially designed to handle serverless resources line AWS Lambda, API-Gateway and DynamoDB.
The AWS CLI is used to access AWS via the CLI; it is used by the SAM CLI in the background to modify resources inside our AWS account.
Docker lets us perform operating-system-level virtualization. With this technology, we can set up an environment inside a Docker container and run this container where ever Docker itself can run. The SAM CLI uses this technology to emulate the cloud environment of an AWS Lambda process on our machine.
VSCode is an Electron-based code editor written in TypeScript. It comes with a built-in debug UI which we will leverage to debug our serverless JavaScript code.
How
We have to install the AWS CLI, the AWS SAM CLI, and docker Docker. Then we have to create a new SAM project and link the VSCode debug UI to the Docker container which the SAM CLI is starting for us.
Setup
First, we have to install the AWS CLI, because the SAM CLI builds upon it.
$ curl "https://s3.amazonaws.com/aws-cli/awscli-bundle.zip" -o "awscli-bundle.zip"
$ unzip awscli-bundle.zip
$ ./awscli-bundle/install -b ~/bin/aws
The AWS CLI also needs to be configured with our AWS credentials.
$ aws configure
This command will ask about our IAM user credentials. If you don’t have an IAM user, AWS provides a tutorial for this
We need to install Docker and the AWS CLI and the SAM CLI, I will show an example installation on macOS.
There is a dmg archive for macOS installation we can download here
To install the SAM CLI on macOS, we need Homebrew. We can install it with the following command:
$ /usr/bin/ruby -e "$(curl -fsSL https://raw.githubusercontent.com/Homebrew/install/master/install)"
Then we tap the AWS tap, to get access to the AWS brew packages and install the aws-sam-cli package. This download can take a few minutes.
$ brew tap aws/tap
$ brew install aws-sam-cli
The next step is to init a SAM project with nodejs8.10 runtime. If we don’t use the --location command line parameter SAM CLI will download a hello world template and create a sam-app directory for it.
$ sam init --runtime nodejs8.10
$ cd sam-app
The crucial files created are hello-world/app.js which holds the code for our AWS Lambda function handler and event.json which holds an example event.
To test the only function this example project has, we can use the sam local invoke command:
$ sam local invoke HelloWorldFunction -e event.json
This command will run our HelloWorldFunction function code inside hello-world/app.js, pass the content of the event.json into it and give the following output at the end:
{"statusCode":200,"body":"{\"message\":\"hello world\"}"}
Now that the SAM CLI is up and running and we got our project set up, we have to link a debugger to it.
Linking the Debug UI
I will use the built-in debug UI of VSCode here.
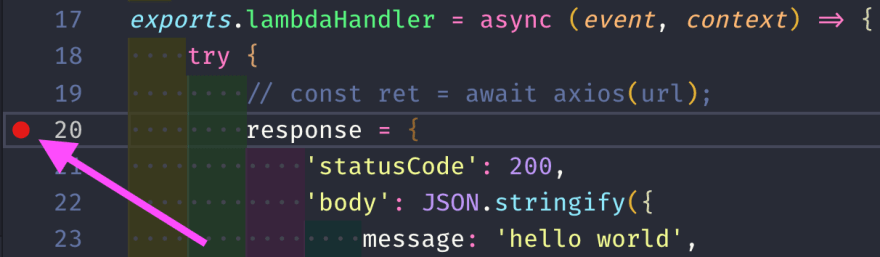
First, we have to set a breakpoint inside the file we want to debug. In our case, this is the hello-world/app.json.
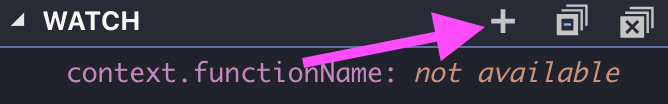
We can also add watch expressions. This expression helps to get values out of deeply nested objects right away, without the need to navigate to them in the VARIABLES tab on the side.
Next, we have to invoke the function locally, but with different CLI parameters.
The sam local invoke command takes a -d parameter to configure a debug port. If we use it, SAM CLI will wait until a debugger is connected to that port before it starts running our code.
If we run the command like this:
$ sam local invoke -d 9999 -e event.json HelloWorldFunction
We will get an output that tells us a debugger is listening:
Debugger listening on ws://0.0.0.0:9999/a47891d0-d0d3-419e-8123-caf8baf4fbbc
Now that we have a waiting debug process, we can attach our VSCode debug-UI to it.
For this, we have to create a launch configuration.
Launch configurations are VSCode specific. We have to write them inside a new file at .vscode/launch.json.
For our application it can look like this:
{
  "version": "0.2.0",
  "configurations": [
    {
      "name": "Attach to SAM CLI",
      "type": "node",
      "request": "attach",
      "address": "localhost",
      "port": 9999,
      "localRoot": "${workspaceRoot}/hello-world",
      "remoteRoot": "/var/task",
      "protocol": "inspector",
      "stopOnEntry": false
    }
  ]
}
The most important parts here are the port, type, localRoot and the protocol.
We ran the SAM CLI with -d 9999, so our port needs to be set accordingly in the launch config. We also want to debug a JavaScript/Node.js file with the inspector protocol that is in the hello-world directory of our project.
If our sam local invoke command is still running and listening for a debug client, we can now run our launch config in the debug-UI of VSCode.

If we click the run button, VSCode should attach itself to the SAM CLI process, which is indicated by a red info-bar at the bottom of VSCode.
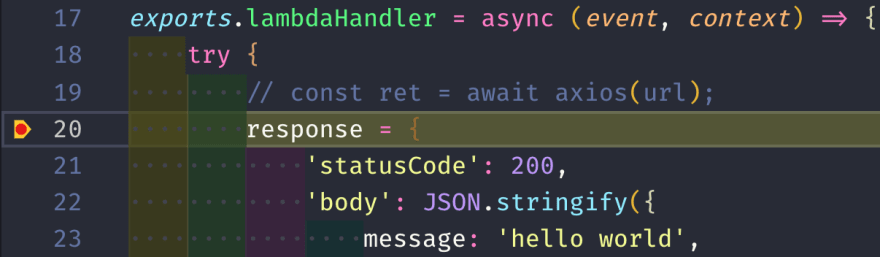
VSCode highlights the line with our breakpoint.
And the debugger sidebar in VSCode should show the currently scoped variables, like event and context.

Bonus: NPM Script
To streamline the whole process a little bit, we can also use an NPM script to run our SAM CLI command.
To make this work, we need to initialize an NPM project inside of our project directory.
$ npm init -y
Then open the new package.json and add a line to the scripts section.
"scripts": {
  "hello-world": "sam local invoke -d 9999 HelloWorldFunction -e "
},
This script runs the SAM CLI in debug mode and expects a path to a JSON event file.
So we can go from this:
$ sam local invoke -d 9999 HelloWorldFunction -e event.json
To to the much more concise:
$ npm run hello-world -- event.json
The -- ensures that the following event.json argument is passed to the SAM CLI and not to NPM.
Conclusion
The SAM CLI tool makes debugging, and testing of Lambda functions easy. It integrates with all popular IDEs and debug-UIs via a standard debug protocol so we can use the tools we like.
The fact that it uses Docker in the background relieves us from the tremendous burden that comes with the setup of testing and debugging environments and ensures that we end up with something that resembles the cloud in which our function will run at the end.


Related Articles

API Strategy
Leveraging AI For a Better API Strategy
Learn how to leverage AI to build and fortify your API strategy. Improve design, governance, documentation, and align APIs with business outcomes.
API Strategy
The 5 Best Mixpanel Alternatives of 2025
Learn about the best Mixpanel alternatives to determine the right analytics solution for your use case.

API Development
How to Leverage Moesif Effectively for API Observability
Effectively leverage Moesif for API observability through best practices for integration, event enrichment, custom actions, and engineering workflow integrat...
API Strategy
How to Build an Internal Chargeback Model for Your API and AI Usage Using Moesif
Use Moesif to implement internal chargebacks and enable precise API and AI cost attribution for better transparency and resource optimization.