Self-Service Custom API Dashboards Allow You to Easily Track and Share Key API Metrics
Last month we released our new dashboards feature. Now’s a good time to drive your story with a dashboard of your own.
Easily create with drag-and-drop - Clearly illustrate key metrics - Securely share between teams and partners
Tell a Story with Your Data
One of our fintech customers used to make decisions on pricing strategies, product changes and UI revisions by “logging hunches”, as they called it. They would get a feel for the market, and for the customer, maybe talk to selective users, and then make important changes.
Make sure that you move forward with data
Once they integrated Moesif, they started to make decisions based on actual data. Overnight they could easily track key API metrics, monitor the company’s KPIs and do deep dives to troubleshoot customer issues. They also discovered a lot of things that weren’t apparent before, such as vulnerabilities and compliance shortcomings, for things that they we were overseeing.
Our fintech product manager’s dashboard consisted of a collection of workspaces, including plots of Daily Active Users (DAU), the integration funnel, HTTP status requests, KYC product usage, most active users, recent API errors and so on. A representation of their dashboard is shown in Figure 1 below.
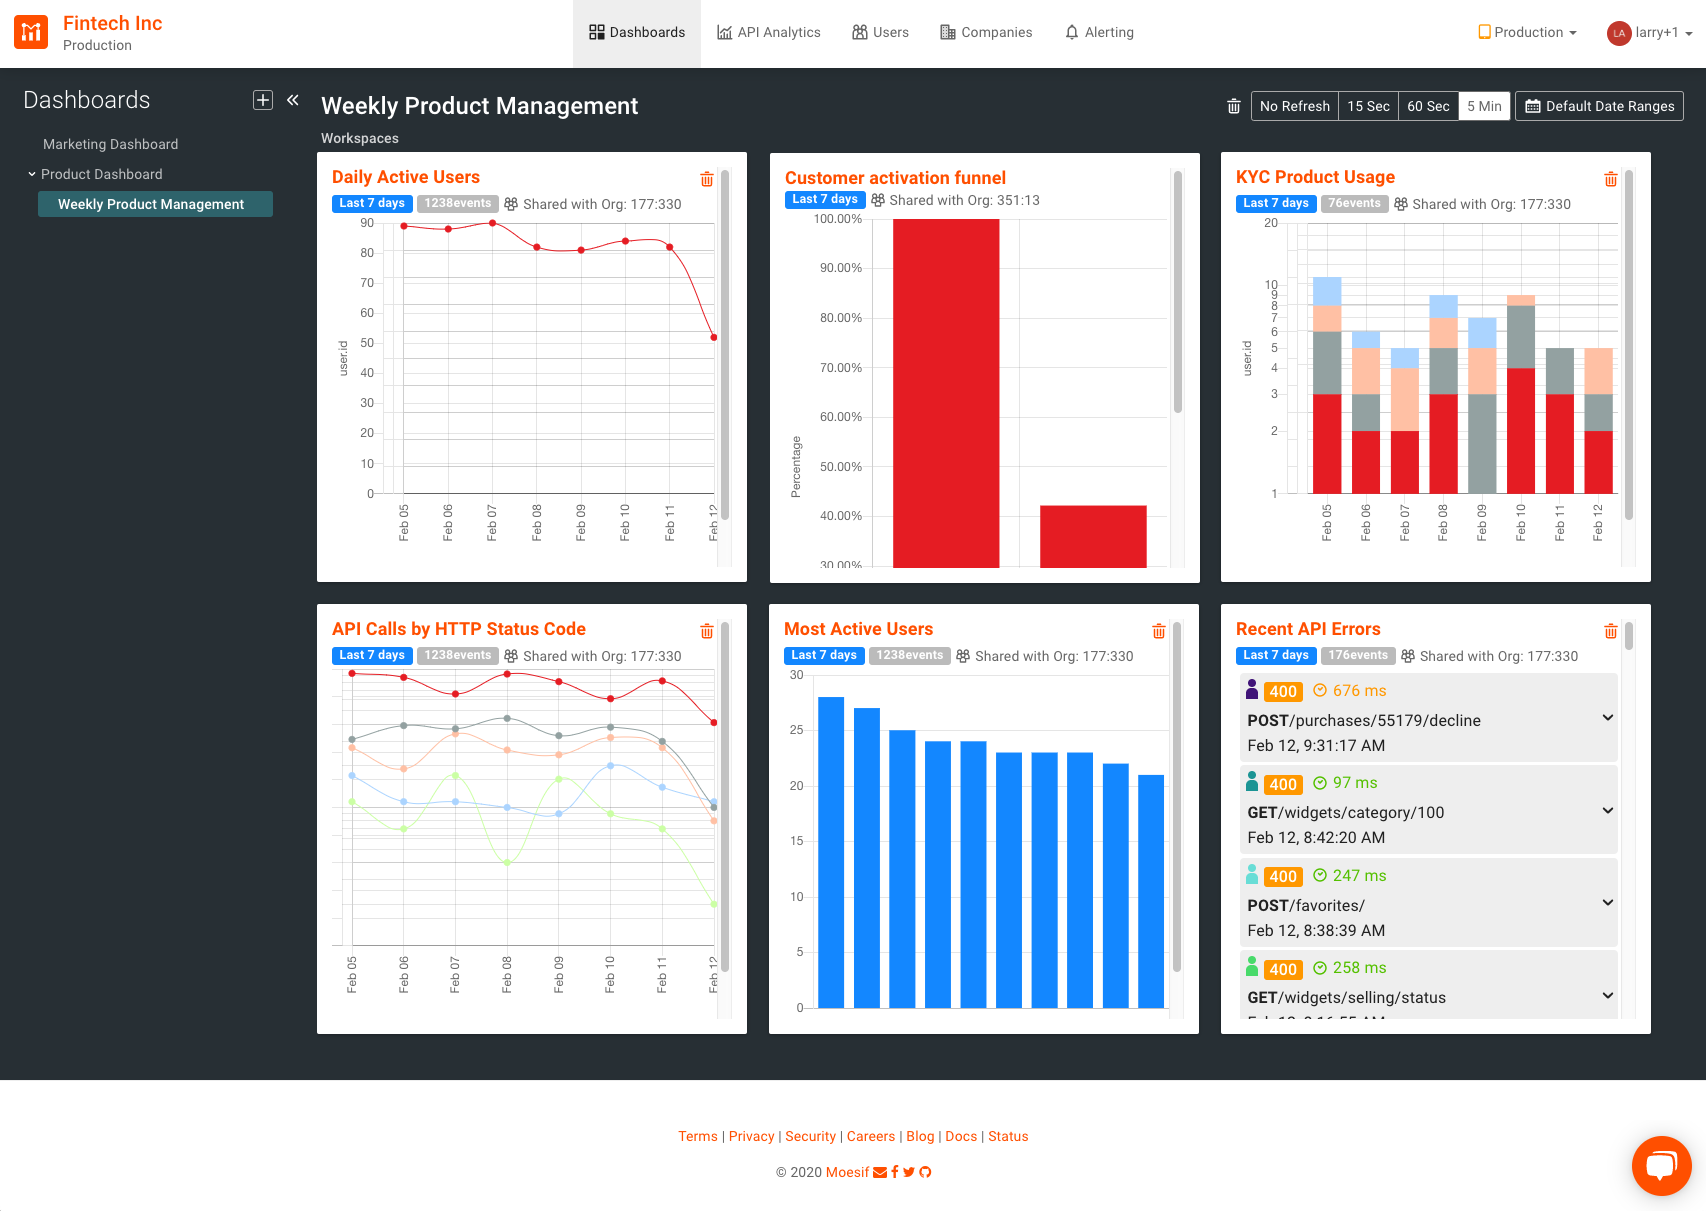
Figure 1. Representation of Fintech Customer’s Dashboard
Workspaces tell single stories, whereas dashboards give complete narratives of how the product’s performing. With our Fintech customer, the integration funnel workspace gave a summary of how customers joined the platform, signed up, confirmed their emails and then triggered API calls - the end-to-end life of their customer. By pairing that with their KYC product in a neighboring workspace, they were able to see how that product was performing - how many KYC users were on live versions, versus passing trial transactions. By bringing in HTTP statuses, the amount of errors could be ascertained - 200 statues codes versus non 200 status codes. So in one dashboard they were able to see who their customers were, how they had integrated and what they were experiencing.
Creating Custom Dashboards
Workspaces and Dashboards
Analogous to Google Drive, Moesif’s dashboards can be thought of as folders in a drive, and the workspaces are documents that populate the folder. Once a workspace is configured it can be saved into a dashboard as shown in Figure 2.
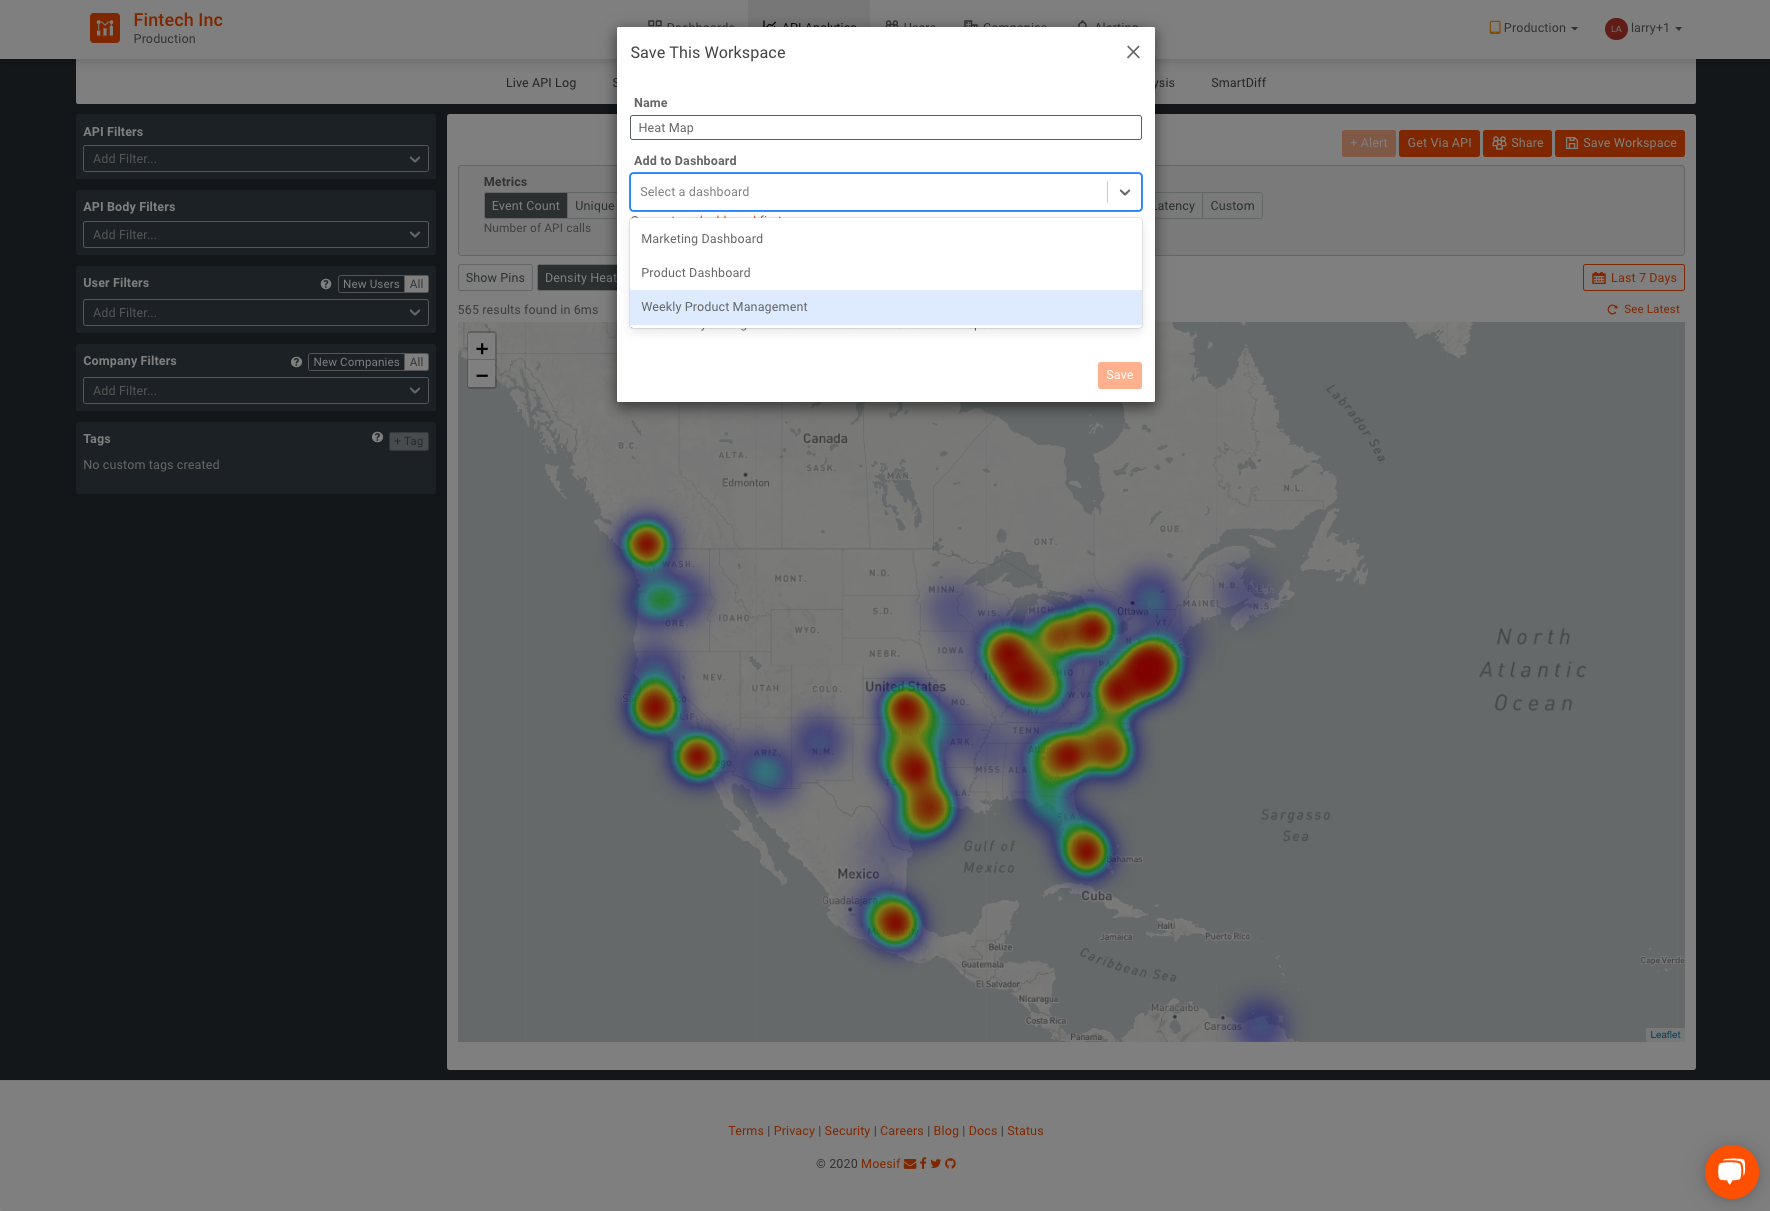
Figure 2. Saving a Workspace Into a Dashboard
By saving multiple workspaces into a dashboard you can tie them to one another, and design your narrative.
Arranging Dashboards
Workspaces can be repositioned within a dashboard through drag-and-drop. Create your workspaces the way you want and position them in the order that you want people to read them in.
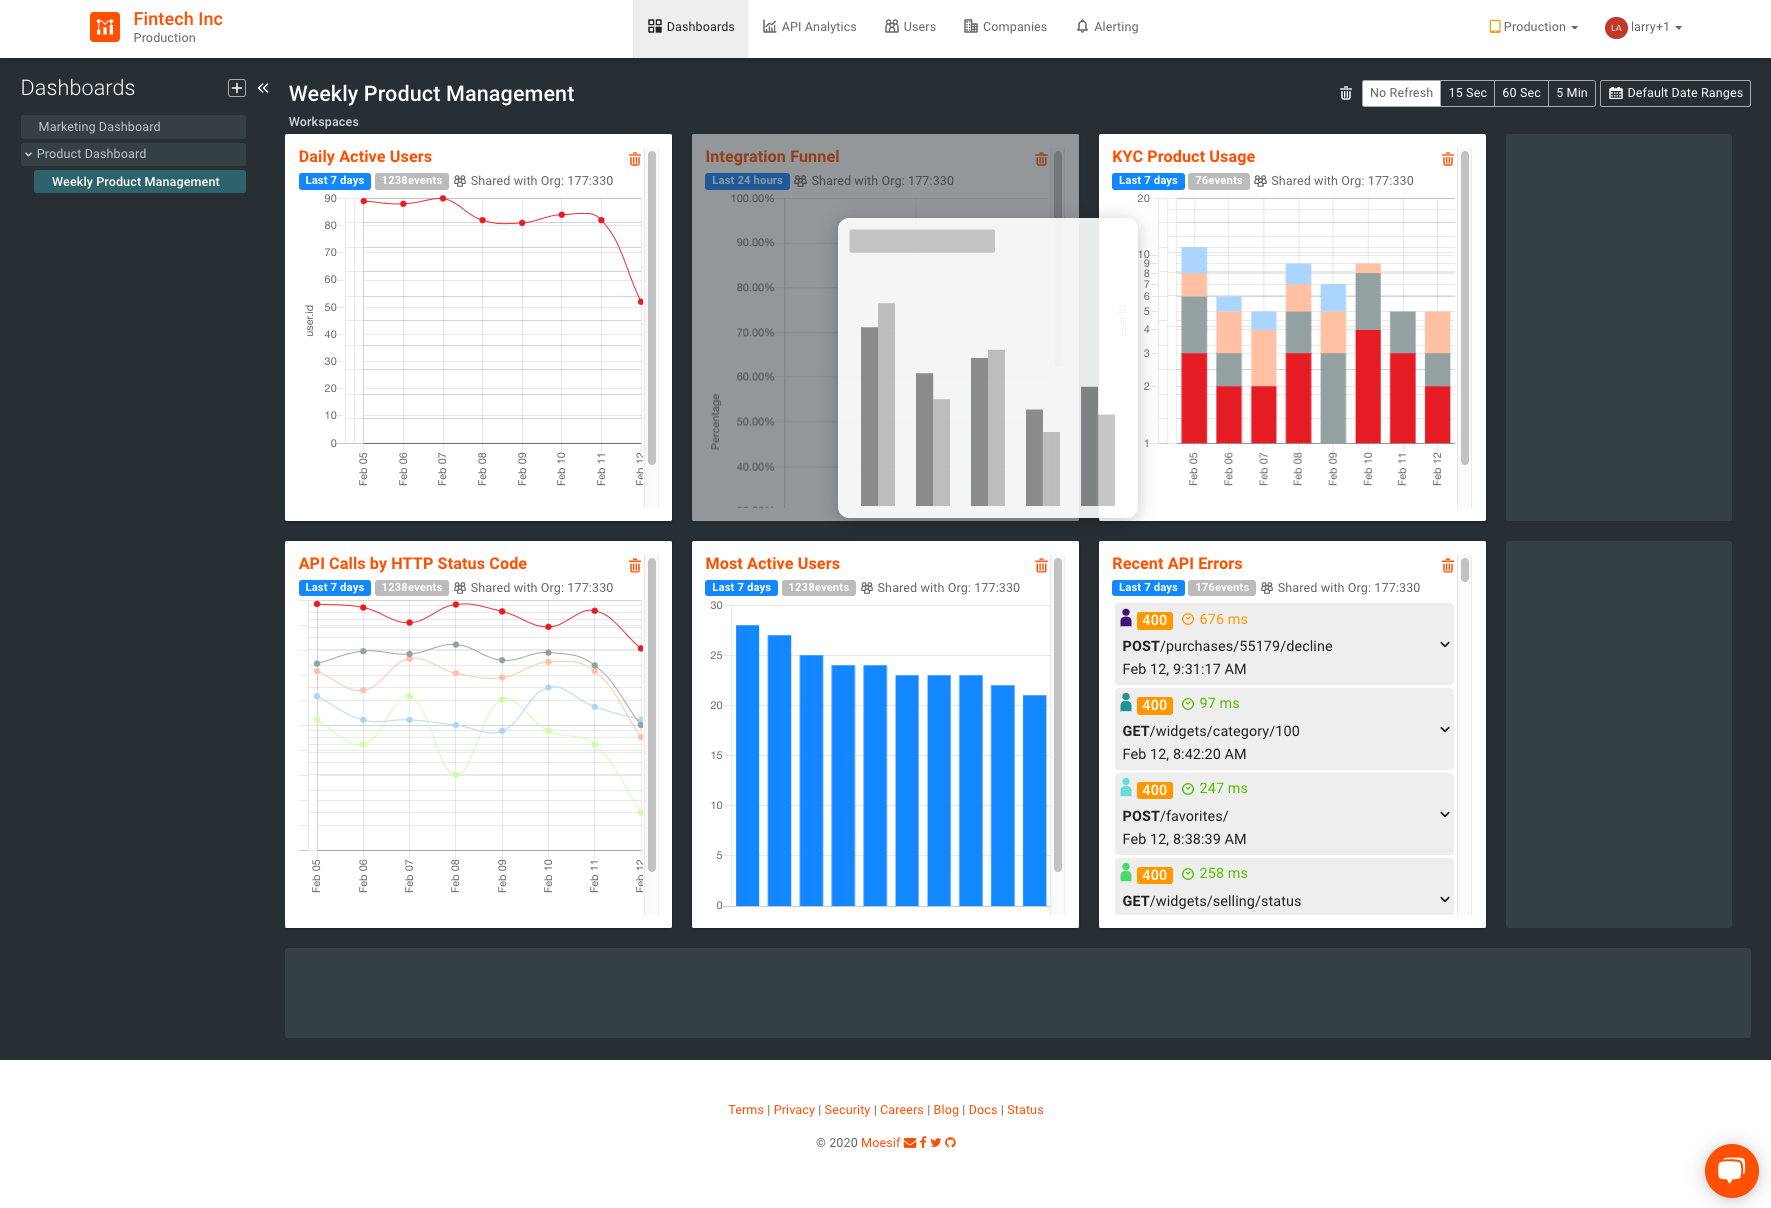
Figure 3. Rearrange Through Drag-and-Drop
Dashboard Hierarchy
Dashboards can be nested in hierarchies of up to three levels deep. Child dashboards can be created by simply dragging the name of the child dashboard to nest under the parent as shown in Figure 4.
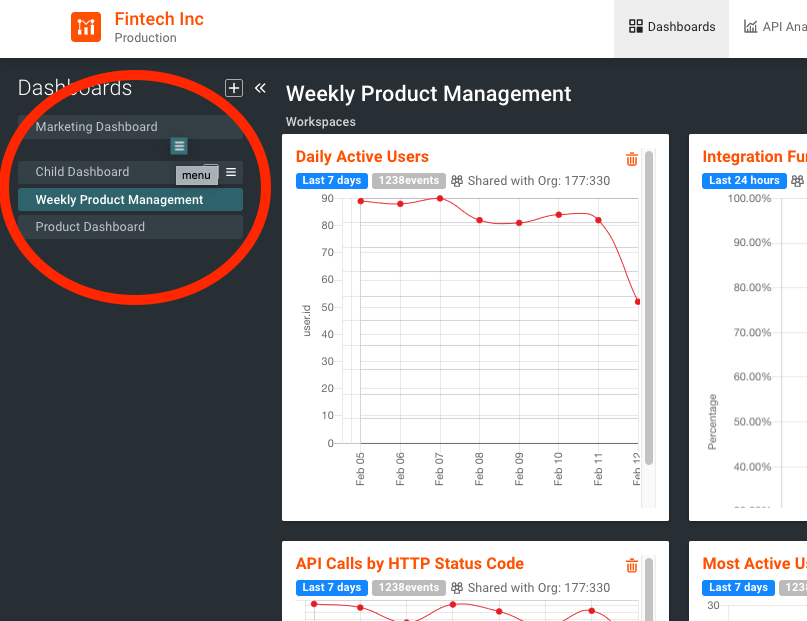
Figure 4. Hierarchies of Dashboards
Sharing Dashboards and Workspaces
Create once. Share many.
Once you’ve configured your daily or weekly dashboard, sharing it with colleagues is a snap. When you need to report to management for the month or the quarter, you’re able to just walk your daily/weekly setup without having to create a different dashboard.
Workspaces can be made private or shared across a team, organization or even with partners at external companies. For example, specific data can be shared with key customers during troubleshooting, using our custom link feature.
The sharing privileges of a workspace are set by clicking on the Share button and then selecting the option under “Shared With”, as shown in Figure 4 below. A workspace can be shared within your team, with the public through a unique link, or made private so that only you can view it. By configuring the filters, access can be further restricted to a specific user id, company id, time period, and more.
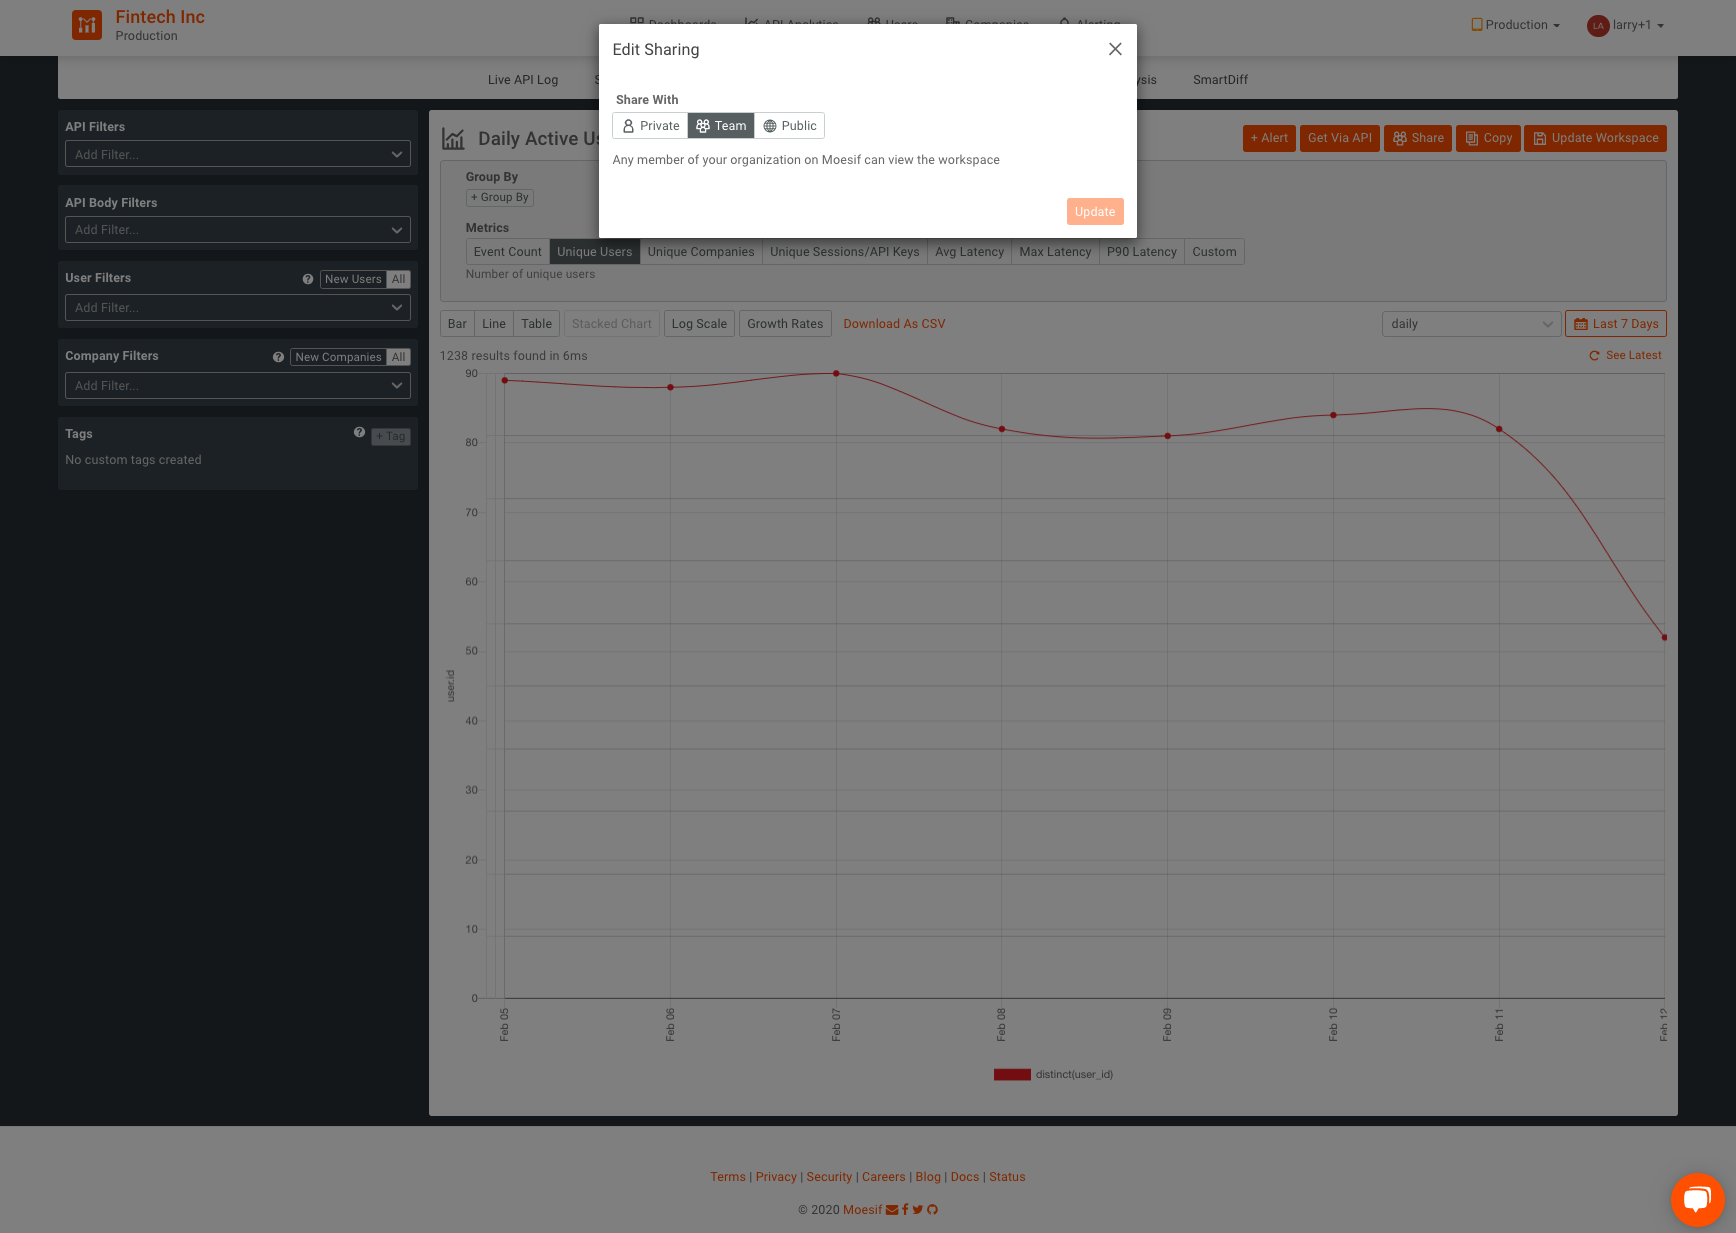
Figure 5. Sharing Options
Dashboards are automatically shared across your organization. Once a real-time dashboard is created, it’s shared with your team and managers so that everyone can stay on top of the KPIs that matter most.
Data Range and Refresh Rate
Dashboards update in real-time so you never have to worry about looking at stale data. Refresh rate can be set in the upper right hand corner to “No Refresh, 15 Sec, 60 Sec or 5 Min”, as shown in Figure 6. Also in the upper right hand corner, the date range can be universally set and then applied to workspaces in the dashboard.
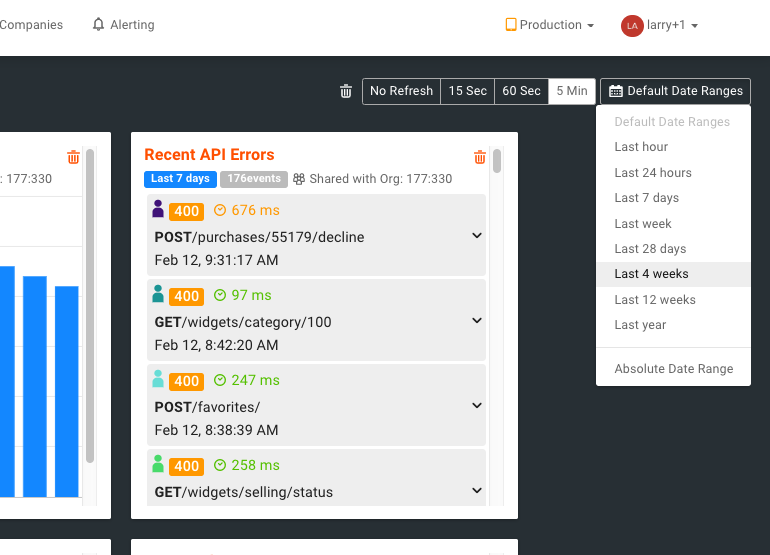
Figure 6. Setting Date Range and Refresh Rate
Top 3 Takeaways
Dashboards from Moesif allow you to tell stories with your data, share them with colleagues and partners, and stay on top of the KPIs that matter most. Deploy them today and make more informed decision.
One final word from our fintech product manager:
“When I look at my live products dashboard I can quickly identify trends. I can see countries by product, the type of requests that they’re doing, other requests by products and the type of errors that they’re getting for each one of those products. It’s awesome.”


Related Articles

API Strategy
Leveraging AI For a Better API Strategy
Learn how to leverage AI to build and fortify your API strategy. Improve design, governance, documentation, and align APIs with business outcomes.
API Strategy
The 5 Best Mixpanel Alternatives of 2025
Learn about the best Mixpanel alternatives to determine the right analytics solution for your use case.

API Development
How to Leverage Moesif Effectively for API Observability
Effectively leverage Moesif for API observability through best practices for integration, event enrichment, custom actions, and engineering workflow integrat...
API Strategy
How to Build an Internal Chargeback Model for Your API and AI Usage Using Moesif
Use Moesif to implement internal chargebacks and enable precise API and AI cost attribution for better transparency and resource optimization.