Add Analytics to your GraphQL API Server and Debug it with VSCode
GraphQL back-ends are a must-have in the API-industry right now.
GraphQL gives the front-end more control about what data the back-end sends over the wire. This feature alone can lead to traffic reductions, which save money and help with slow mobile connections.
Since GraphQL is better specified than REST, different GraphQL implementations match each other more than REST APIs, which makes them more approachable for front-end developers.
In this article, we will build a GraphQL back-end with Apollo-Server and create a custom analytics extension with Apollo-Servers’ experimental extension system.
Why
GraphQL adds more library code between a request and a response, so wouldn’t it be nice to get a bit more insight into what’s happening when someone requests data from our GraphQL back-end?
A custom extension can hook into the lifecycle of a GraphQL request and allows us to use this information within our analytics tools and services.
We can also leverage that custom extension code with a debugger like the one included in VSCode.
What
GraphQL is an alternative to REST. It’s a specification for a query language and an implementation of this language. It lets us define typed API endpoints and allows clients to request just the data they need.
Apollo Server is an implementation of the GraphQL server specification in JavaScript on the Node.js runtime.
Visual Studio Code, or short VSCode, is an extensible code editor written in JavaScript. It comes with an integrated debugger for Node.js applications.
How
For all this to work, we need Node.js and VSCode installed.
GraphQL Server Setup
To get a simple GraphQL server up and running, we have to create a new Node.js project.
$ mkdir api-server
$ cd api-server
$ npm init -y
We also need the apollo-server and graphql packages from NPM.
$ npm i apollo-server graphql
Now, let’s open the api-server project with VSCode so that we can implement our server.
$ code .
We need a new index.js file with the following code:
const { ApolloServer, gql } = require("apollo-server");

const typeDefs = gql`
  type Task {
    text: String
  }
  type Query {
    tasks: [Task]
  }
`;

const resolvers = {
  Query: {
    tasks: () => [
      { text: "Buy chocolate!" },
      { text: "Pay rent." },
      { text: "Wash dishes." }
    ]
  }
};

const server = new ApolloServer({ typeDefs, resolvers });

server
  .listen({ port: 9999 })
  .then(({ url }) => console.log(`Server running! ${url}`));
Let’s go through it step-by-step.
First, we require GraphQL packages, apollo-server to configure and run our GraphQL server and graphql to parse the schema-definition we will supply to apollo-server.
Then we define a simple schema that only allows querying a task list from our server, and we implement one resolver for the tasks query that sends an array of tasks back to the client.
When we start the server with the following command:
$ node .
It will allow us to send GraphQL queries via the GraphQL Playground, which is Apollos alternative UI to the default GraphiQL UI of Facebook’s reference implementation of a GraphQL server.
To access this UI, we need to open http://localhost:9999/graphql in a browser.
With the help of the GraphQL Playground, we can now query for the tasks to see if everything worked and the server is configured and set up correctly.
{
  tasks {
    text
  }
}
If all worked, we should receive this response:
{
  "data": {
    "tasks": [
      {
        "text": "Buy chocolate!"
      },
      {
        "text": "Pay rent."
      },
      {
        "text": "Wash dishes."
      }
    ]
  }
}
The next step is our analytics extension.
Adding the Analytics Extension
The apollo-server package comes with an experimental extension system that can hook into the different lifecycle events of their GraphQL server implementation.
We can leverage this to build a custom extension that receives data from apollo-server and uses it in some way. To keep this article simple, we will log every lifecycle stage of a request with our extension.
For this we create a new file analyticsExtension.js that has the following content:
class AnalyticsExtension {
  requestDidStart({ queryString, operationName, variables }) {
    console.time("requestDidStart");

    if (!!operationName) {
      console.log("OPERATION");
      console.log(operationName);
    }

    console.log("QUERY");
    console.log(queryString.trim());

    console.log("VARIABLES");
    console.log(variables);

    return (...errors) => {
      if (errors.length) {
        console.log("ERRORS");
        console.log(JSON.stringify(errors, null, 2));
      }
      console.timeEnd("requestDidStart");
    };
  }

  parsingDidStart() {
    console.time("parsingDidStart");
    return () => console.timeEnd("parsingDidStart");
  }

  validationDidStart() {
    console.time("validationDidStart");
    return () => console.timeEnd("validationDidStart");
  }

  executionDidStart() {
    console.time("executionDidStart");
    return () => console.timeEnd("executionDidStart");
  }

  willSendResponse(options) {
    console.log("willSendResponse");
    console.log(JSON.stringify(options.graphqlResponse, null, 2));
  }
}

module.exports = AnalyticsExtension;
An extension is a class that implements some or all of the following methods:
requestDidStartparsingDidStartvalidationDidStartexecutionDidStartwillSendResponse
All of these methods, but willSendResponse can return a callback function that will be called by apollo-server when their lifecycle stage is over. It uses a callback because these stages are asynchronous.
With this, we can define two callbacks per lifecycle stage.
In requestDidStart we log the query data we receive from the client and also set up some timers, so we can check how to log our server took to process the request.
In parsingDidStart, validationDidStart and executionDidStart we only setup timers to check how long each of these lifecycle stages took to execute.
In willSendResponse we log the response our GraphQL server produced.
All this data will be logged locally now, but we could also send it to an analytics and monitoring service like Moesif.
Now that we have defined our custom analytics extension, we have to hook it into our GraphQL server.
For this, we require the extension inside the index.js and pass a new instance to the extension array of the ApolloServer constructor.
const AnalyticsExtension = require("./analyticsExtension");

...

const server = new ApolloServer({
  typeDefs,
  resolvers,
  extensions: [() => new AnalyticsExtension()]
});

...
When we restart our server and send a query, we should now see our analytics output:
QUERY
{
  tasks {
    text
  }
}
VARIABLES
{}
executionDidStart: 0.252ms
willSendResponse
{
  "http": {
    "headers": {}
  },
  "data": {
    "tasks": [
      {
        "text": "Buy chocolate!"
      },
      {
        "text": "Pay rent."
      },
      {
        "text": "Wash dishes."
      }
    ]
  }
}
requestDidStart: 1.558ms
Every lifecycle method logs its timings and some also the data that was received or produced in its stage.
With our custom analytics extension in place, we can now go and debug our system.
Debug with VSCode
To set up the VSCode debugger, we need to create a .vscode/launch.json that tells VSCode how our server can be started.
{
  "version": "0.2.0",
  "configurations": [
    {
      "type": "node",
      "request": "launch",
      "name": "Debug Server",
      "program": "${workspaceFolder}/index.js"
    }
  ]
}
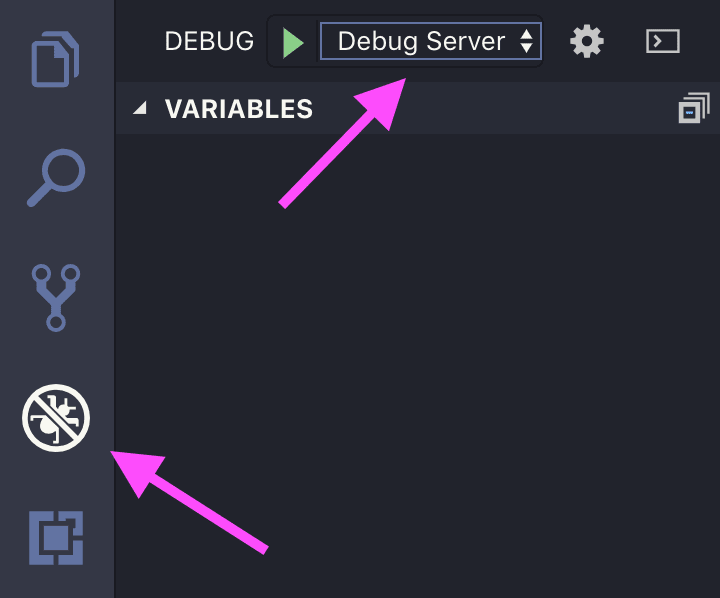
If we open the debug view in VSCode, we can now see our “Debug Server” launch-configuration in the drop-down in the top left.
If everything has been set up correctly, we can now sprinkle our resolvers functions inside index.js and the AnalyticsExtension lifecycle methods inside analyticsExtenion.js with breakpoints.
If we hit one of these breakpoints, we can use the debugging controls of VSCode to navigate our code. We could, for example, jump out of our own extension code and into the function that called our lifecycle method.
<img alt=”VSCode Breakpoint Screenshot” src=”https://blog.moesif.com/images/posts/technical/graphql-analytics/breakpoint.png width=”500”>
With this setup, we now have more control over our system locally and even when it runs somewhere in the cloud.
Conclusion
The GraphQL server implementation of Apollo offers us a very convenient method to integrate with monitoring services of our choice. The extension system supplies us with granular access to our requests lifecycle stages so we can measure what is happening in our back-end.
In tandem with VSCode’s debugger, we can use our custom extensions code to get a better understanding of the code-paths our server takes at runtime.
All in all, this gives us a better understanding of what is happening in our GraphQL servers and where we can improve them in the future.


Related Articles

API Strategy
Leveraging AI For a Better API Strategy
Learn how to leverage AI to build and fortify your API strategy. Improve design, governance, documentation, and align APIs with business outcomes.
API Strategy
The 5 Best Mixpanel Alternatives of 2025
Learn about the best Mixpanel alternatives to determine the right analytics solution for your use case.

API Development
How to Leverage Moesif Effectively for API Observability
Effectively leverage Moesif for API observability through best practices for integration, event enrichment, custom actions, and engineering workflow integrat...
API Strategy
How to Build an Internal Chargeback Model for Your API and AI Usage Using Moesif
Use Moesif to implement internal chargebacks and enable precise API and AI cost attribution for better transparency and resource optimization.