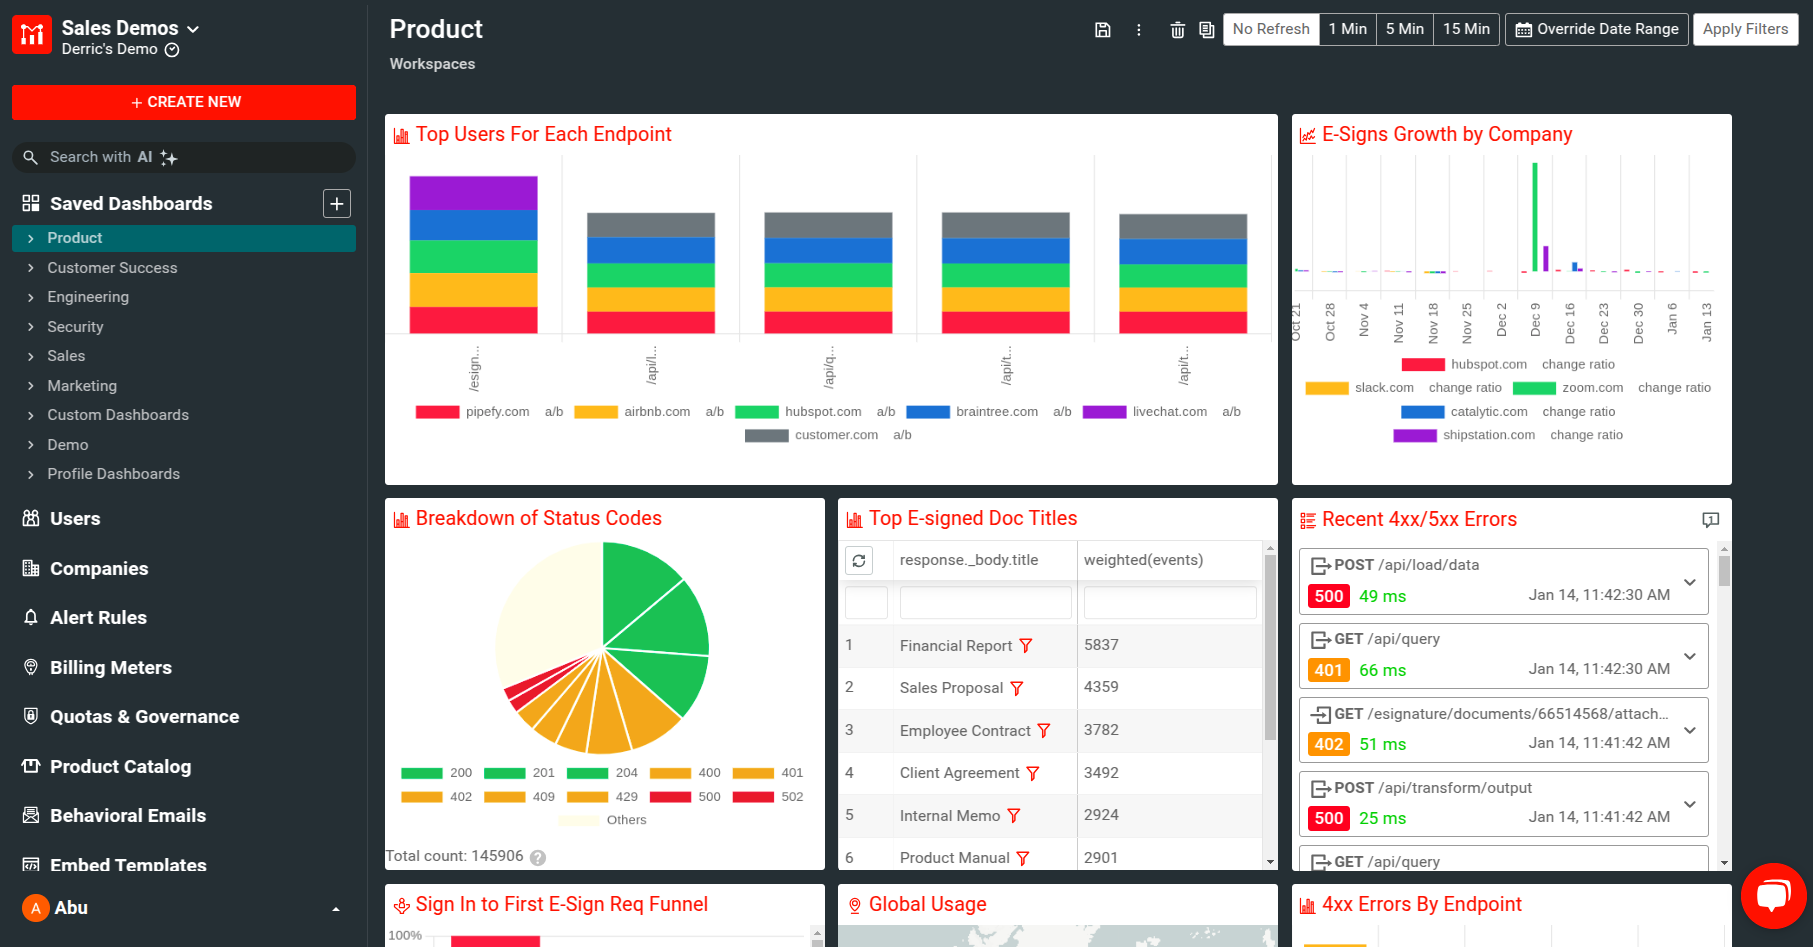
Introduction to Team Dashboards
Team dashboards allow you to save and track against key metrics that are important to you. You can create as many dashboards as you want. You can also organize dashboards by different criteria, like project and department.
Moesif organizes dashboards in a tree-like structure, visible in the navigation menu. Each dashboard acts like a file directory that contains an arbitrary number of workspaces—charts containing analysis. A dashboard can also contain other dashboards.
Definitions
- Workspace
- A single chart or tile on a dashboard that represents a specific metric.
- Dashboard
- A collection of workspaces. A dashboard can also hold other dashboards like a file directory.
Prebuilt dashboards
To help you get started faster, your Moesif account has several prebuilt dashboards, one for each of the following departments:
- Product
- Customer Success
- Engineering
- Security
- Sales
- Marketing
Each of these prebuilt dashboards contains metrics based on what we’ve seen work best. These can provide a good starting point for you to customize and build on. You can start with a blank slate and create a new dashboard that perfectly suits your needs.
Types of workspaces
The following four types of workspaces are supported:
- Private
- Team
- Public
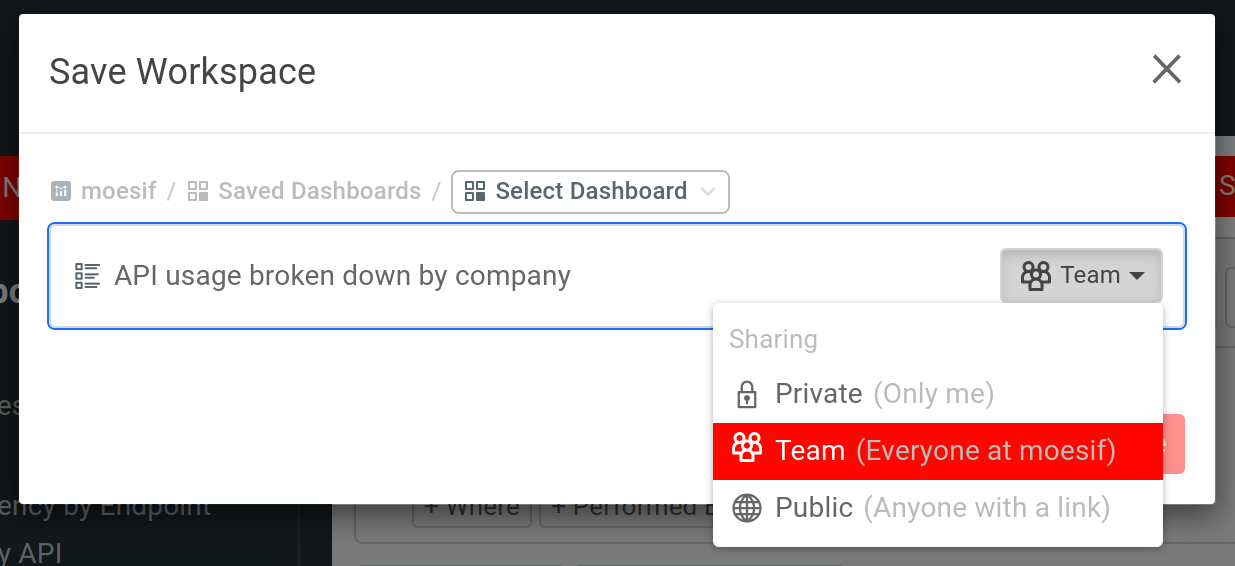
When you first save a workspace, you can set the type by selecting a type from the Sharing dropdown menu:
You can always change the type later anytime by following these steps:
- Open the workspace.
- Select Share and then choose a type.
- Select Save.
Private workspaces
Only the person creating a private workspace can view it. Other team members with access to Moesif can’t view this chart. This holds true even if they have access to the dashboard that you’ve added the chart to. These workspaces are effectively hidden from discovery.
Team workspaces
Anyone can discover team workspaces who has access to your Moesif organization. With team-level sharing, it’s easy to collaborate on KPIs and reports and share with other internal stakeholders.
To see the list of members of your Moesif organizations, select your account icon to bring up the settings menu bar. Then select Apps and Team. For more information, see the documentation on Apps and Team.
Public workspaces
Anyone with the public link can access the chart. Unlike Private or Team sharing, a person can view a public workspace even if they haven’t signed up for Moesif. Public workspaces also belong to a dashboard, but most users leverage public links to share a single chart with a customer or partner.
You can also use public links to embed the chart in markup directly using the <iframe> HTML element.
After saving your workspace, select ![]() Share.
Share.
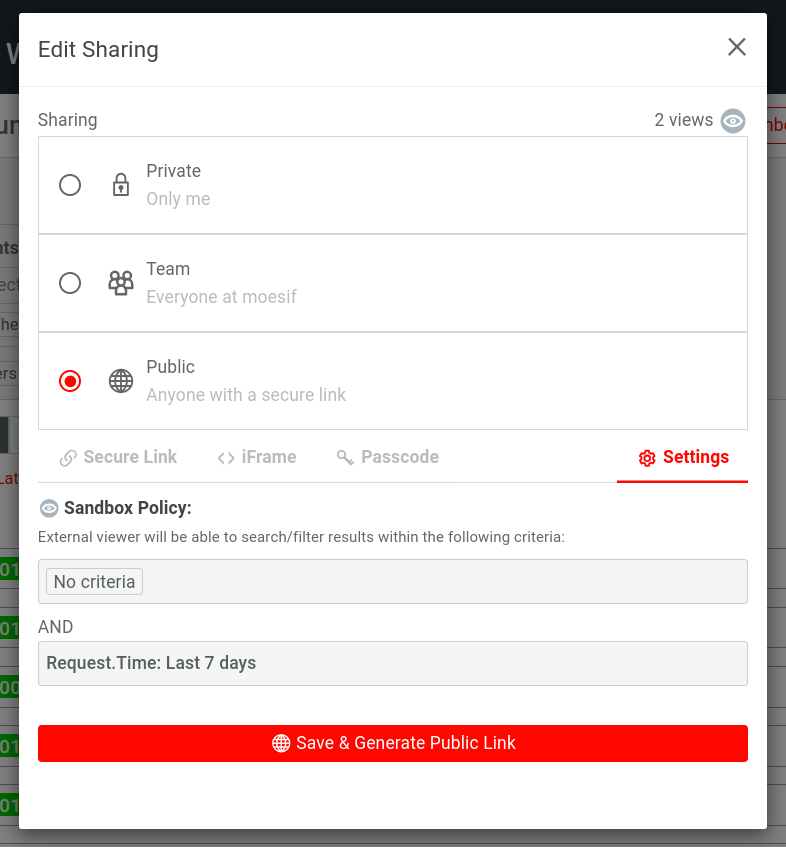
Then select Save and Generate Public Link to generate public links to your chart. You can choose how you want to share from the Secure Link, iFrame, and Passcode tabs.
Restricting data access
Because public links are intended to be shared with external parties, the data will be sandboxed by your chosen filters.
For example, if you filter by a specific user ID, then anyone with the public link can only access API data made by that specific user ID. Keep in mind not all filters support data sandboxing, but Moesif will show you which filters will be used before saving the link.
Hiding Headers in Public Links
By default, public links include a small header containing filter dropdowns and chart name. If you want to hide all elements besides the chart itself, set this to true. Because the filters are hidden, you’ll need to ensure any filters are added when you initially create the template.
To accomplish this, add &hide_headers=true to the generated URL after &embed=true.
Embedded Templates
Embedded templates are a special type of sharing that enables you to build powerful charts and embed them in customer-facing portals. Dynamic fields don’t need to be set until the chart is actually rendered.
Unlike public links which are static, Embedded templates enable the filter criteria to be set dynamically. For example, you may want to dynamically set the user ID to the customer who logged into your web app.
Generally, you will want to use an embedded template to show data to an authenticated user. The data displayed can then be tailored to that users based on, for example, the users ID.