How to Log API Traffic from Envoy Proxy and Monitor Metrics with Moesif
Envoy is a high-performance C++ distributed proxy designed for microservices and service-oriented architecture, as well as a scalable communication bus and “universal data plane” designed for large scale service meshes. Envoy runs alongside every application and abstracts the network by providing common features in a platform-agnostic manner. When all service traffic in an infrastructure flows via an Envoy mesh, it becomes easy to centralize cross-cutting concerns like observability, security, in addition to adding substrate features in a single place. Envoy, supports a static configuration model, also allows configuration via gRPC/protobuf APIs simplifying management at scale. Envoy also has a variety of filters to add support for gRPC, rate limiting, shadowing, canary routing, and API observability. API observability is a crucial part of the API lifecycle, ensuring that APIs are monitored and optimized throughout their development and deployment stages.
API observability is a new trend that is an evolution of legacy monitoring that empowers business and engineering teams with the ability to answer arbitrary questions. Traditional monitoring can answer known unknowns like Errors Per Minute or status like Red, Yellow Green, because monitoring works by probing for an already known metric and thus you would add performance counters or other instrumentation to monitor that metric. API observability on the other hand enables you to answer unknown unknowns which arise from complex engineering and business challenges.

Moesif provides a plugin for Envoy that makes getting started with API observability take just a few minutes so you can stay focused on shipping features customers love rather than deal with the maintenance cost of building your own data infrastructure. In this article, we’ll talk about the insights Moesif gives you, and how to integrate it into your Envoy proxy. Then, we will talk about how to best leverage API observability using Moesif and Envoy.

Introduction to API Logging and Monitoring
API logging and monitoring are essential components of modern software infrastructure, playing a critical role in ensuring the performance, security, and reliability of Application Programming Interfaces (APIs). In this section, we will delve into the world of API logging and monitoring, exploring their importance, benefits, and key concepts.
What is API logging and why is it important?
API logging refers to the process of capturing and recording API interactions, including requests, responses, and errors. This information is crucial for troubleshooting, debugging, and optimizing API performance. API logging provides a detailed audit trail of API interactions, enabling developers and system administrators to identify security breaches, analyze user behavior, and make informed decisions about infrastructure scaling.
API logging is important because it:
-
Provides insights into API performance, aiding in debugging and optimization
-
Ensures adherence to security standards and compliance regulations
-
Offers a comprehensive audit trail of API interactions, crucial for identifying security breaches and analyzing user behavior
-
Enables informed decisions about infrastructure scaling and resource allocation
By maintaining detailed API logs, organizations can ensure their APIs are running efficiently, securely, and in compliance with relevant standards.
Benefits of monitoring API performance and analytics
Monitoring API performance and analytics is vital for ensuring the reliability, security, and efficiency of APIs. The benefits of API monitoring include:
-
Improved API performance and responsiveness
-
Enhanced security and compliance
-
Increased visibility into API usage and analytics
-
Better decision-making through data-driven insights
-
Reduced downtime and improved overall reliability
By monitoring API performance and analytics, organizations can identify potential issues before they escalate, optimize API performance, and ensure a smooth and reliable user experience. This proactive approach to API monitoring helps maintain high standards of service and user satisfaction.
Envoy Background
If you’re a microservice practitioner concerned about networking and observability issues when moving to a distributed architecture for your organization’s API portfolio, your most likely solution is including a service proxy platform in your tech stack. In today’s cloud-centric world, business logic is commonly distributed into microservices. Each service has other consumers that depends on that service, whether other teams, partners, or even revenue-generating customers. While most of these are RESTful APIs, they can also be SOAP, gRPC, GraphQL, Thrift, or other protocols.” (Technically gRPC still uses http/2 under the hood, but not like our typical JSON/RESTful APIs). Managing and observing L7 is crucial to any cloud application, since a large part of application semantics and resiliency are dependent on L7 traffic.
Among the proxies available HAProxy, NGINX, and Envoy are reliable, proven proxies, with Envoy being the latest inclusion to the list. While HAProxy is a very reliable, fast, and proven proxy, there are concerns with the minimum set of features available for microservices. NGINX was designed initially as a web server, and over time has evolved to support additional use cases like proxy servers and API gateways. NGINX is a high-performance web server that does support hitless reloads but NGINX open source has a number of limitations, including limited observability and health checks. Envoy was designed from the ground up for microservices, with features such as hitless reloads (called hot restart), observability, resilience, and advanced load balancing. Envoy also embraced distributed architectures, adopting eventual consistency as a core design principle and exposing dynamic APIs for configuration. Monitoring API endpoints is essential for maintaining optimal performance and quickly addressing any issues that may impact end-users.
Understanding API Logs
API logs are a critical component of API logging and monitoring. In this section, we will explore the structure and components of API logs, providing a deeper understanding of their importance and relevance.
Structure and components of API logs
API logs typically consist of several key components, including:
-
Timestamp: The exact date and time when the API request was made or an event occurred
-
HTTP Method and Endpoint: The HTTP method (GET, POST, PUT, DELETE, etc.) and the specific endpoint that was accessed
-
Request and Response Details: The headers, query parameters, and body of the request, as well as the response sent by the server
-
Client Information: The IP address of the client making the request and, in some cases, additional details like the device type or browser used
-
Latency: The time taken to process each request, essential for performance monitoring A well-structured API log provides a holistic view of API interactions, combining these components to offer a detailed narrative of each request and response. By analyzing API logs, organizations can gain valuable insights into API performance, security, and usage, enabling informed decision-making and optimization. This comprehensive understanding of API logs is crucial for maintaining the health and efficiency of your API ecosystem.
How to set up Envoy API monitoring
With the Moesif Envoy filter, your API traffic is logged to Moesif for analytics and reporting. Moesif provides deep insights for engineering teams to understand how their APIs are used and quickly troubleshoot complex issues. Because Moesif also tracks who is calling your API and how they are accessed, product-driven teams can understand the entire customer journey and where to invest more resources. With API observability, forward-thinking engineering leaders can empowers customer-facing teams with self-service analytics on activation funnels, retention reports, and more. Moesif also analyzes your API payloads for troubleshooting and business insights so you’re able to understand utilization of specific payload keys, etc. Effective log management is crucial for collecting, analyzing, and visualizing API logs to enhance troubleshooting and performance monitoring.
Envoy exposes various APIs that lets you dynamically configure the proxy. By configuring a Listener which allows Envoy to listen to network traffic at configurable address, you can enable the flow of traffic through the proxy, and enhance the data flow using several Filters. The API for HTTP level filters allows the filters to operate without knowledge of the underlying protocol.
Moesif uses the HTTP Lua filter to capture API request/response for API analytics and monitoring. When Envoy loads the script in the configuration, it looks for two global functions that the script defines: envoy_on_request and envoy_on_response. During the request path, Envoy will run envoy_on_request passing a handle to the request API, while during the response path, Envoy will run envoy_on_response passing handle to the response API.
Moesif captures request method, headers, and body information when envoy_on_request function is called and response status code, headers, and body when envoy_on_response function is called for every request. It adds that event to the queue and periodically flush the queue to send the events to Moesif. Moesif ensures that no latency is added by batching events even during high traffic.
Add the Moesif Envoy plugin
To add the Moesif plugin for Envoy, you will need your Moesif Application Id. You can get one by signing up for a free Moesif account, then select Envoy during the onboarding. Moesif recommends using of a single application Id for all Envoy proxy instances and data-center regions. This ensures you have a unified view of your API usage data regardless of physical topology. You can still break down by any number of attributes using Moesif’s high-cardinality, high-dimension analytics engine.
Moesif still recommends creating separate Application Ids for each environment such as Production, Staging, and Development to keep data isolated.
The envoy.yaml file should look something like this:
 http_filters:
    - name: envoy.filters.http.lua
    typed_config:
        "@type": type.googleapis.com/envoy.extensions.filters.http.lua.v3.Lua
        inline_code: |
        local log = require("moesif.plugins.log")

        -- Moesif configs
        log.set_application_id("Your Moesif Application Id")

        function envoy_on_request(request_handle)
            -- Log Event Request to Moesif
            log.log_request(request_handle)
        end

        function envoy_on_response(response_handle)
            -- Log Event Response to Moesif
            log.log_response(response_handle)
        end
Once you have the Moesif Envoy plugin installed, your API traffic should start showing up in the live event stream within Moesif.

More information on how to configure your Envoy proxy to capture traffic and logs to Moesif.
How to use API observability
Engineering metrics
The first thing you’ll probably be interested in is metrics related to your API’s performance. This type of metric can be pulled up by going to Events -> Time Series view within Moesif. Then you can select 90th percentile latency as the metric to plot. You can then group by the URI route to understand which endpoints have the worst performance. Here, you can filter your traffic by API attributes like route, verb, along with HTTP headers and body fields.

Business metrics
To associate API calls to individual customers, configure Envoy with the set_user_id_header() or set_company_id_header() config option.
Once done, you can then store additional customer attributes like Company Domain or User Email via Moesif’s user tracking SDK. This provides clarity for customer-facing teams to understand who is using your APIs along with how they are using them.
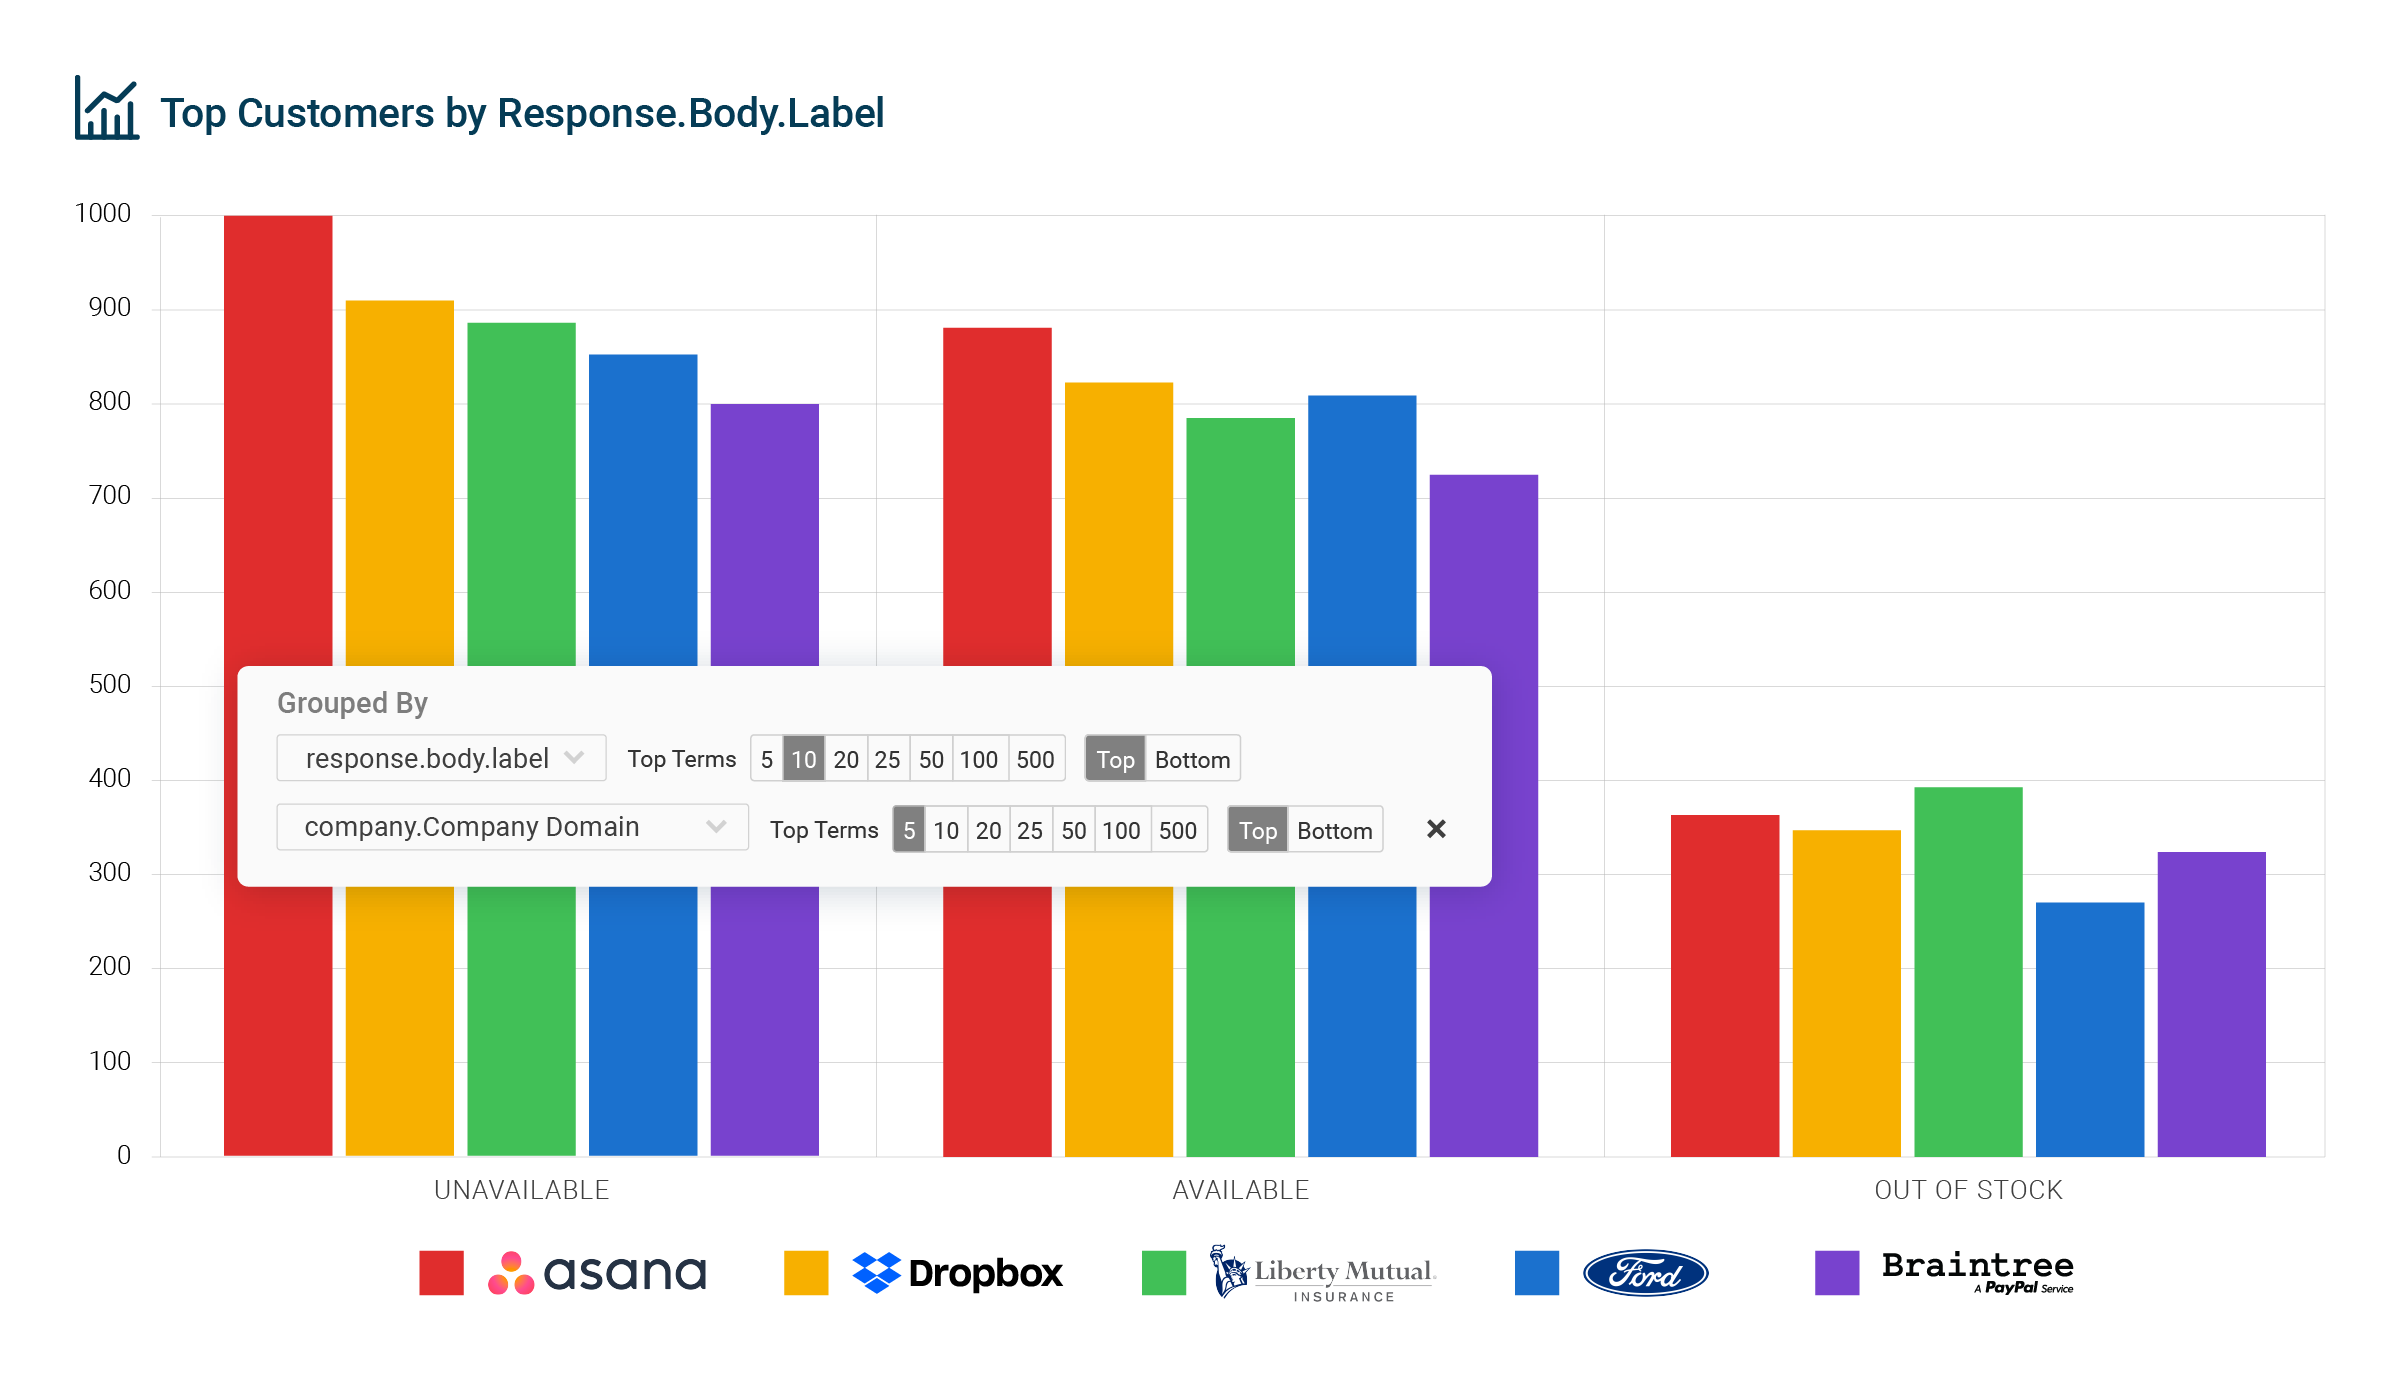
Moesif supports analyzing common payload content-types including JSON and XML. As an example, you can group API calls by response.body.label and then group by Company Domain as shown in the below chart. This shows which customers received a bad experience due to running into Out of Stock issues even though no 500 error was thrown.
Funnel reports
There are a variety of actions a customer can take outside of your API such as within your UI. To track this, you can add moesif-browser-js to track user actions. User actions are goals that a customer did within your UI such as Signed In or Purchased Plan. Once done, you can track your end-to-end customer journey from both the UI to the API. A user-friendly interface in monitoring tools can significantly enhance the ease of tracking and analyzing user actions.

In the above report, we created a funnel analysis composing of three steps.
- The first step is a customer signing into your web app.
- Moving from the first to second step shows the drop off for customers who actually made their first payment transaction through your platform. The time it takes to get to this second step is called “Time to First Hello World” or TTFHW.
- Moving from the second to third step shows the percentage of user who end up making over 100 payment transactions. This could be your “aha” moment or when someone receives full value out of your API.
Handling sensitive data
If your application consists of sensitive data such as healthcare or financial data, you can become data compliant with one of two options:
1. Zero-knowledge security
Client-side encryption has the benefits of low-maintenance SaaS while still putting you in control of your data. Because you control and encrypt the data on-premises before being sent to Moesif, Moesif physically cannot access your data. This requires only running a small appliance within your infrastructure called secure proxy to handle encryption/decryption of your data on the fly.
2. Data masking
If you don’t want client-side encryption, you can also mask data directly using the plugin. This is handled via the set_request_body_masks() and set_response_body_masks() configurations option. For example, you could mask a field called password that might be present in the payload. Additionally if you want to remove logging request and response body all together, you could set the set_disable_capture_request_body() or set_disable_capture_response_body() configuration option to false.
Closing thoughts
With the Moesif Envoy plugin, your engineering and business teams are empowered with deep API observability without the high cost of building and maintaining your own homegrown tooling. Monitoring APIs is essential for maintaining high standards of service and ensuring a smooth user experience.
To see the Envoy integration with Moesif in action, you can git clone and run this example app from GitHub


Related Articles

API Strategy
Leveraging AI For a Better API Strategy
Learn how to leverage AI to build and fortify your API strategy. Improve design, governance, documentation, and align APIs with business outcomes.
API Strategy
The 5 Best Mixpanel Alternatives of 2025
Learn about the best Mixpanel alternatives to determine the right analytics solution for your use case.

API Development
How to Leverage Moesif Effectively for API Observability
Effectively leverage Moesif for API observability through best practices for integration, event enrichment, custom actions, and engineering workflow integrat...
API Strategy
How to Build an Internal Chargeback Model for Your API and AI Usage Using Moesif
Use Moesif to implement internal chargebacks and enable precise API and AI cost attribution for better transparency and resource optimization.
