Moesif for API Observability and Analytics in NGINX OpenResty
NGINX with OpenResty offers unmatched performance for serving APIs (application programming interfaces) at scale, with the added benefits of the open-source ecosystem. It’s fast, flexible, and production-proven—an ideal choice for scalable web platforms and high-throughput APIs. But even the most reliable platform can leave teams blind to what matters: real-time API usage, user behavior, and production errors.
Access logs and basic monitoring tools can’t tell you why a customer churned, explain complex usage patterns and queries, why requests fail, or how fast customers reach value.
That’s where Moesif comes in.
Moesif brings real-time API observability, error tracking, and deep behavioral analytics to your OpenResty stack by extending it through a Lua-based configurable plugin—without rewriting your app or compromising performance. It logs API traffic with full context: user identity, response times, payloads, and more. You get access to dashboards that highlight API bottlenecks, drop-offs, and usage spikes—backed by data you can actually act on.
In this blog post, we’ll demonstrate how you can achieve deep API observability and analytics for NGINX using OpenResty and Moesif.

Table of Contents
- What is NGINX OpenResty?
- The Role of Moesif: Visibility into Every API Event
- Benefits of Using Moesif with NGINX OpenResty
- Set Up Moesif with OpenResty
- Key Metrics to Track for API Observability and Analytics
- Conclusion
What is NGINX OpenResty?
OpenResty extends the core of NGINX by bundling it with LuaJIT and a rich ecosystem of Lua libraries. This fusion turns a fast reverse proxy into a programmable web platform—ideal for teams building scalable APIs and dynamic web gateways. Engineers use OpenResty to handle routing logic, caching, access control, and custom traffic shaping directly within the NGINX server.
One key advantage lies in OpenResty’s event-driven architecture. It allows Lua scripts to run efficiently at various phases of the NGINX lifecycle—without sacrificing throughput. This makes it an effective foundation for real-time API observability.
Because OpenResty allows inline scripting in phases, developers can log structured request and response data at the gateway layer. That’s where Moesif fits in. Its Lua-based plugin leverages these hooks to capture critical API data like user IDs, status codes, payload details, latency—and forward them for analysis. This enables deep visibility with minimal overhead and without disrupting NGINX’s performance profile.
OpenResty’s modularity, combined with Moesif’s analytics layer, creates a lightweight but powerful path to understanding API behavior across complex systems.
The Role of Moesif: Visibility into Every API Event
Most OpenResty setups log requests for basic troubleshooting—status codes, timestamps, maybe upstream response times. But understanding real-world API usage requires more than log lines, for example:
-
Which users triggered which endpoints
-
How long responses took
-
What payloads passed through
-
Whether usage patterns reflect product success or operational issues
Moesif captures this level of detail natively through its Lua-based plugin. During each request cycle, Moesif reads request and response bodies, applies your plugin configuration, and ships structured event data to Moesif’s analytics platform. The data includes headers, routes, latency, and user context. This occurs asynchronously, preserving OpenResty’s performance model.
What sets Moesif apart in this context lies in how it stores and exposes the data. Instead of funneling logs into unstructured files or third-party collectors, Moesif automatically associates events with contextual data like user ID, company ID, or endpoint. It gives you a rich suite of filtering tools and breakdowns by error type, request duration, and more—all from the browser. You can break down performance metrics by customer, track API usage across segments, and identify anomalies with precision. Moesif also integrates with OpenTelemetry to leverage your API’s distributed tracing and logging and makes those data directly available in the platform.
For engineering teams maintaining OpenResty services, this visibility translates to faster debugging, better alerting, and actionable feedback loops. With Moesif in place, every API request becomes a trackable unit of insight.
Benefits of Using Moesif with NGINX OpenResty
Combining Moesif with OpenResty introduces API analytics and visibility at the gateway level without disrupting the server’s performance model. Together, they enable high-fidelity API observability with minimal configuration and virtually no runtime penalty.
How Moesif Captures NGINX API Logs
OpenResty supports Lua scripting across HTTP phases like access_by_lua and log_by_lua, allowing Moesif to capture and process event data with the request lifecycle. This integration results in a clean pipeline for structured analytics without modifying application logic. The API logging and governance enforcement is designed for non-blocking execution so your performance is not impacted.
Collected data includes the following:
-
Timestamps for requests
-
Route, status code, latency and headers
-
Request and response bodies for powerful payload analytics
-
IP geolocation and user agent
Troubleshooting API Issues in Real Time
OpenResty gives teams flexibility to build and deploy custom API gateways—but with flexibility comes complexity. When you lack proper observability, issues like slow endpoints, inconsistent errors, or customer-specific timeouts often go unnoticed until they impact SLAs.
Moesif helps you fill this gap. Once events reach Moesif’s platform, teams can:
-
Filter traffic by API key, company, or IP address
-
Visualize request volume and latency over time, segmented by endpoint or plan
-
Set alerts on status code thresholds or latency spikes for specific routes
-
Create funnel reports to measure onboarding or time-to-value
This reduces time to resolution, particularly in distributed systems where gateway logs rarely tell the full story. With Moesif dashboards in place, teams no longer need to grep logs or trace requests across multiple layers. They can view error spikes by endpoint, segment 5xx errors by company, and track latency changes in real time—directly from Moesif’s UI.
Set Up Moesif with OpenResty
Step 1: Install the Moesif Lua Plugin
First, ensure OpenResty runs with the lua-nginx-module included, which ships by default. Then, install the Moesif plugin through Luarocks:
luarocks install --server=http://luarocks.org/manifests/moesif lua-resty-moesif
Step 2: Configure NGINX
In your nginx.conf, configure the shared memory dictionary and Lua package installation paths:
lua_shared_dict moesif_conf 5m;
lua_package_path "/usr/local/openresty/luajit/share/lua/5.1/?.lua;;";
The shared dictionary holds static configuration options like your Moesif Application ID and request and response masks.
Step 3: Initialize Moesif
In your main http block, initialize the Moesif client:
init_by_lua_block {

    local config = ngx.shared.moesif_conf;
    config:set("application_id", "YOUR_MOESIF_APPLICATION_ID")

    local mo_client = require "moesifapi.lua.moesif_client"
    mo_client.get_moesif_client(ngx)
}
This step loads the Moesif library and prepares it to process API events.
Step 4: Capture Requests and Responses
Use access_by_lua_file and log_by_lua_file directives to read request and response bodies:
server {

  listen 8080;

  # Customer identity variables that Moesif will read downstream

  set $moesif_user_id nil;
  set $moesif_company_id nil;


  # Request/Response body variable that Moesif will use downstream

  set $moesif_res_body nil;
  set $moesif_req_body nil;


  access_by_lua_file /usr/local/openresty/luajit/share/lua/5.1/resty/moesif/read_req_body.lua;
  body_filter_by_lua_file /usr/local/openresty/luajit/share/lua/5.1/resty/moesif/read_res_body.lua;
  log_by_lua_file /usr/local/openresty/luajit/share/lua/5.1/resty/moesif/log_event.lua;

  location / {
    proxy_pass http://ai_api.com/internal;
  }
}
In the preceding example configuration:
-
access_by_lua_fileallows Moesif to capture request data. -
body_filter_by_lua_fileallows Moesif to read the response data. -
log_by_lua_filesends the complete event data to Moesif asynchronously after the response finishes.
By setting $moesif_user_id (and optionally $moesif_company_id), you tag traffic with customer-specific identifiers, enabling analysis types like Segmentation inside Moesif dashboards.
Step 5: Verify Your Setup
Once the integration completes, send a few API requests through your NGINX OpenResty instance. Then, log in to your Moesif account and open a Live Event Stream workspace.
You should see new events appear in real time.
If you face any issues, see the Server Troubleshooting Guide or contact our support team.
For detailed configuration options and example templates to customize your configuration, see the Moesif Lua plugin documentation.
Try The OpenResty Docker Demo
TheOpenResty Docker Demo provides a working setup of Moesif and NGINX OpenResty. It lets you see how requests flow through the system before integrating into a live environment.
For a hands-on tutorial using this demo for API observability, see API Observability and Monetization with NGINX OpenResty and Moesif Developer Portal.
Key Metrics to Track for API Observability and Analytics
When APIs power critical systems, surface-level monitoring no longer suffices. Teams need real-time, structured insights into traffic, performance, and user behavior—straight from the gateway. By integrating Moesif with OpenResty, developers and engineering leaders can track meaningful API metrics without introducing new overhead or disrupting their architecture.
Let’s look at some of these metrics through practical examples:
Total Response Time (Latency)
Moesif measures the full time from the initial request arrival to the final response sent by your server. Teams can analyze this data through built-in visualizations and analysis types like the following:
-
Maximum latency
-
Minimum observed response times
-
90th percentile (P90) latency to detect slow-tail performance issues
-
Custom latency types to highlight requests exceeding target thresholds—for example, greater than 500ms.
These valuable insights help pinpoint high-latency endpoints and track how performance evolves across customer segments or deployments. For example:
-
Which endpoints consistently show slow response times?
-
Do enterprise customers experience better or worse latency compared to free-tier users?
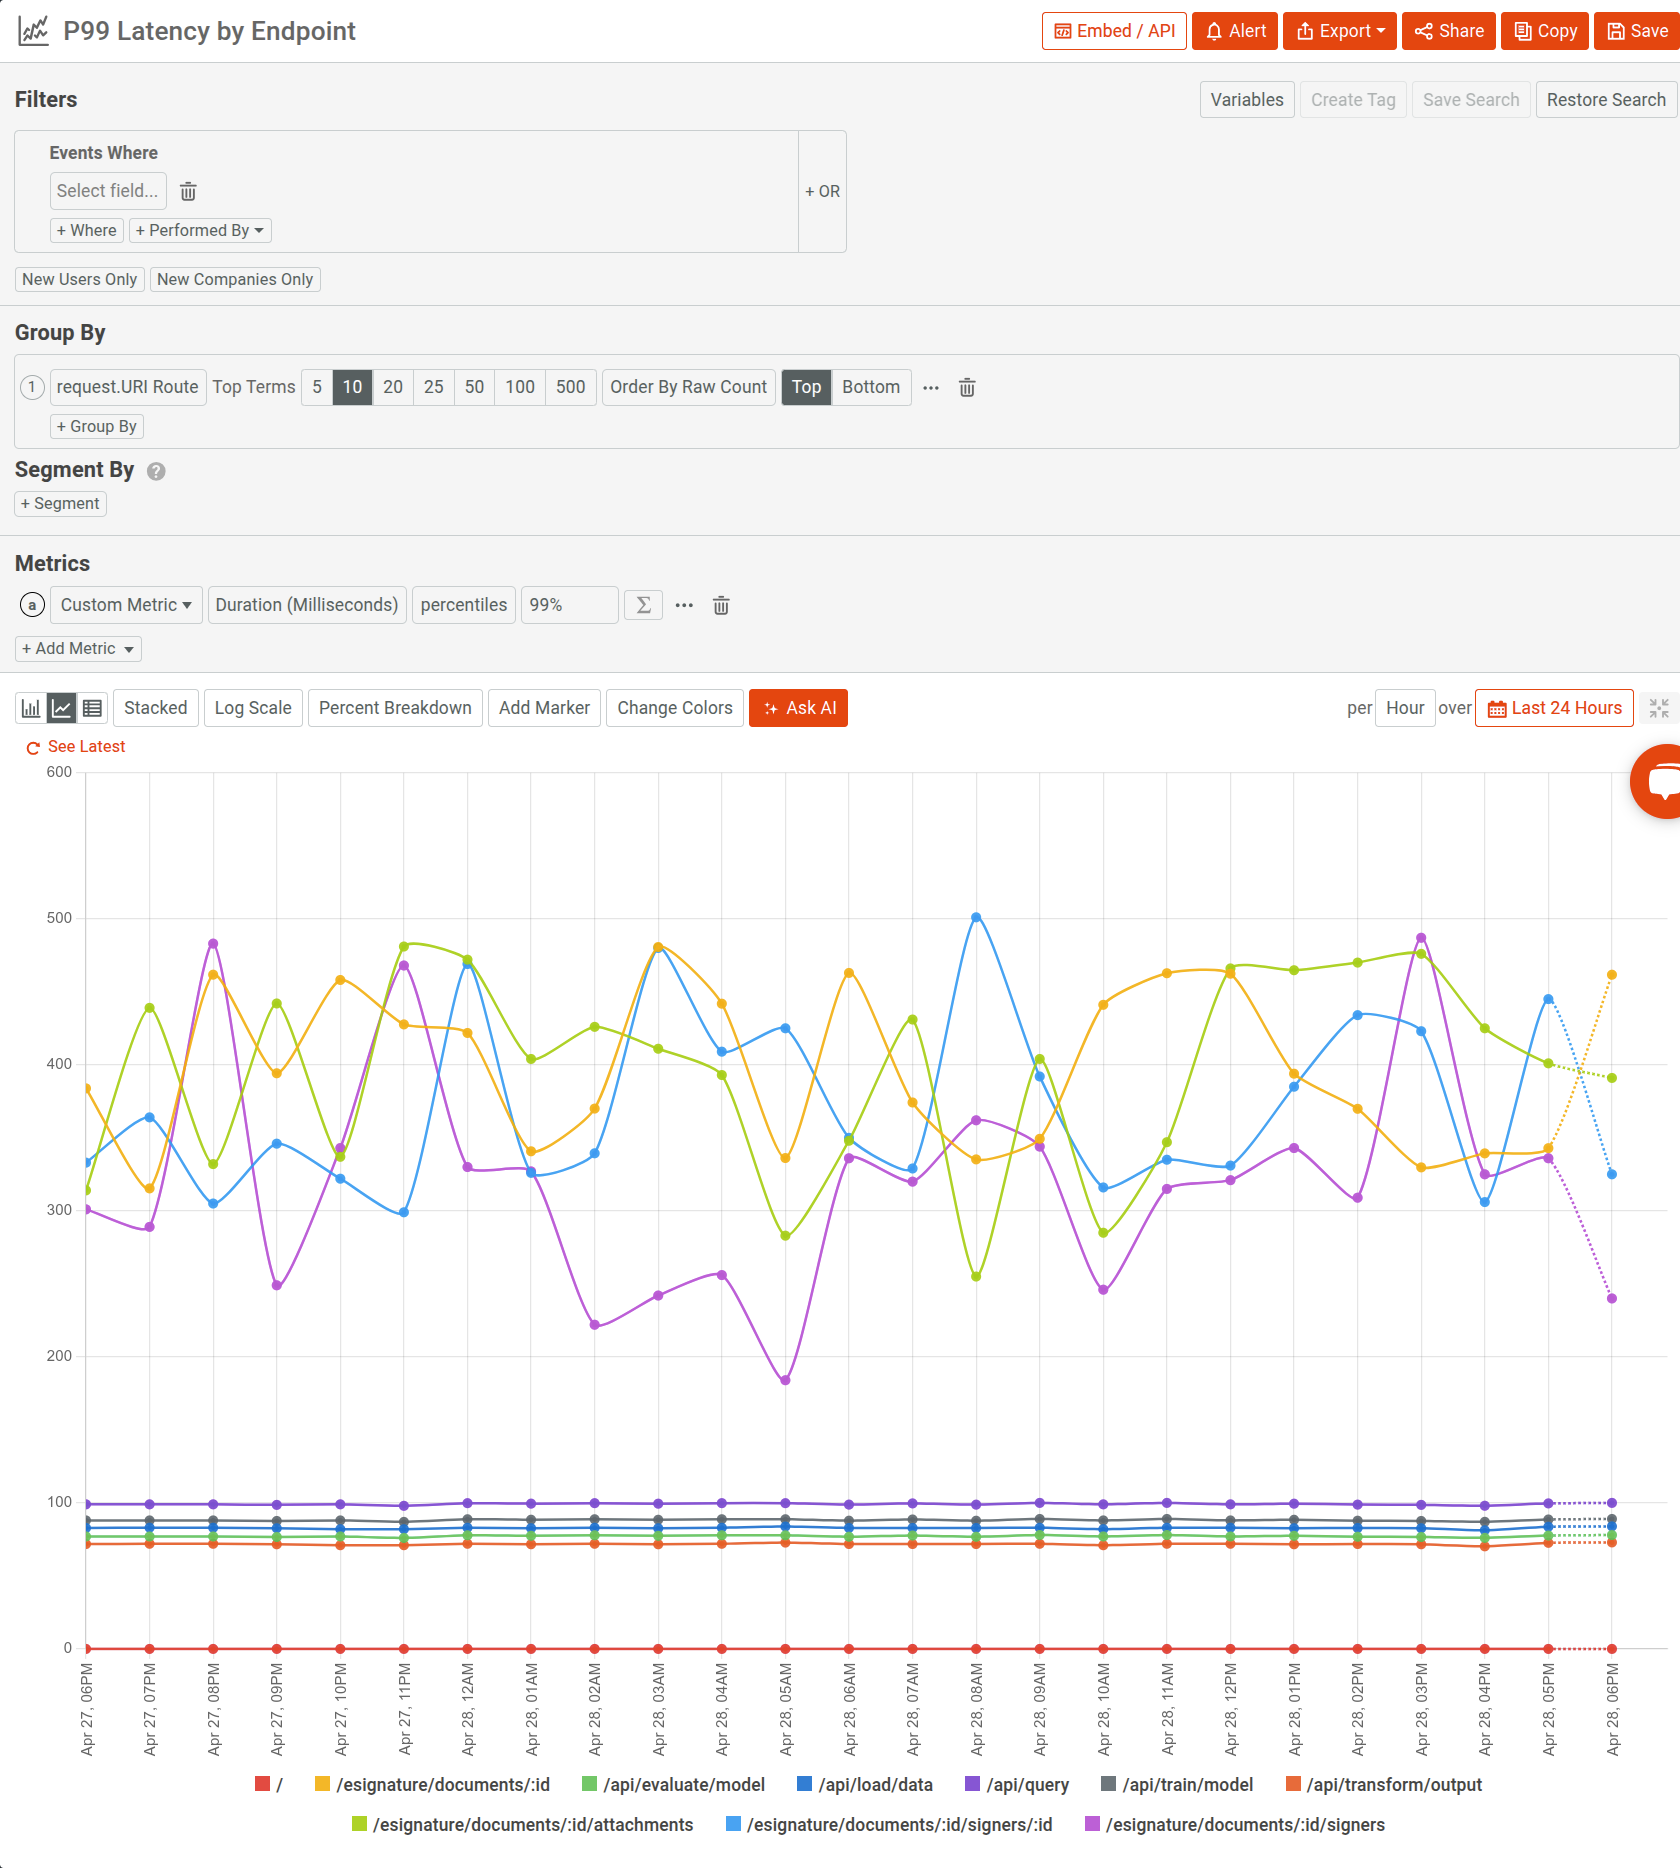
In the following illustration, a Time Series analysis in Moesif shows P99 latency across API endpoints in the past 24 hours:
Status Code Trends and Error Analysis
Moesif automatically records every API response’s status code, making it easy to monitor client-side 4xx and server-side 5xx error patterns over time. Teams can break down errors by endpoint, customer, or request method to understand operational health at a glance. This allows you to find answers to questions like:
-
Where do authentication or validation failures occur most often?
-
Has a recent deployment increased server error rates on critical routes?
For example, the following time series analysis breaks down 5xx server errors on an hourly interval for the last 12 days. It also categorizes the analysis by response status codes to highlight the exact error types.
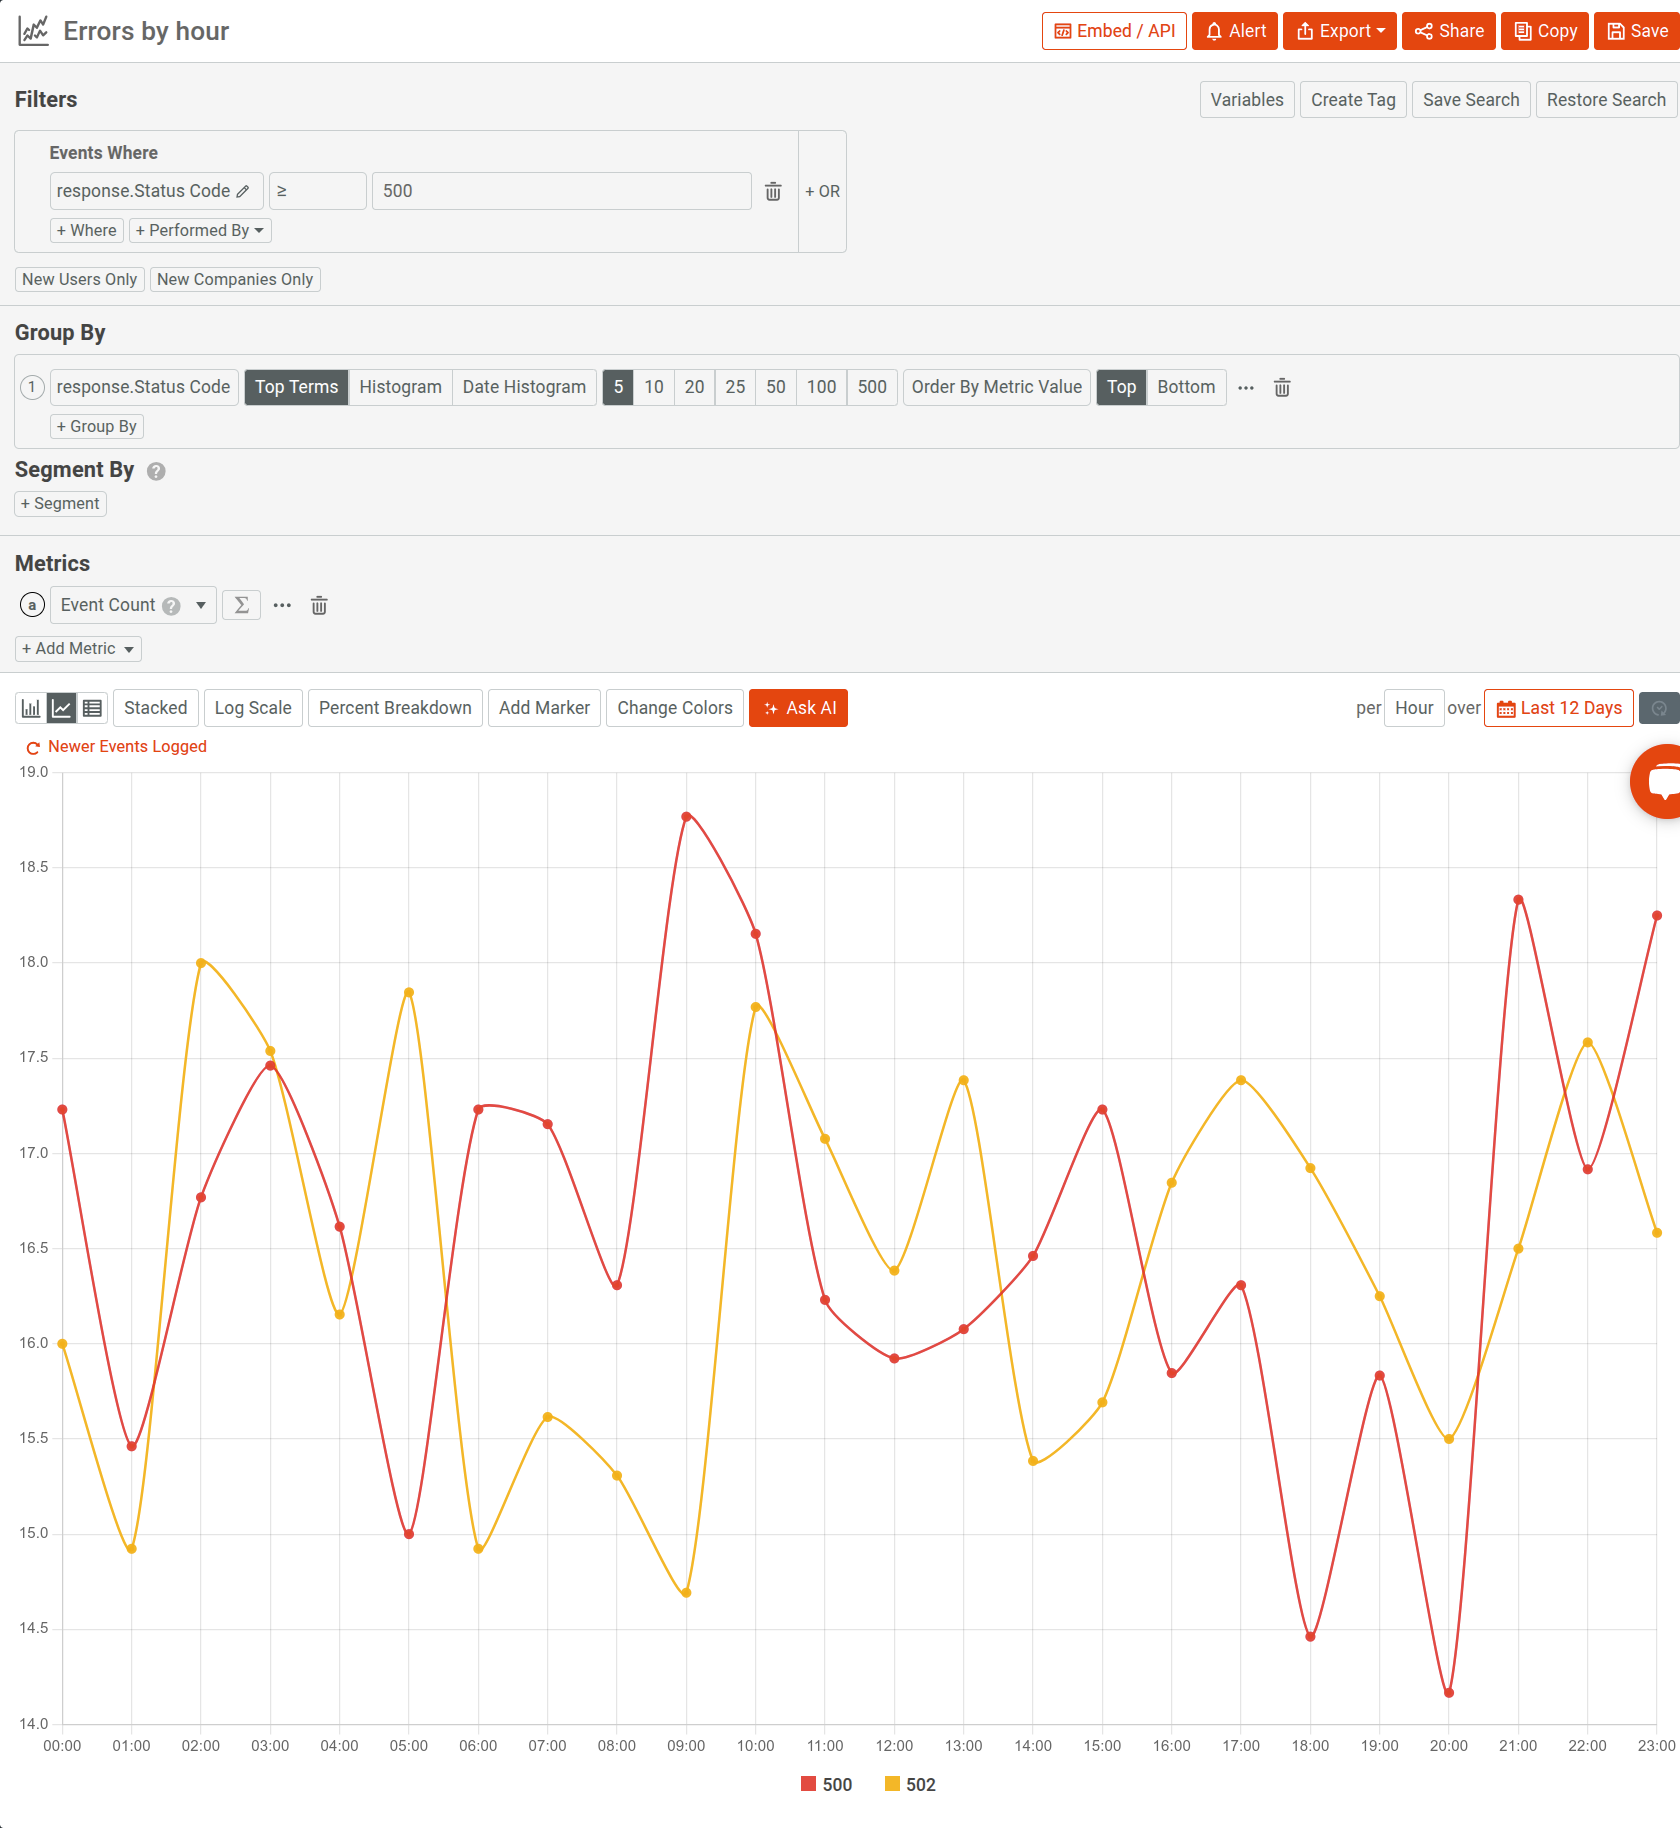
To showcase Moesif’s advanced analytics capabilities, we’ve applied time series folding to better visualize the periodic behavior of our metric. Folding proves especially useful for uncovering recurring patterns, like fluctuations in error rates or time-based anomalies. It highlights worst-case scenarios by compressing cycles into a single view. In this example, folding helps identify whether specific hours consistently experience error spikes. This type of analysis can reveal underlying issues like:
-
Peak traffic periods overwhelming the API
-
Scheduled maintenance or batch processes disrupting normal operations
-
External service failures tied to specific times
The following demonstrates another example where it gives a breakdown of all API errors in the last 12 weeks across APIs:
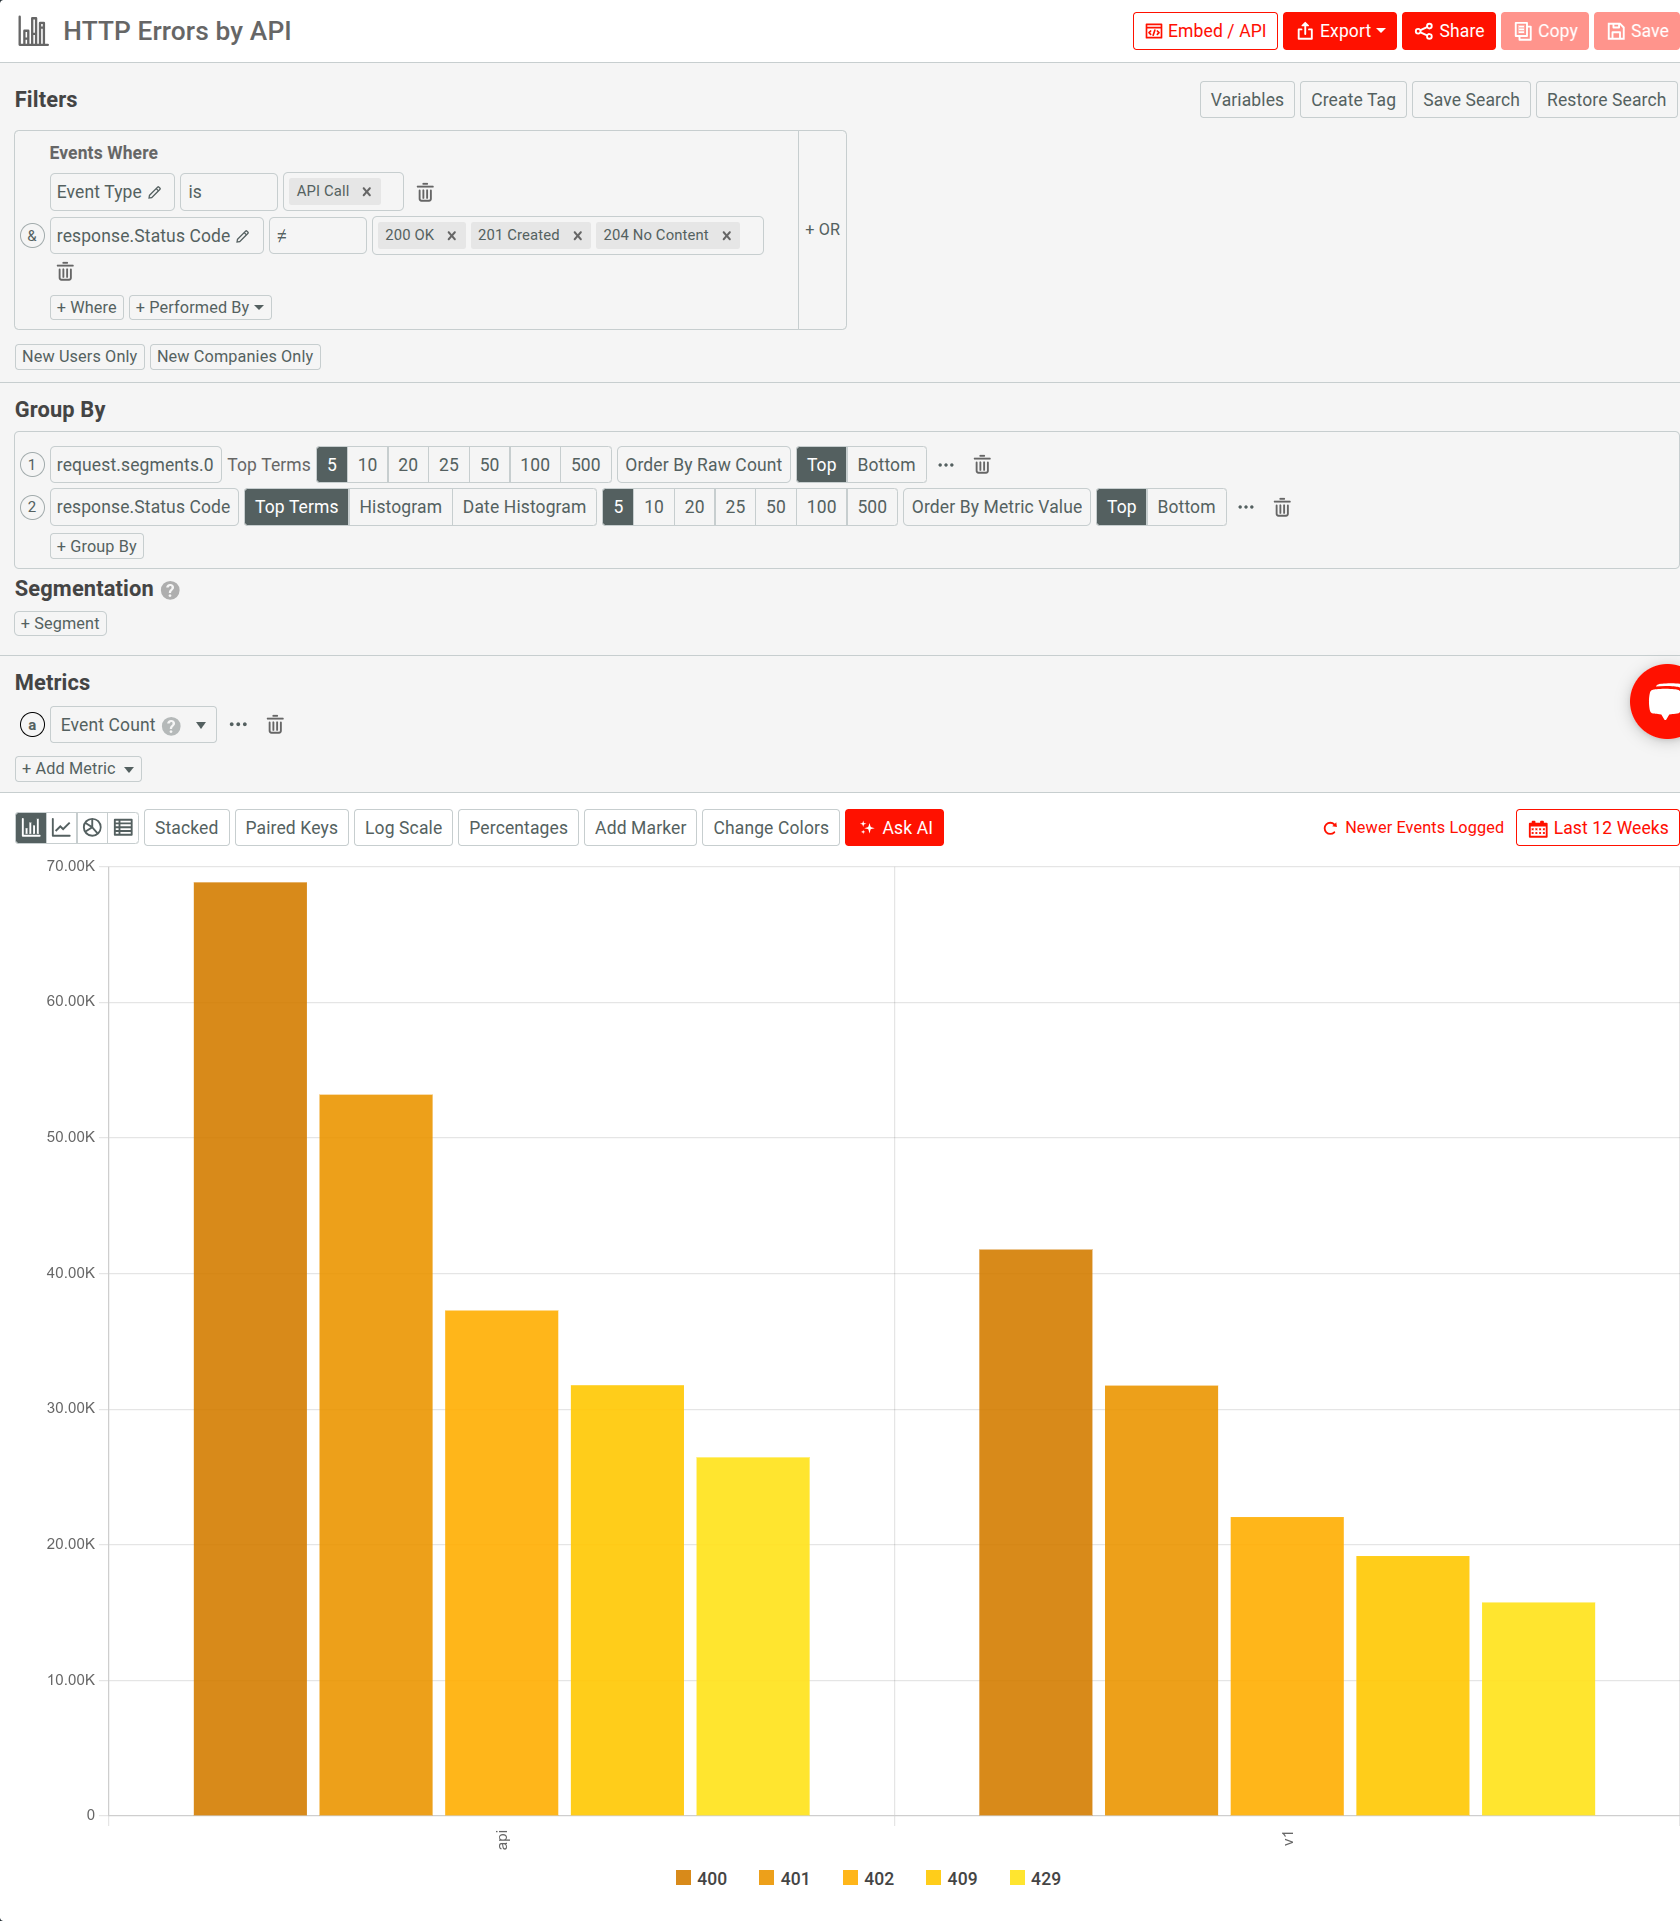
Visualizing daily error trends like this in Moesif highlights patterns that raw logs miss. You can spot rising error rates early, correlate spikes with deployments or traffic changes, and prioritize fixes before they impact users.
Active Users and API Usage Patterns
By tagging requests with user IDs and company IDs at the gateway, you can move beyond generic request counts to measure real customer engagement. Moesif tracks active users daily, weekly, and monthly while allowing drilldowns into user journeys and session flows.
-
You can identify how many unique users actively call the API each week.
-
You can pinpoint where new users succeed—or struggle—during their first API interactions.
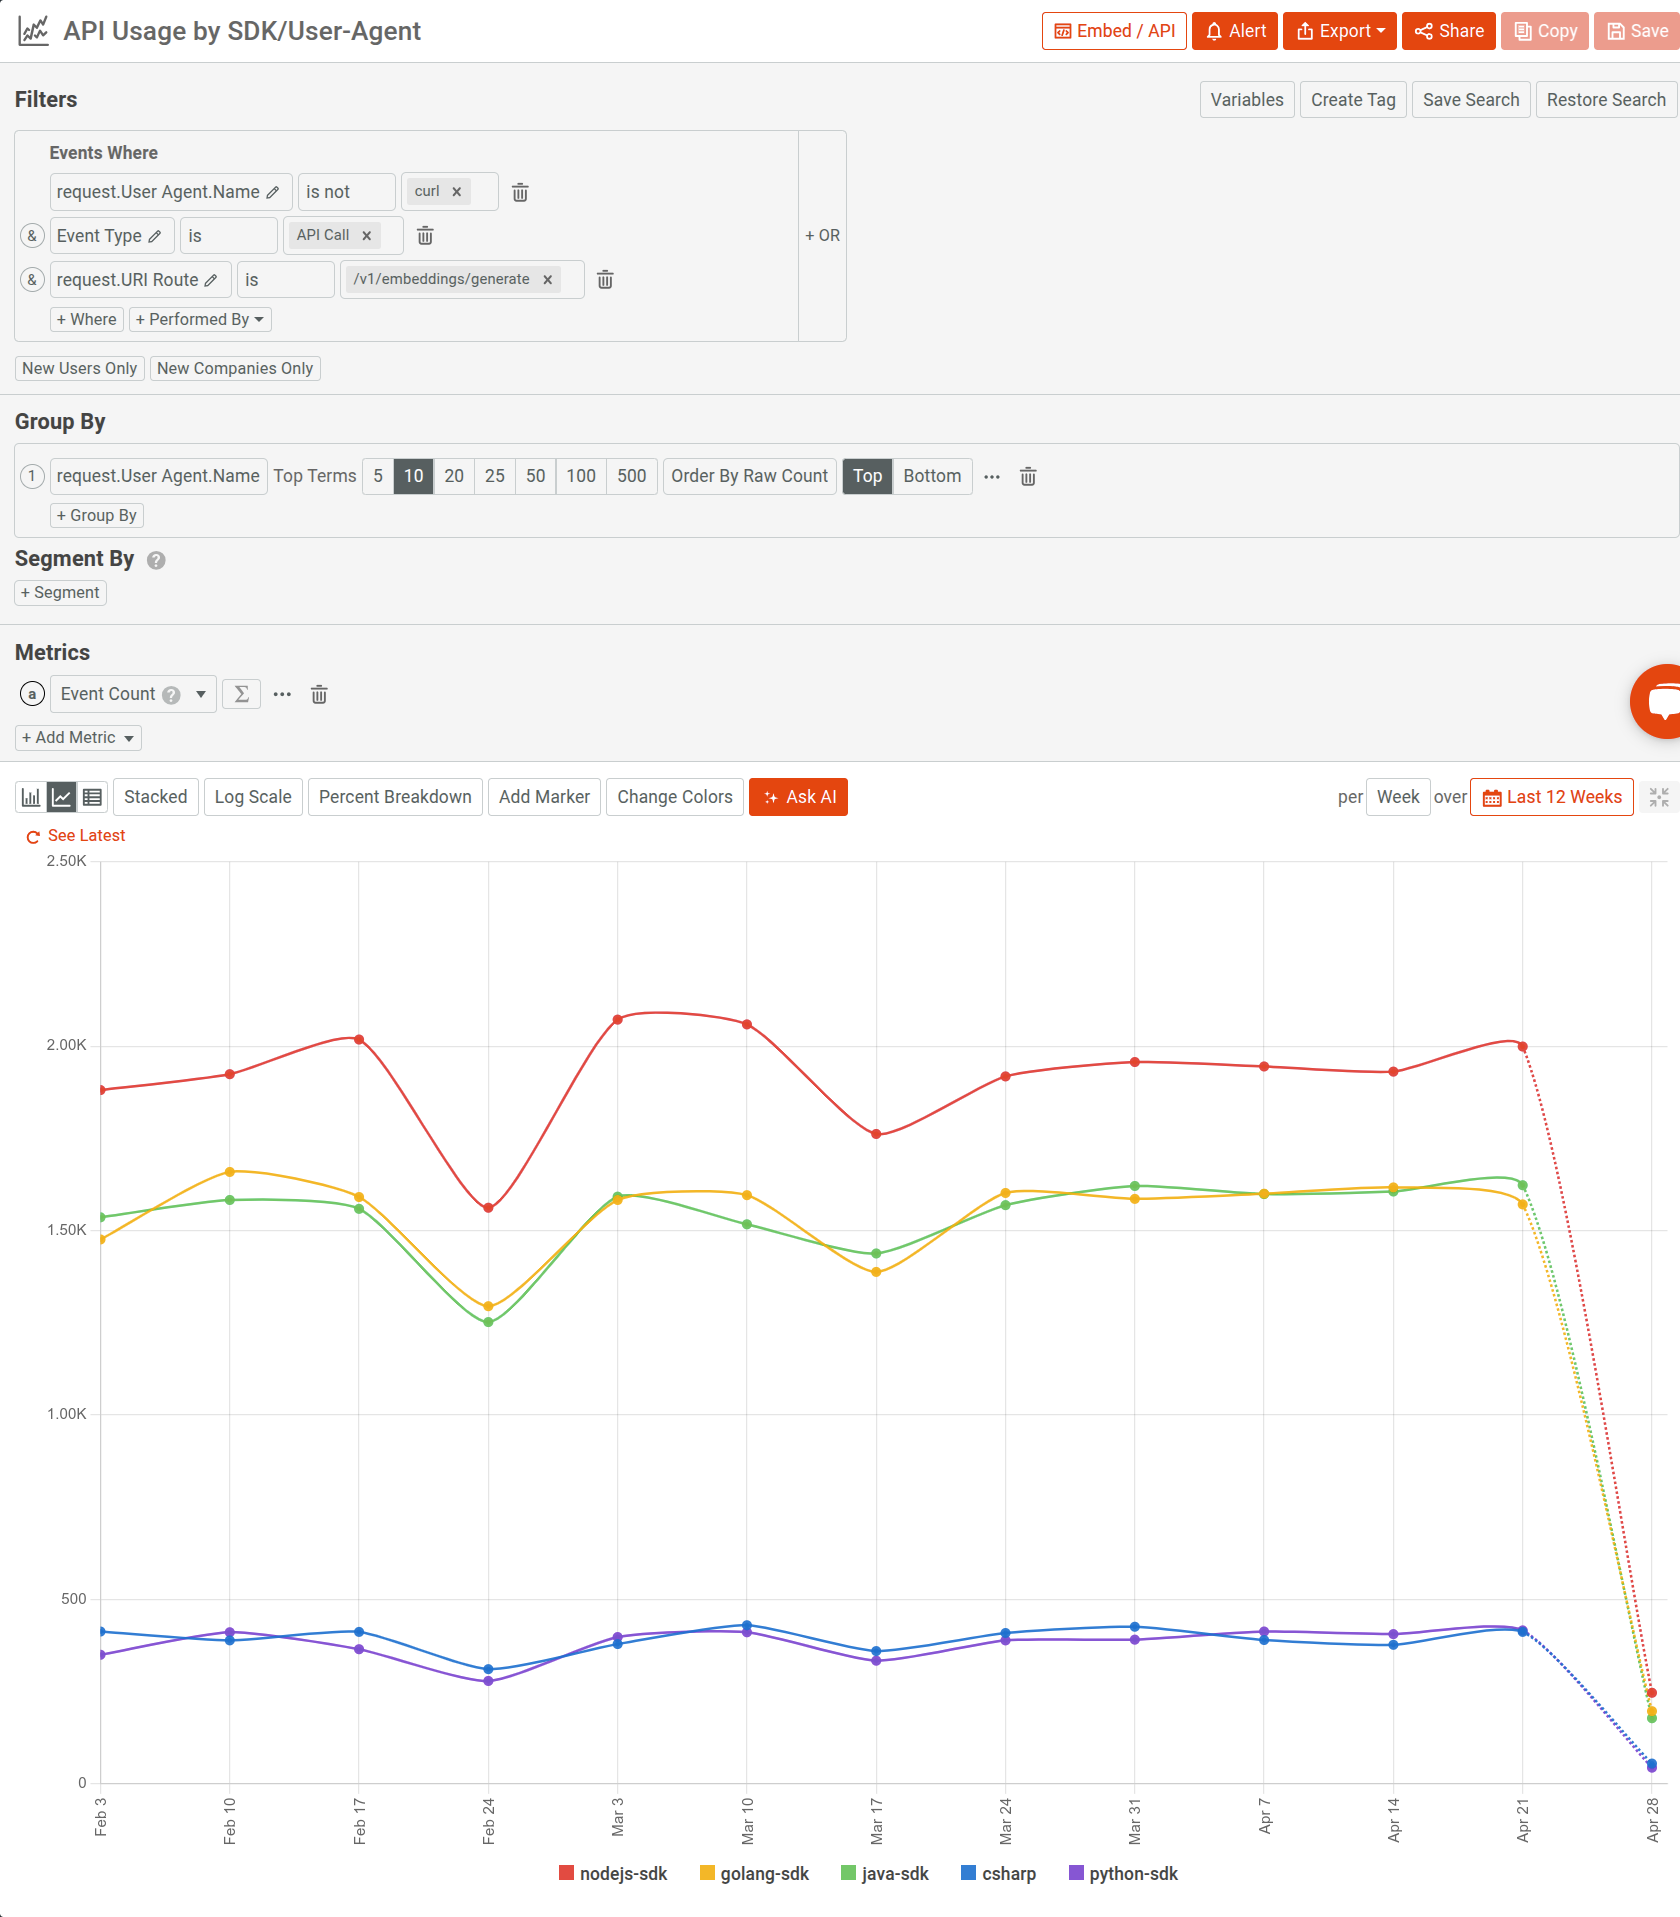
For example, the following analyzes usage across different user agents and SDKs in an embeddings API:
Request Volume and Traffic Distribution
Moesif enables full visibility into request volume trends over time. You can visualize traffic growth, monitor load distribution across endpoints, and detect usage spikes that might require scaling decisions. For example:
- Which API routes account for the majority of traffic?
- Has usage changed after a product launch, SDK release, or API version update?
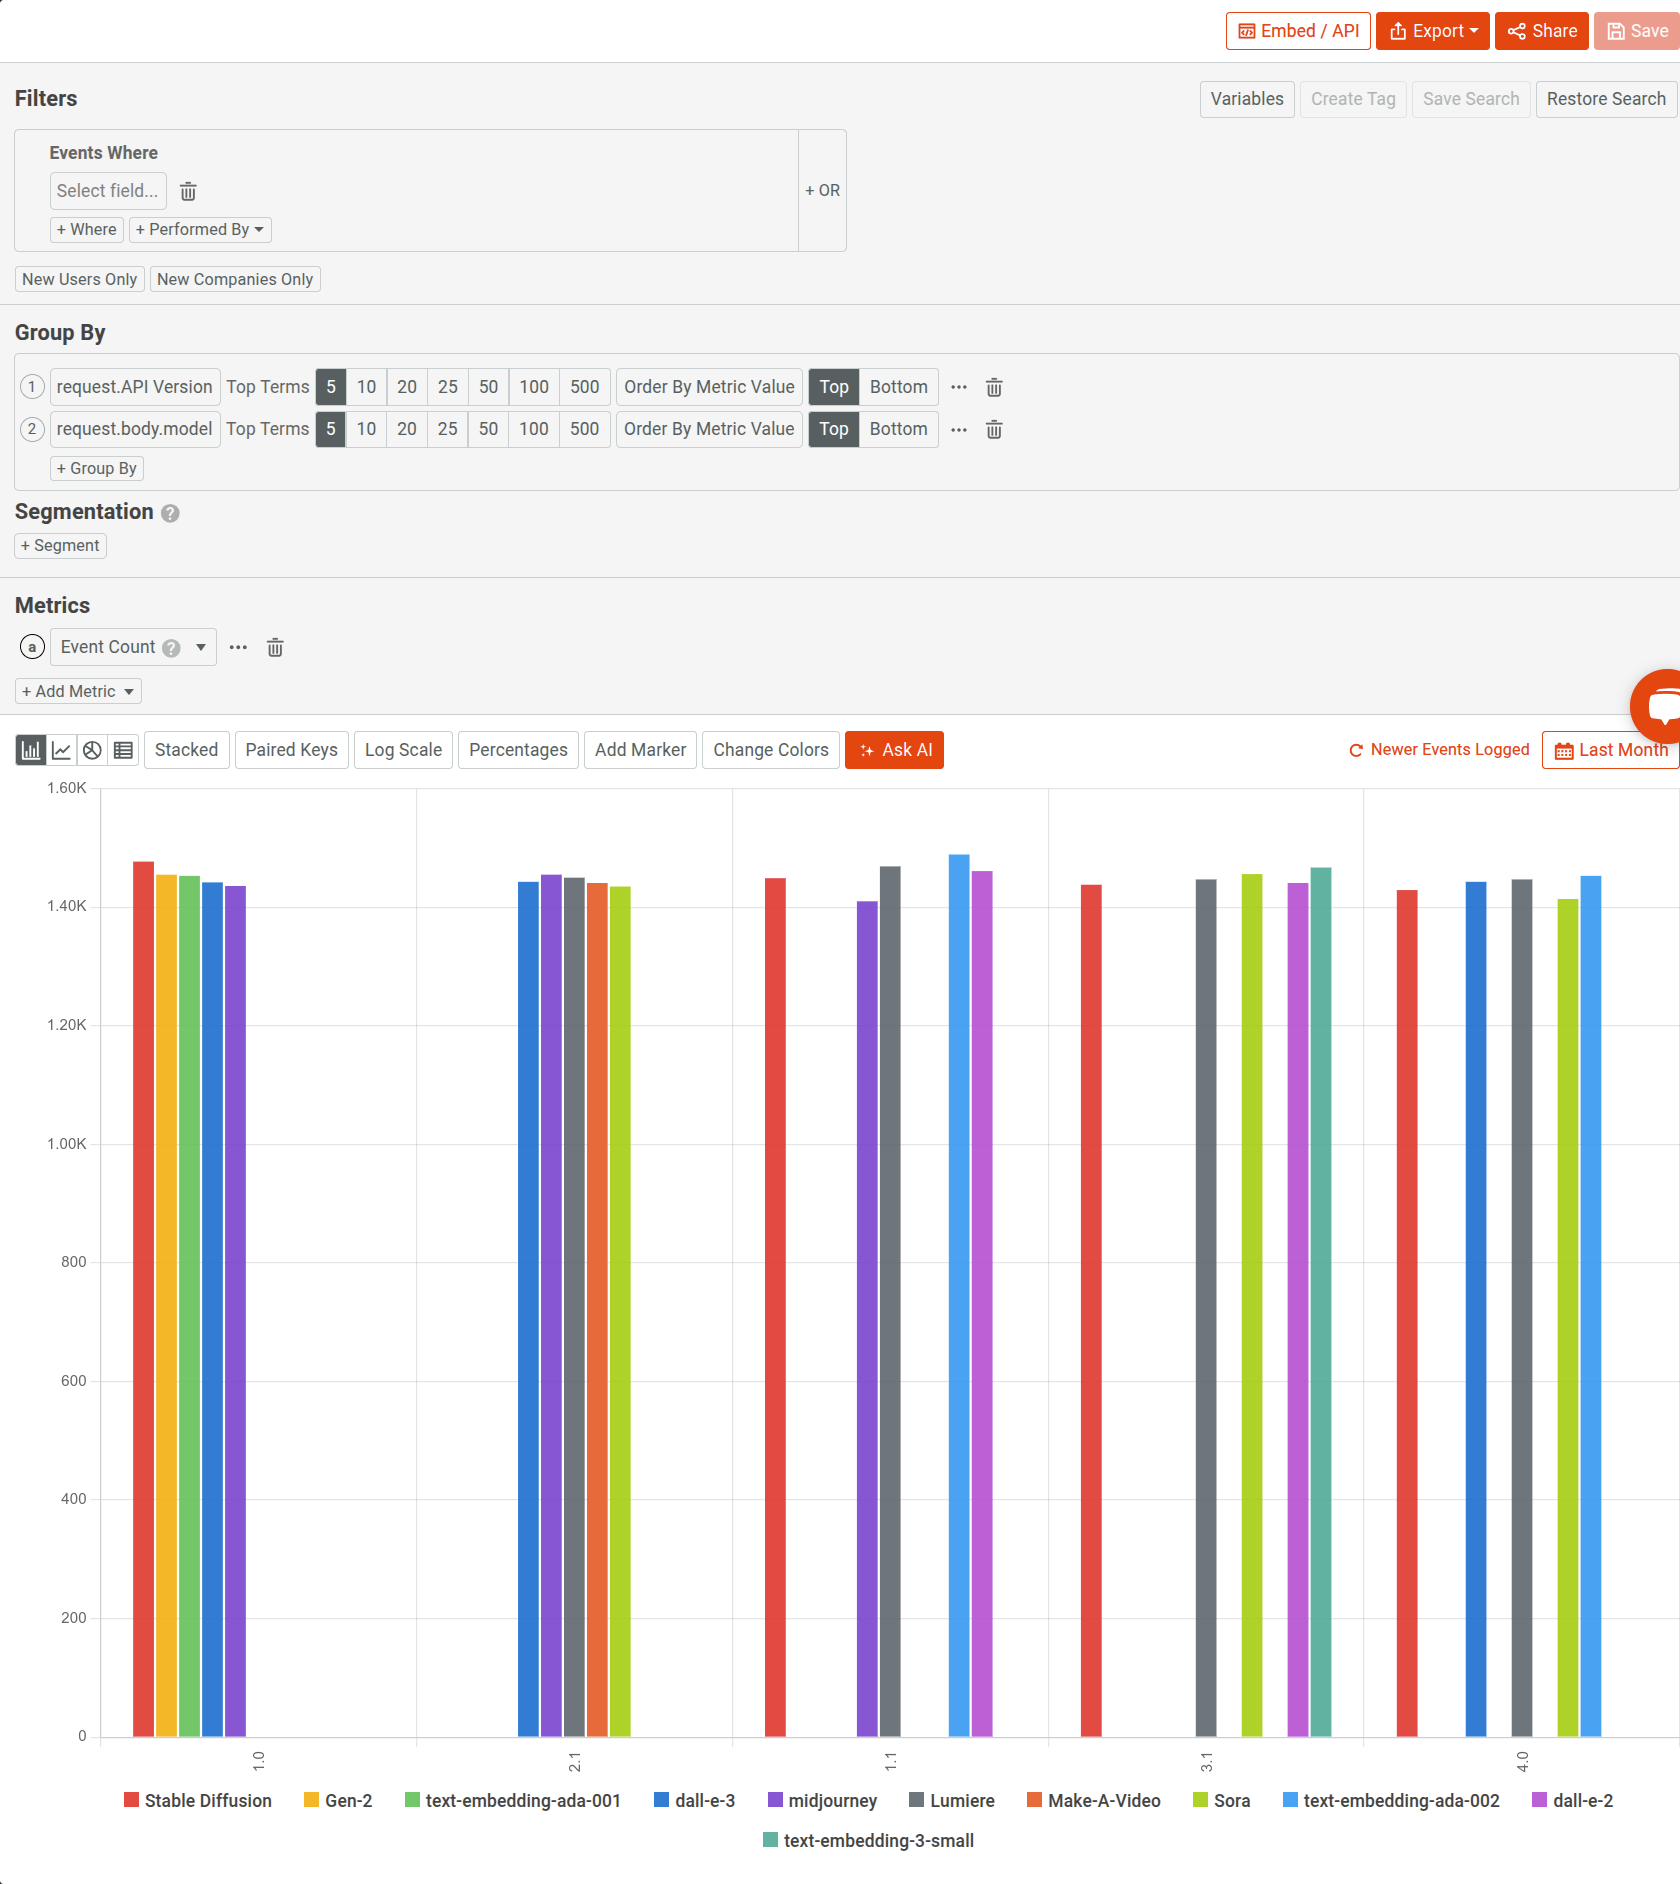
The following Segmentation analysis breaks down request volume across API versions and different models for an AI API product. The first chart visualizes the analysis in a bar chart and the second one shows the data in tabular form.

Conclusion
NGINX OpenResty offers the speed and control developers need—but alone, it leaves too many blind spots in production. Moesif fills that gap with the necessary visibility to operate APIs with confidence by turning raw API activities into structured, actionable insights, with a few lines of configuration.
This level of visibility doesn’t just help with better debugging. It shortens incident resolution, improves system reliability, and informs smarter platform decisions—especially at scale. For teams maintaining high-throughput APIs, Moesif extends NGINX even farther and makes observability at the edge more accessible and easier.


