Live Event Log
This document explains how to use Live Event Log metrics in the Moesif’s API Analytics suite.
Overview
Live Event Log shows a real-time continuous record of all the API events and actions that take place within your application or services. The Live Event Log allows you to filter on specific attributes within the API Calls and Actions event types Moesif receives. The Live Event Log gives you an easy-to-navigate way to explore user-centric insights into API usage and user behaviors on your platform.
Use Cases
Searching and filtering in traditional logs can pose significant difficulty to get past. Moesif supports extremely simple or complex queries with ease. Moesif allows you to build queries based on the data that exists in the logs. This replaces approximations and assumptions with precise calculation and statistical insights that give you immediate value and utility. For example, if you filter on an endpoint, Moesif automatically populates the filter list with the endpoints that exist in the current data.
Moesif also supports performing analytics on HTTP body and header, meaning you can have a Moesif filter based on a specific body field and its contents. This level of granularity is one of the reasons Moesif stands apart from other API and product analytics platforms.
The following sections discuss some example use cases and applications of Live Event Log.
Real-time Monitoring
Live Event Log gives you real-time visibility into different types of events going on in your website or application. With this real-time data, you can do the following:
- Monitor inbound and outbound events.
- Track user activity.
- Identify network issues.
- Understand traffic growth.
Debug and Troubleshoot API Issues
Moesif’s Live Event Log helps you instantly diagnose API issues. Instead of manually digging through logs or waiting for batch analytics, you can watch live API calls, inspect headers, and analyze payloads as they flow through the system.
For example, if you observe failed API requests, with Live Event Log, you can start investigating:
- Filter API traffic by status codes like
4xxclient errors and5xxserver errors to find error patterns. - Inspect request bodies and headers to identify missing parameters or auth issues.
- Compare responses between successful and failing requests to pinpoint inconsistencies.
Create Live Event Log
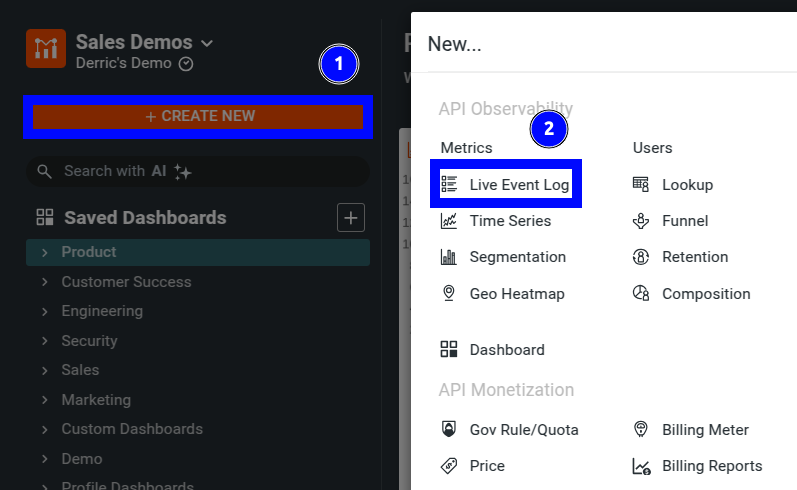
To create a new Live Event Log, select + Create New in the navigation menu and then select Live Event Log from the API Observability section.
This creates a new Live Event Log workspace for you.
Filters
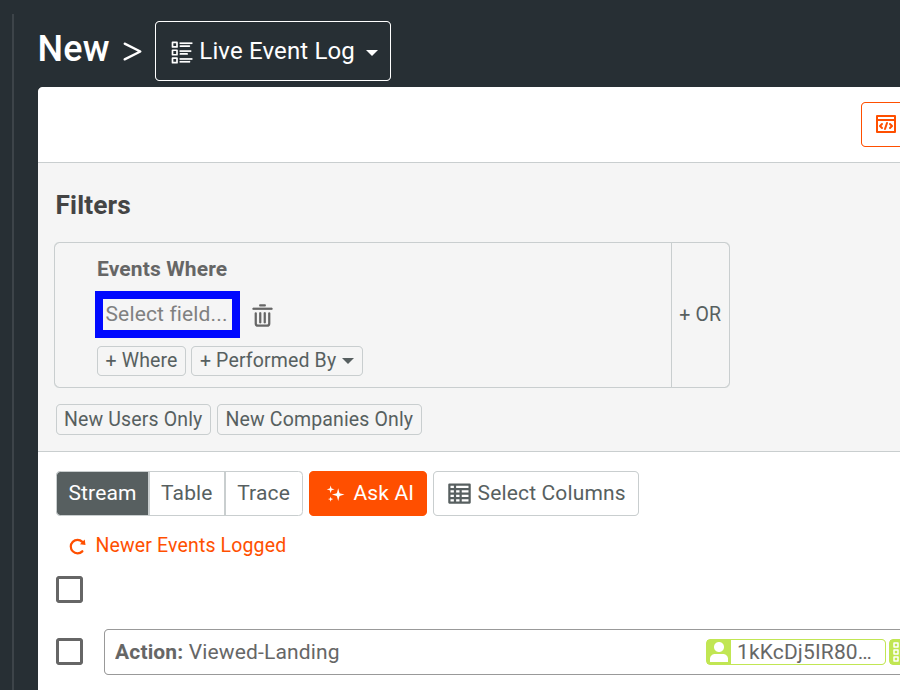
You can refine the events Live Event Log shows you using filters. To access the filters, select the Select field list in the Filters pane.
For more information about the available filters in Live Event Log, see Reference: Analytics Filters.
You can chain multiple filters together by selecting Where and OR.
Filter By Cohorts
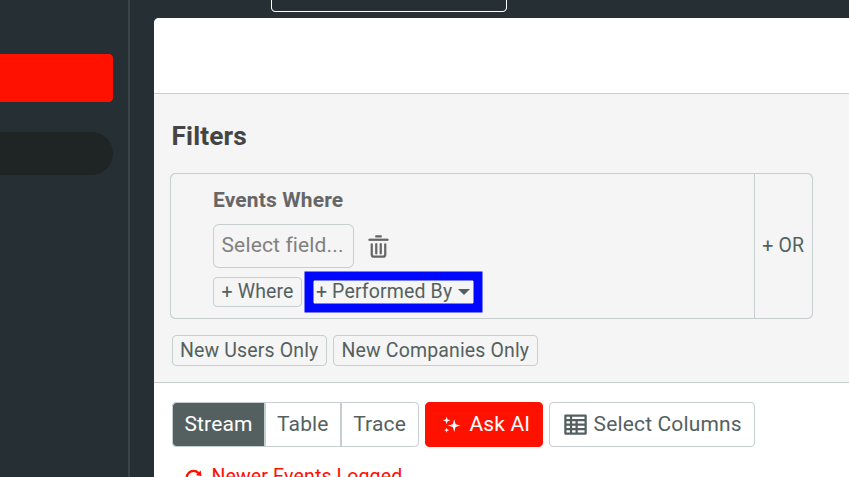
You can further refine your event log by selecting a user or company cohort from the Performed By list:
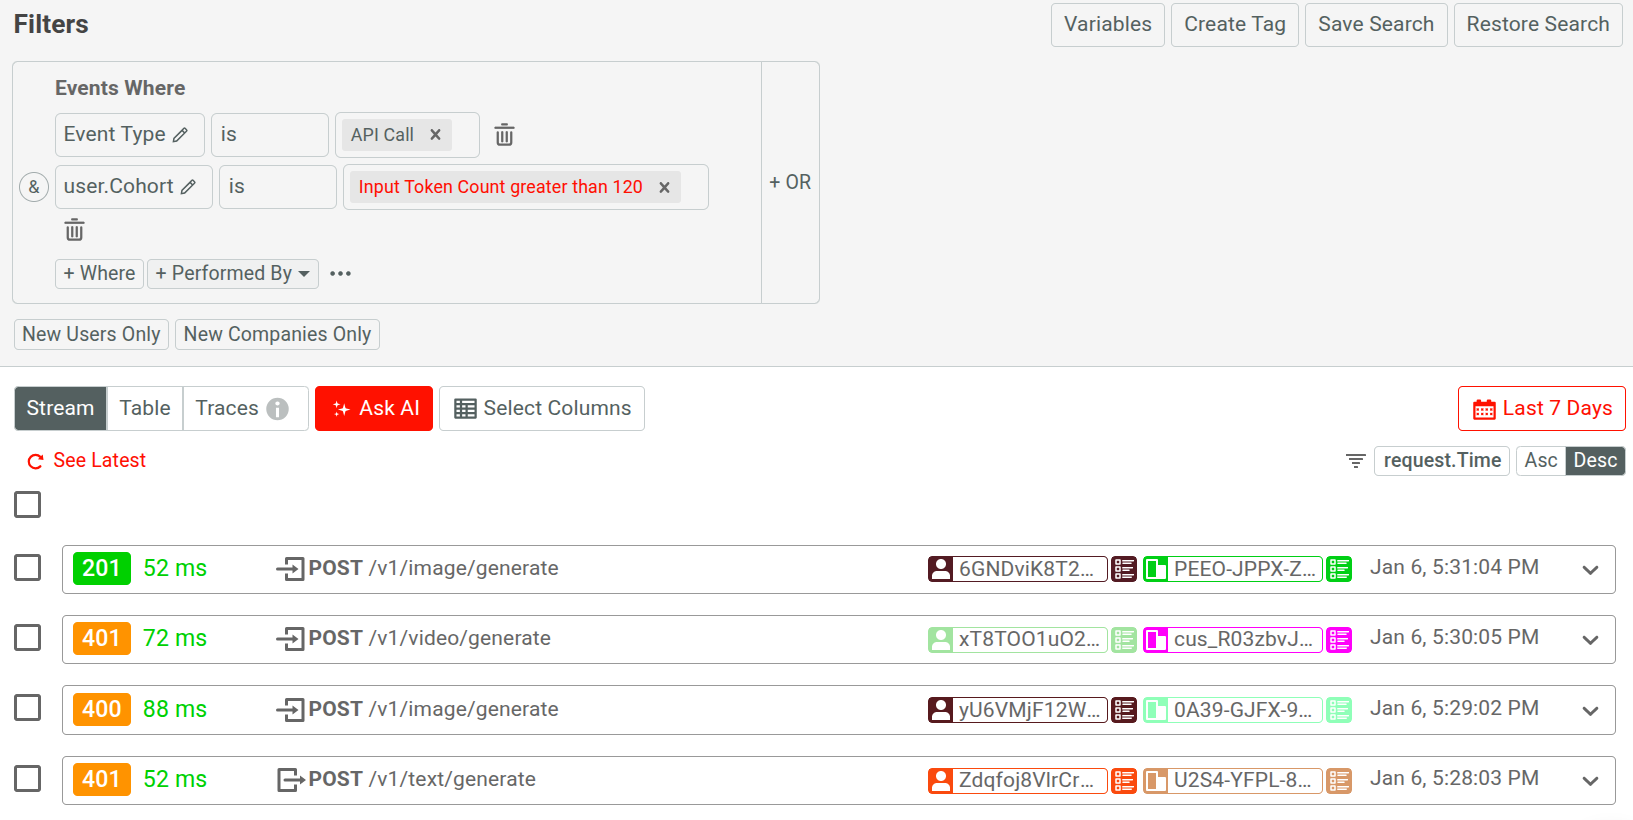
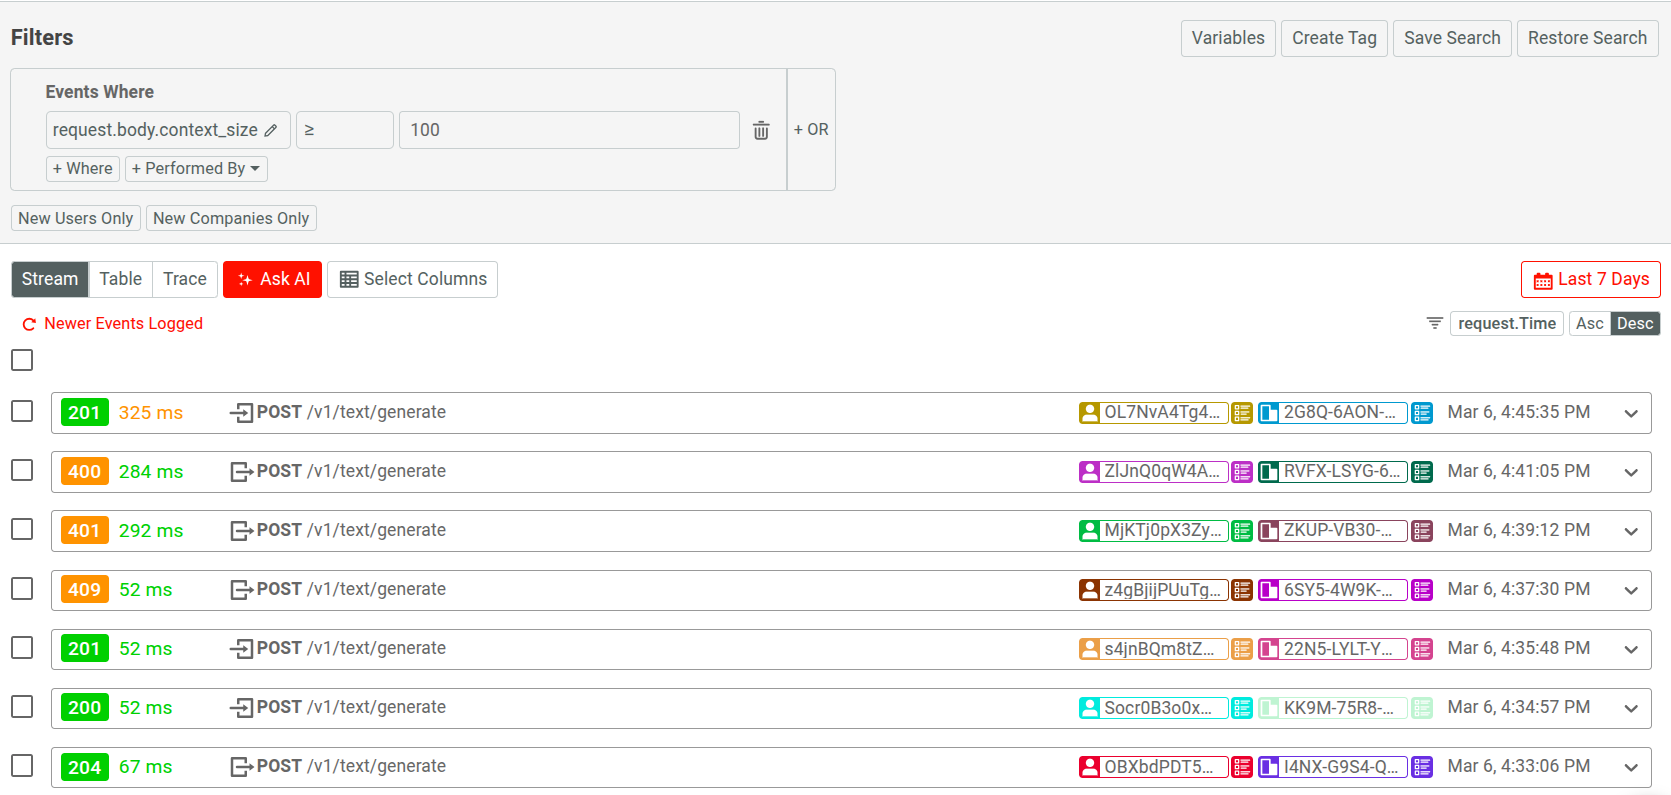
This allows you to observe events for specific customer cohorts—for example, new users that have been encountering errors or events for enterprise customers. For example, the following displays API calls for customers exceeding a specific input token amount:
Inline Cohorts
Use inline cohorts to define a cohort criteria directly in your Live Event Log workspace. This allows you to instantly refine your analysis when you don’t already have an existing cohort to filter by.
To define an inline cohort, select Performed By and then select + Inline User Cohort or + Inline Company Cohort. It opens up a new dialog where you can define a cohort criteria using customer and event filters.
Analytics and Filtering on HTTP Payload
Moesif allows you to define filters on and analyze HTTP bodies, even for deeply nested structures. For example, here we observe events with large context size in an AI API product:
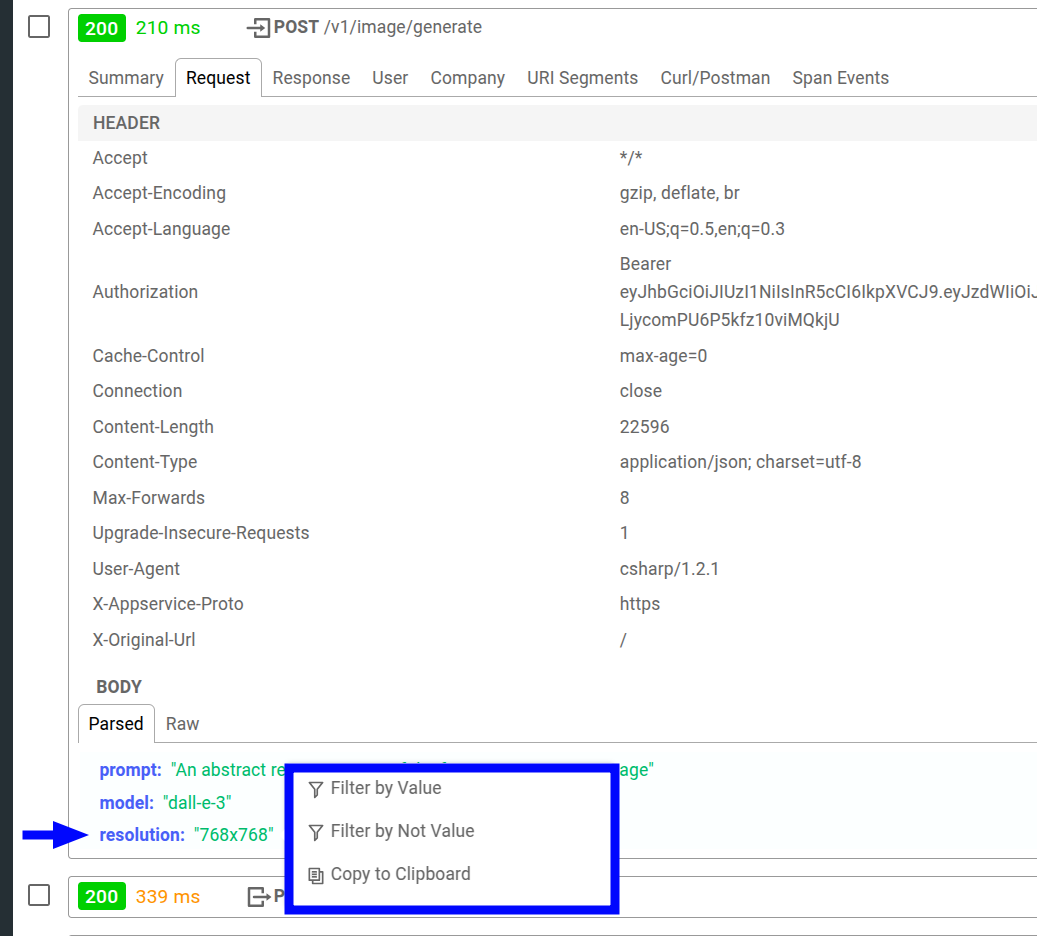
You can also select a specific body field key or value and choose to define filters directly
from there. For example, here we’re interested in the image resolution data in the
request body for an API call in an image generation API. If we select one of the
filtering options, Moesif includes or excludes API calls that have requested to generate
768x768 resolution images.
For more information about interacting with event data fields this way, see Event Data Field Options.
Named Variables for Filters
You can define named variables that hold filter values and then use it across filters.
To add filter variables, select Variables. Then select Add Variables to define a variable. After defining your variables, select Save.

To use a variable, enter the variable name enclosed in double curly braces in a filter value. For example:

You must manually enter the variable name this way to use it. You can quickly check defined variables by hovering over Variables—the tooltip shows the defined variables and their values.
This feature allows you to avoid manually updating filter values in complex and dynamic filtering scenarios.
View Events for New Users and Companies Only
To see events for only new users and companies in Live Event Log, enable the New Users Only and New Companies Only filters respectively. These two filters allow you to see events for users or companies who’ve made their first API call within the time period you specify.
Event Data Views
You can change how Live Event Log displays event data. The following options are available:
Stream View
The stream view shows each API Call or Action as an interactive element that you can expand for further details about the event. By default, each element displays the following information about an event:
- The HTTP response status code
- Elapsed duration of the HTTP request
- The HTTP request method
- The endpoint
- Any identified user or company associated with the event
- The time of the request
To turn on this view, select Stream. Expanding an element shows more details about the event.
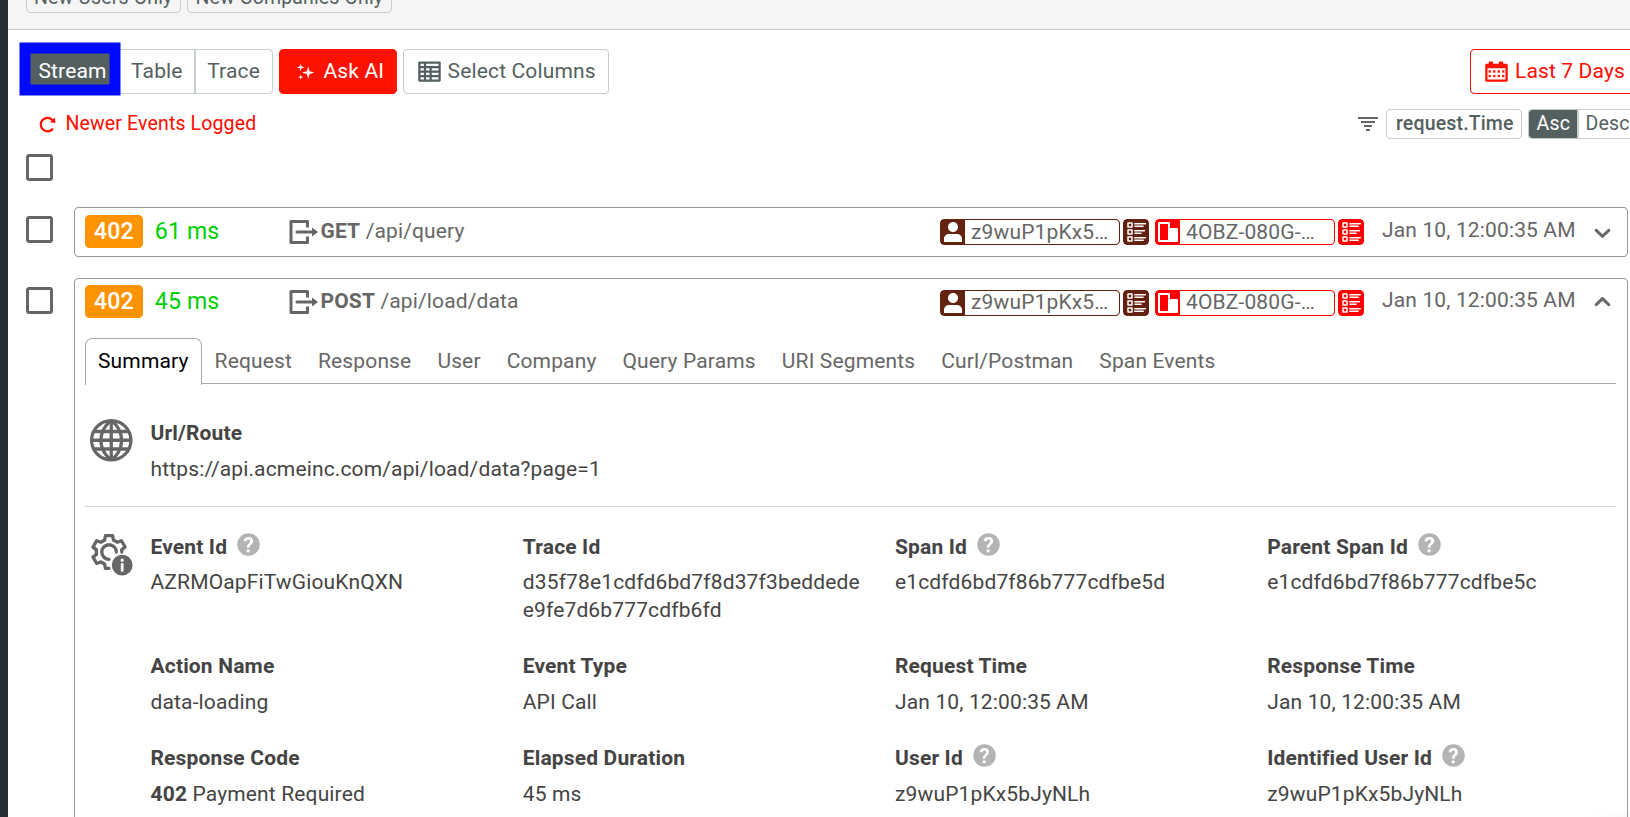
If you’ve instrumented your API with OpenTelemetry and set up the Moesif-OpenTelemetry server integration, the detailed view also displays the associated trace and log data like trace ID and span ID.
Add Custom Fields to Display
To display more data fields in the stream view, select Select Columns and specify the fields. For example, you can select Request.Geo IP.Country as your custom field. Now in the default stream view for each event, the country where the request originates from appears.
Event Log Actions
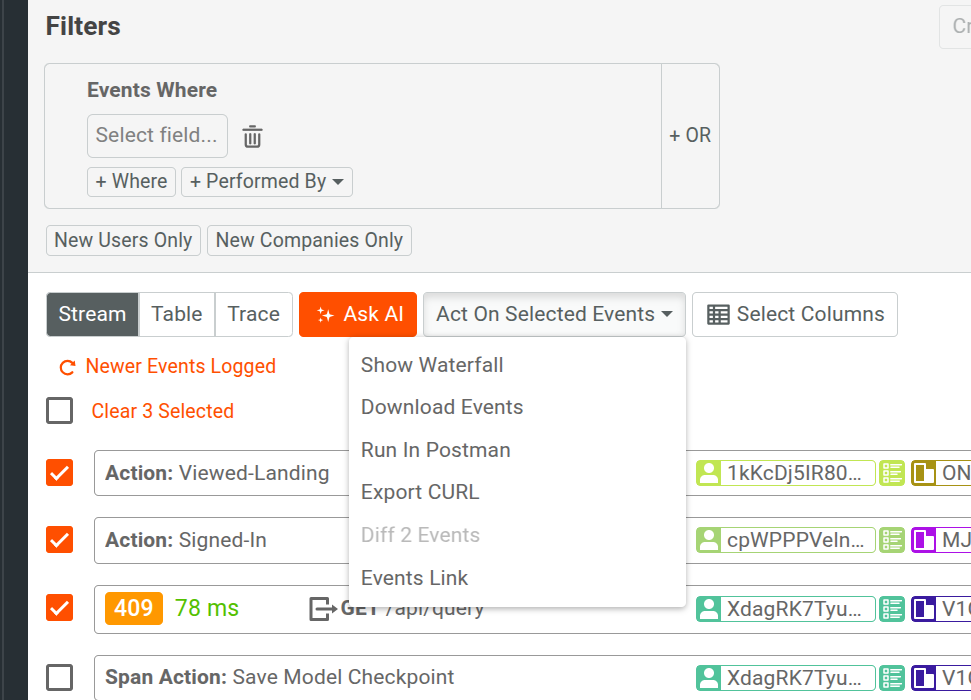
When you select one or more events by selecting the checkboxes, the following additional actions become available in Act On Selected Events dropdown menu:
- Viewing Waterfall chart
- Downloading event details
- Running API calls in Postman
- Exporting cURLs
- Comparing two events
- Sharing events with teams
- View Waterfall chart
- Select the Show Waterfall to generate a waterfall chart for the selected events. While the waterfall chart remains in display, you can keep selecting or clearing the event checkboxes and the chart changes accordingly.
- Download event details
- Select Download Events to export details of the selected events as a JSON file.
- Run API calls in Postman
- Live Event Log allows you to generate and export a Postman collection containing the API calls for selected events. This can help tremendously in API testing and debugging. To do so, select Run in Postman and then select Download Postman Collection.
For more information, see Replaying API Calls in Postman.
- Export cURL commands in a bash script
- Select Export CURL to export the cURL commands for the selected events as a bash script. This allows you to query the event data from your terminal or use the commands in tools like Postman.
- Compare two events
- Live Event Log allows you to compare the request and response of two different API calls. This comes in handy in scenarios such as debugging issues within an API call. Then you can check the difference between a successful call and the one causing an error. To do so, select two different events and then select Diff 2 Events.
Moesif marks the additions and subtractions in green and red background colors. Moesif finds differences in the entire HTTP request and response cycle. This includes HTTP headers and any JSON body to aid in debugging.
- Share events with team
- To quickly share selected events with your team members, select Events Link. Then copy the link.
Table View
The table view shows the event data in a tabular format, similar to a spreadsheet. By default, the table contains the following information for each event:
- The event ID
- The time of the request
- Elapsed duration of the HTTP request
- The HTTP response status code
- The endpoint
- The HTTP request method
- The identified user ID or company ID
- Creation date for the user or company
To turn on this view, select Table.
Specify the Columns to Display
To specify the fields you want to display in the table view, select Select Columns and specify the fields from the Add a data field list. Then select Save. You can also remove a field from view by selecting X beside the field name.
Add Custom Columns to Display
You can also add a custom column containing calculated data from the table by selecting Add equation.
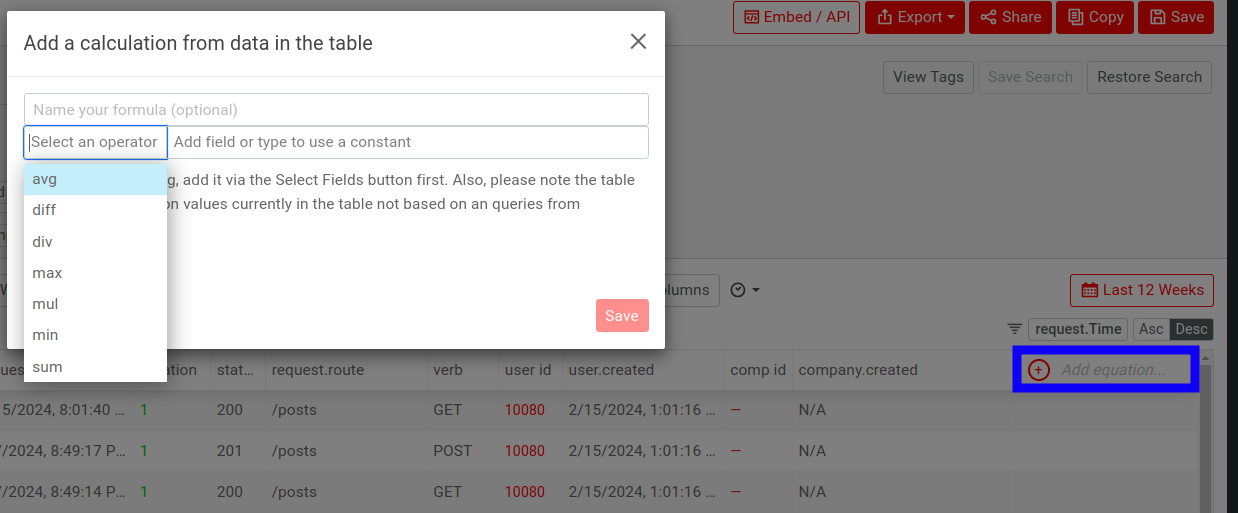
You must specify the operator for the calculation and the operands. For the operands, you can choose one or more fields from the list or specify constants.
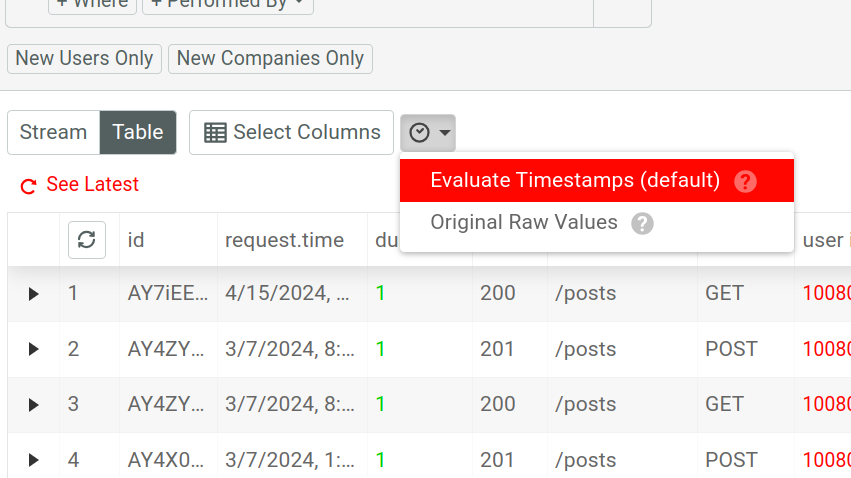
Timestamp Values
In table view, Moesif parses the timestamp for each event into human-readable format in your timezone. To display the raw timestamp values in ISO 8601 format instead, select Original Raw Values.
Traces View
The Traces View shows you traces and log data Moesif captures if you have integrated OpenTelemetry.
For more information, see Trace Explorer.
Event Data Field Options
You can interact with individual event data fields and field values in your Live Event Log workspace:
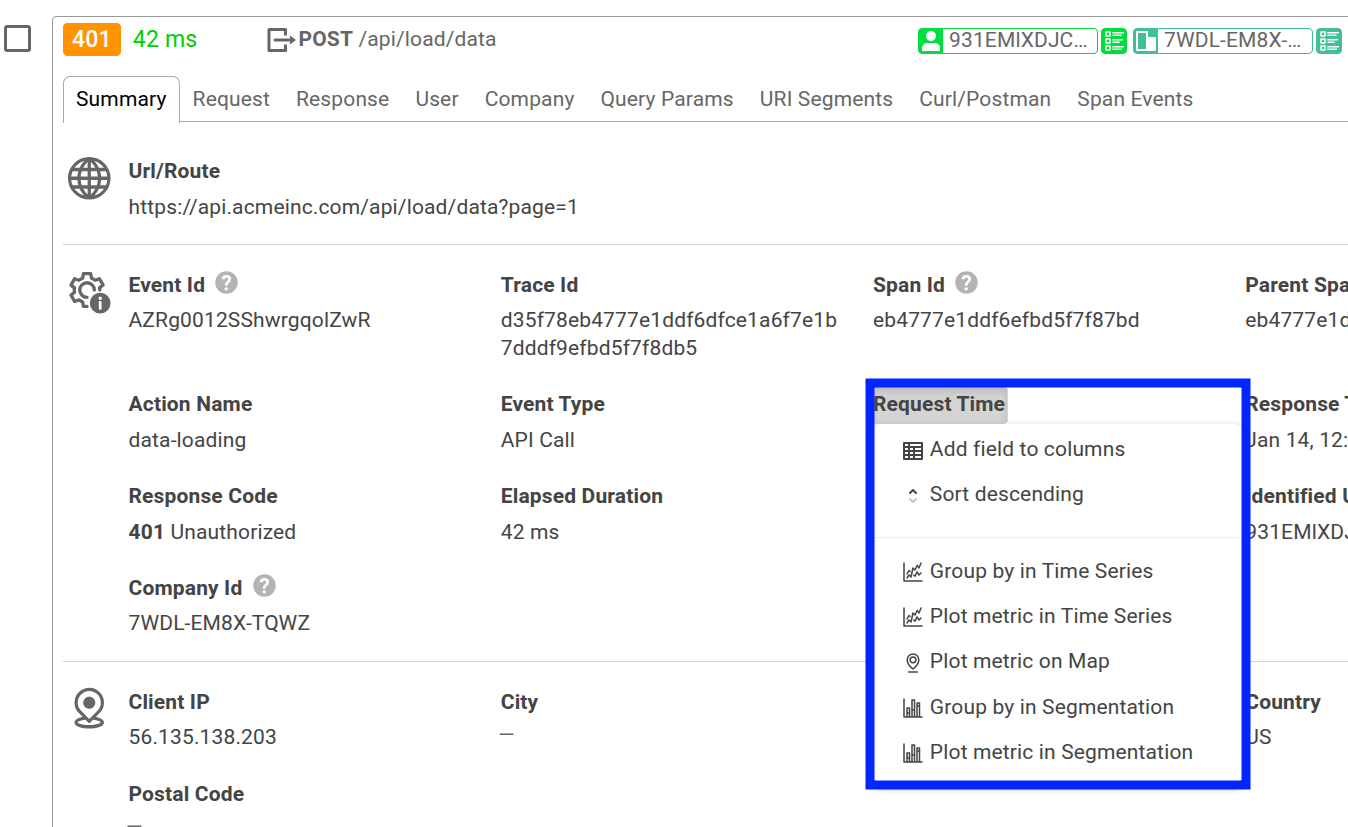
In the dropdown, you can view more detailed information about the data element and perform further actions on that specific data. For example, you can filter and sort, plot the data as a metric in a different chart, and so on.
Save and Share
Moesif gives you several options to share a Live Event Log workspace. Before you can share, you must first save the workspace to a dashboard.
After saving, follow the instructions in Sharing Workspaces to share your workspace.
AI Explain : Use AI to Get Insights About Event Metrics
AI Explain gives you an AI-powered conversational interface where you can ask questions and gain insights about event analytics data.
In a Live Event Log workspace, select Ask AI to open up the interface. By default, Moesif selects the first 30 events as target events for the AI to analyze and answer your questions about. You can also select a custom number of events and then select Ask AI. You can select a maximum of 30 events at a time.
To get started, you can choose from three sample prompts. Otherwise, type in your query and press Enter.