Creating a Dashboard
This guide assumes you are familiar with Dashboards already. If not, please review our high-level docs on API Dashboards.
Moesif does not have any limits on the number of dashboards you can create. Each dashboard can contain an unlimited number of workspaces within it.
Creating a dashboard
To create a dashboard, you have the following two options:
-
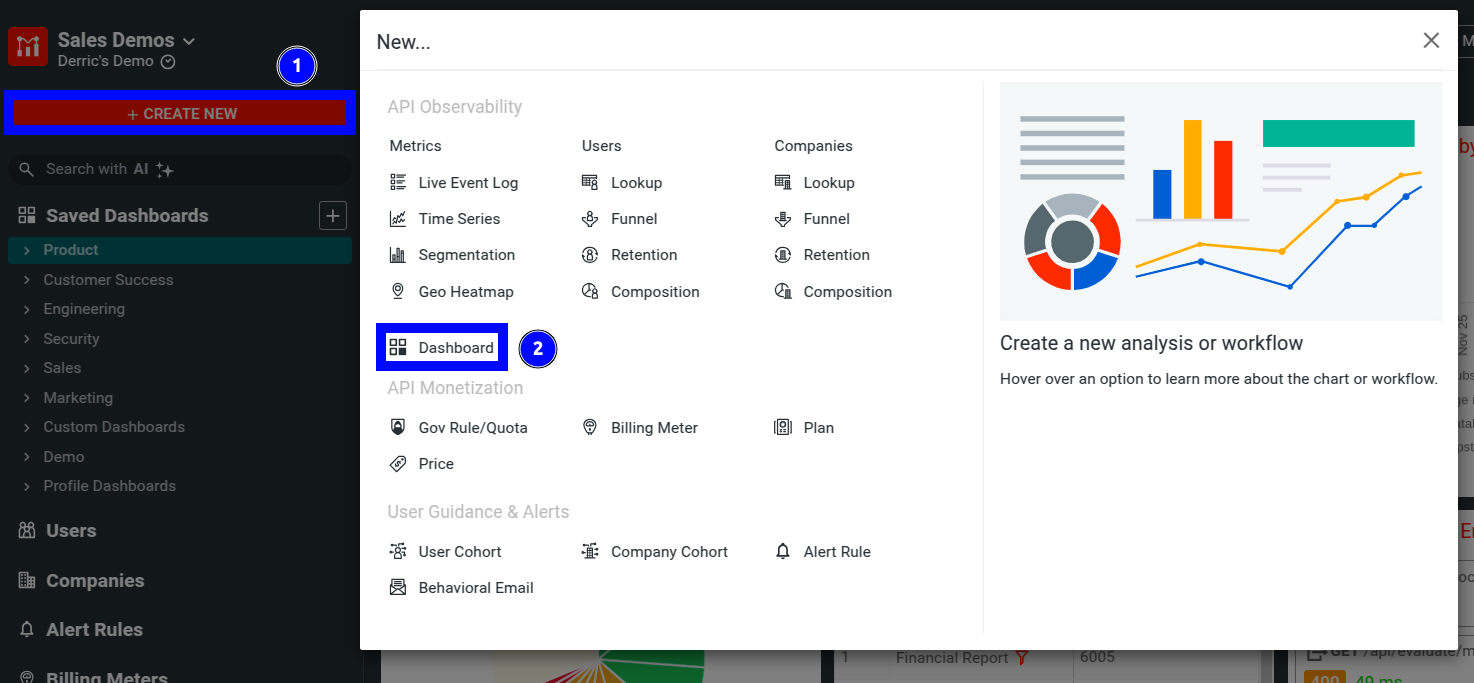
Select + Create New. In the modal that appears, select Dashboard.
![Creating a dashoard through the create new button]()
-
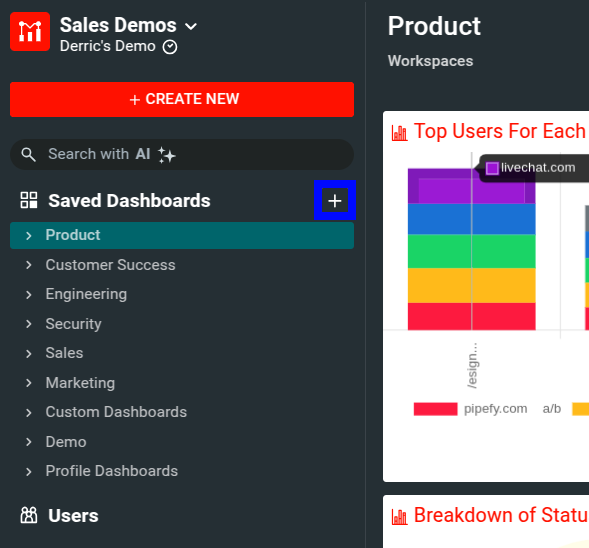
Select + Add New Dashboards beside the Saved Dashboards menu item.
![Creating a new dashboard]()
Saving a workspace to a dashboard
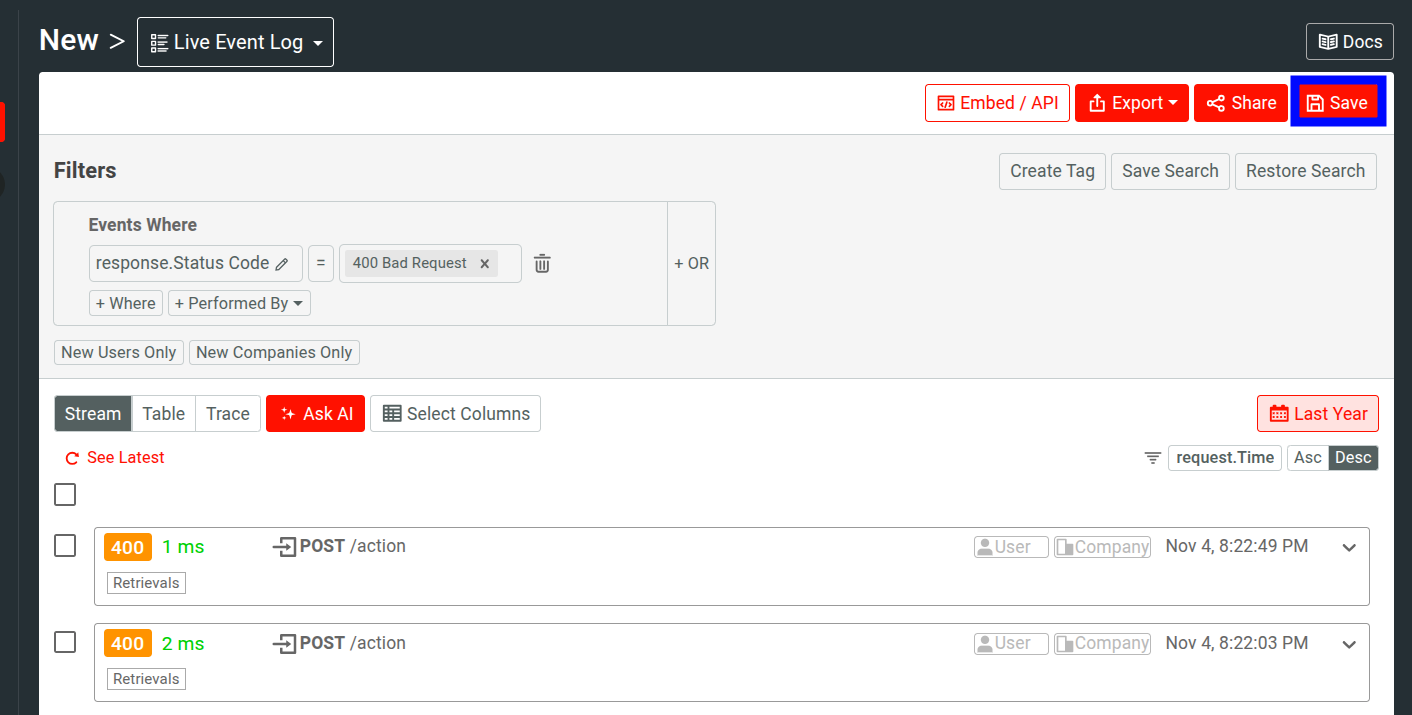
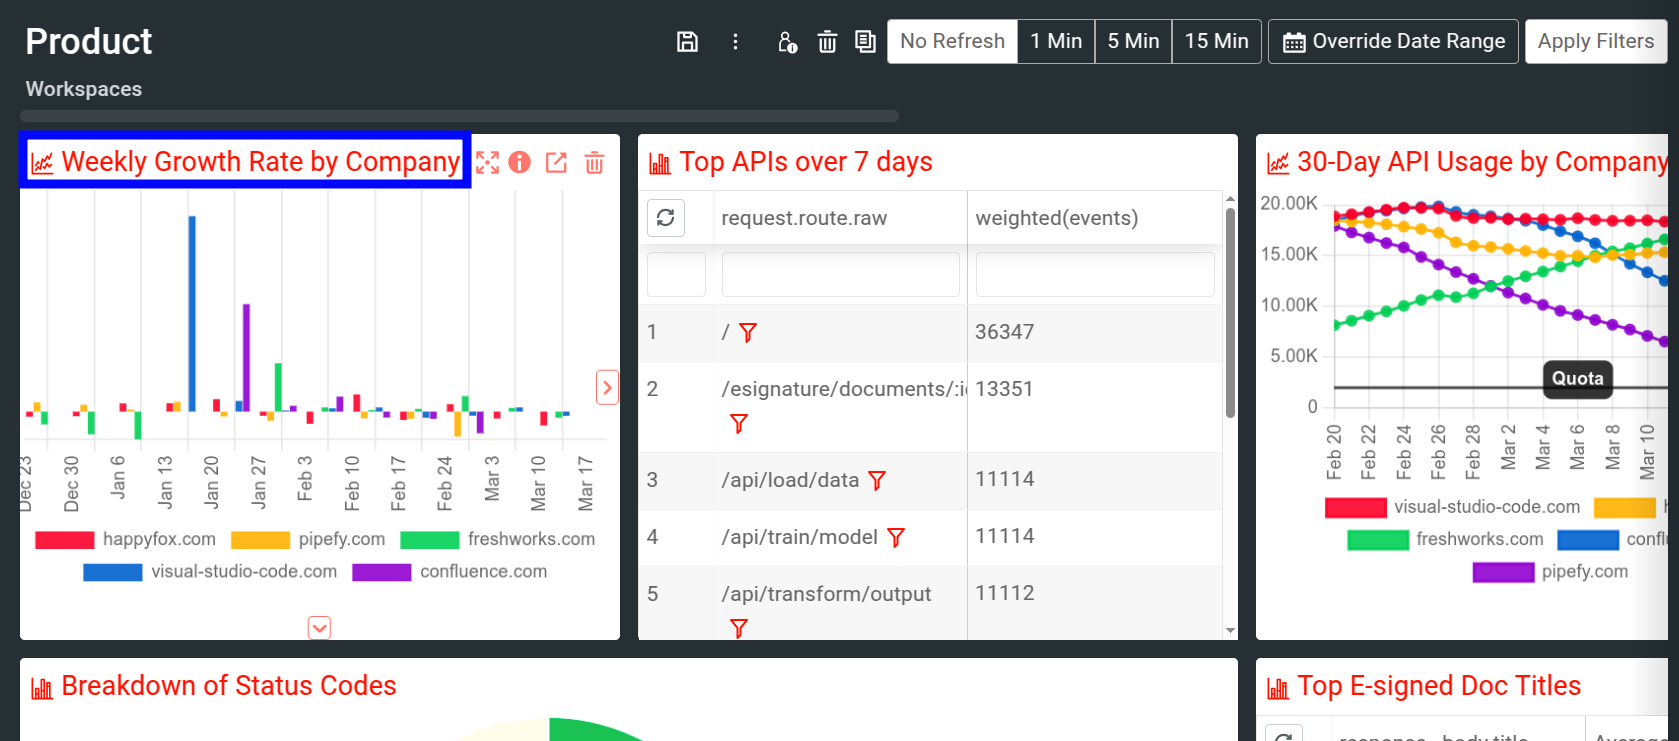
You can save almost every chart you see in Moesif to a dashboard. This includes live event logs, time series, bar chart, heatmap, and funnels. To get started, navigate to the Users or Companies screen to start a new analysis. Within the chart view, set up the filters, group by, and time range options for your chart.
Once you have created a new analysis or chart and are ready to add it to a dashboard, click the orange Save button.
The Save Workspace modal then appears, allowing you to save the workspace.
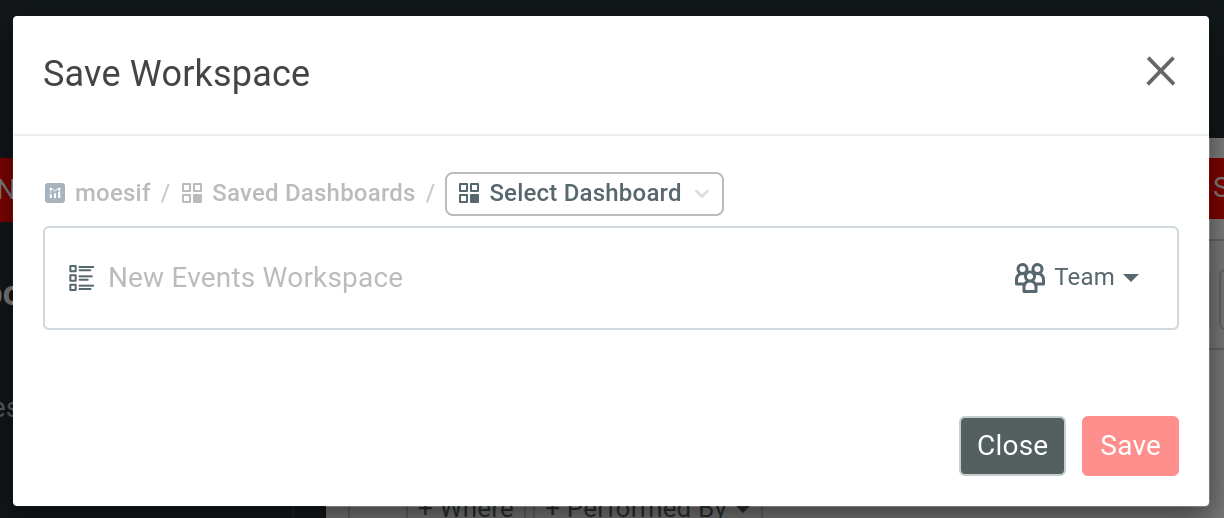
In the modal, you must choose a name for your workspace and select a dashboard to save it to. Use the Select Dashboard dropdown menu to add it to an existing dashboard or create a new one for the workspace.
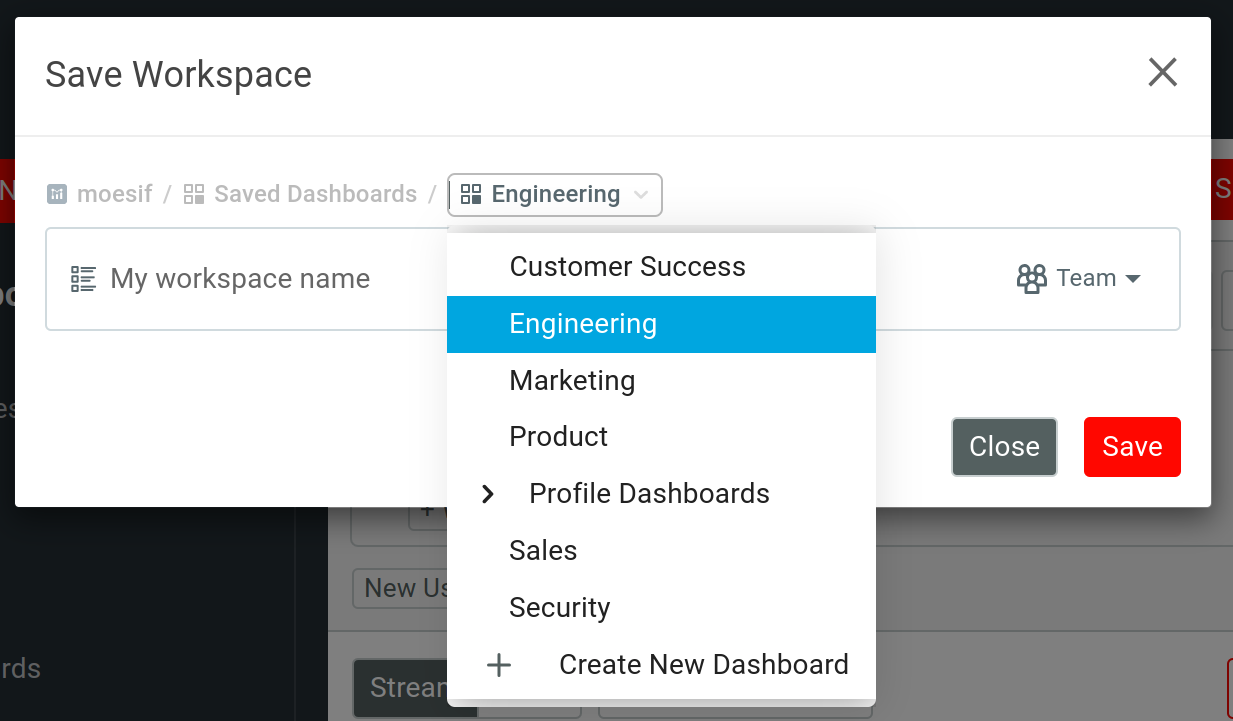
You can also set your workspace type in Save Workspace. For more information, see Types of workspaces.
If the date range is relative, such as Last 7 Days, then the chart will always be up to date for latest data. However, if you select an absolute time range, like May 1, 2021 to May 31, 2021, then the chart data will not be refreshed (unless the date range is in the future).
Edit workspace filter or metrics
In order to change an actual metric, click on the chart name in the tile to bring up the full view of the chart, log, or analysis.
From here, the filter criteria can be changed.
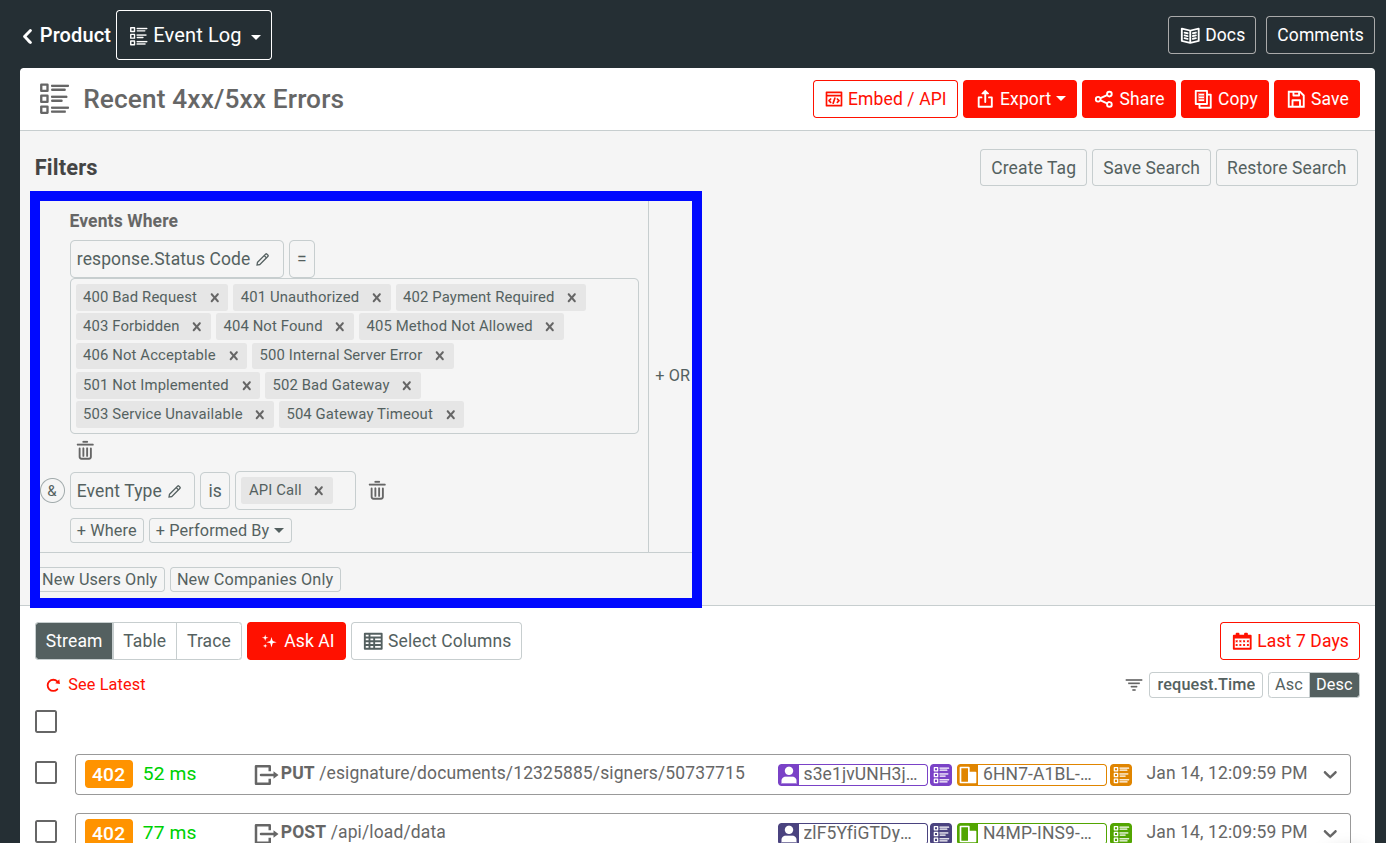
Once you made your changes, click Save in the top right.