Creating Alert Rules
This guide assumes you are familiar with Alerts already. If not, please review API Monitors & Alerts.
Example Creating an Alert Rule
The easiest way to create a new Alert Rule is to select + Create New and then Alert Rule from Customer Experience section.
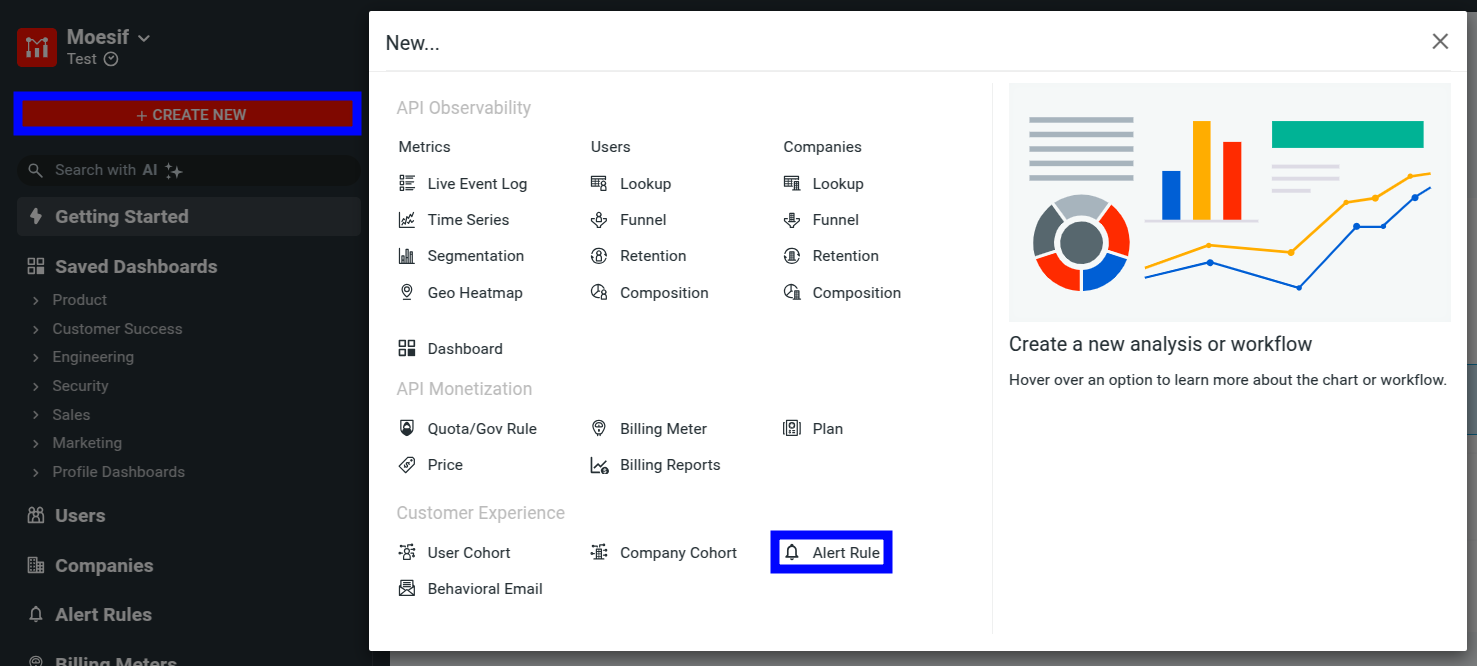
Alternatively, select Alert Rules in the navigation menu and then select + Alert Rule.
You can create Alert Rules on any time series chart in Moesif. The following example walks you through creating a dynamic alert rule to detect abnormal spikes in API traffic for an embeddings AI API.

- Select + Create New and then select Time Series to create a new Time Series analysis.
- Configure your chart’s filters, metric, and time period for what you want to monitor.
- Select Alert to open the alert configuration page.
- Configure your alert in the Create Alert Rule pane.
- Enter an alert name.
- Specify the evaluation period and frequency of your alert that dictates when Moesif evaluates the rule. By default, the alert has the same evaluation period as the time interval of your time series chart.
- Select the On checkbox to turn on the alert immediately after creating it.
- Select Dyanamic Alert.
- Specify the trigger condition by choosing a Direction. Since we want to receive alerts when API traffic abruptly increases, select Increase.
- Configure the detector sensitivity sliders.
- Pick which channels to send notifications to.
- (Optional) Specify a custom message that you want the alert to include when it triggers and notifies you.
- Select Create. A confirmation dialog appears detailing how the rule is triggered.
Since it’s important to track each customer’s experience independently, the example uses Company.Company Domain to group customers by company domains.
For more information about each of the steps in the example, see Alert Options and Alert Rule Settings.
Alert Options
Chart Filters
Any filters you add to your time series chart also be applied to the alert rule. For example, to only alert when
the response.status is 500 Internal Server Error, add a filter this way:
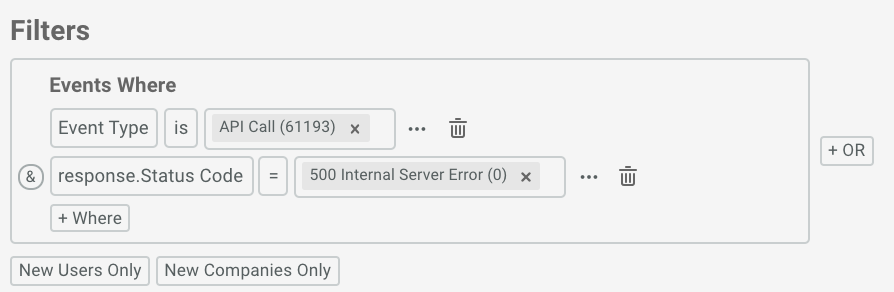
Chart Group By
By adding a group by to your chart, Moesif creates a multi-dimensional alert which means Moesif monitors each of the group by values separately. This makes it easy to create a single alert rule that monitors hundreds of different metrics without manually creating hundreds of different alert rules. For example, you may want to track a metric separately for each customer or each URI route.
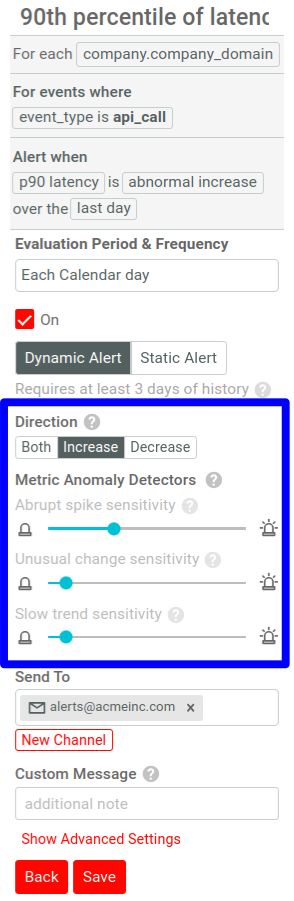
Let’s say we want to get alerts when a specific customer has a spike in latency. The alert rule then looks like the following:
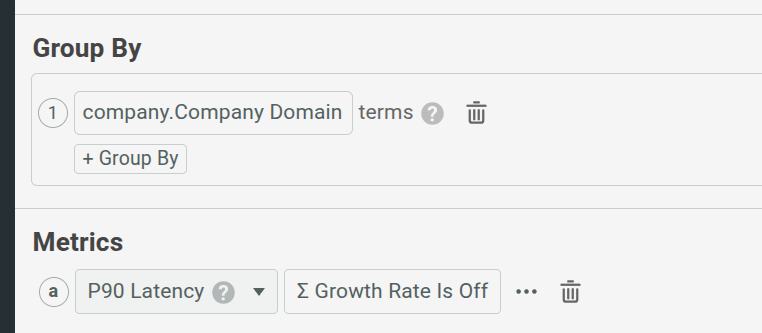
The alert criteria will be presented in the red box shown above.
Chart Metric
Moesif monitors the metric plotted in the chart. You can select one of the predefined metrics or build your own by
defininig a custom metric.
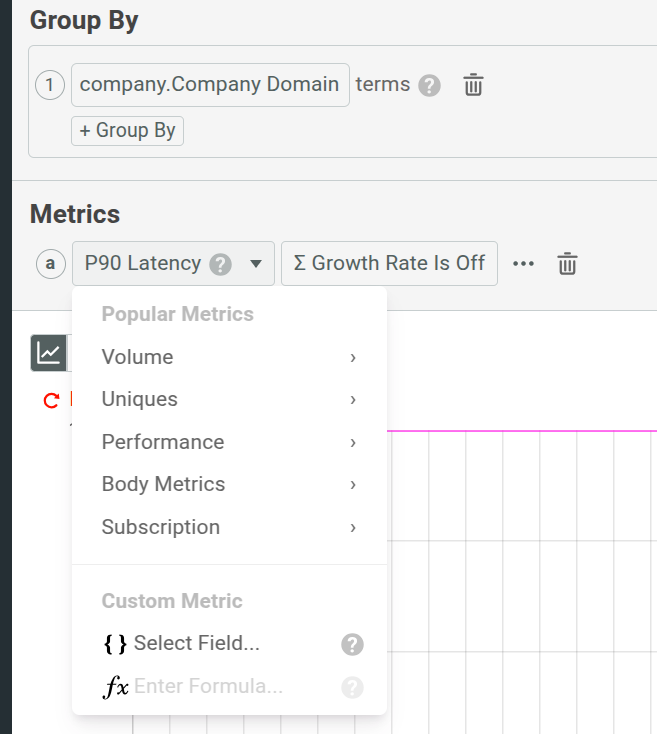
For example, here we define a custom metric to get alerts on when a customer sends an unusually large amount of data to your API which may imply abuse or a hacker:
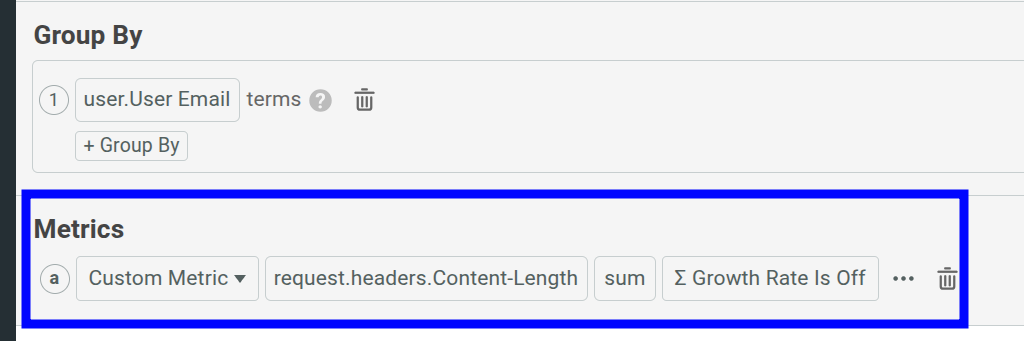
In this case, we group by User.User Email so we can track each user’s upload amount separately.
Alert Rule Settings
In addition to the chart conditions rules, you must configure additional settings in the Create Alert Rule pane.
Alert Name
Select a friendly name for your alert in the Name field. This name identifies an alert in emails and notifications.
Evaluation Period and Frequency
Alerts require an interval for the metric aggregation. Real-time Rolling and Calendar-based Rolling indicates the evaluation period type for your alert.
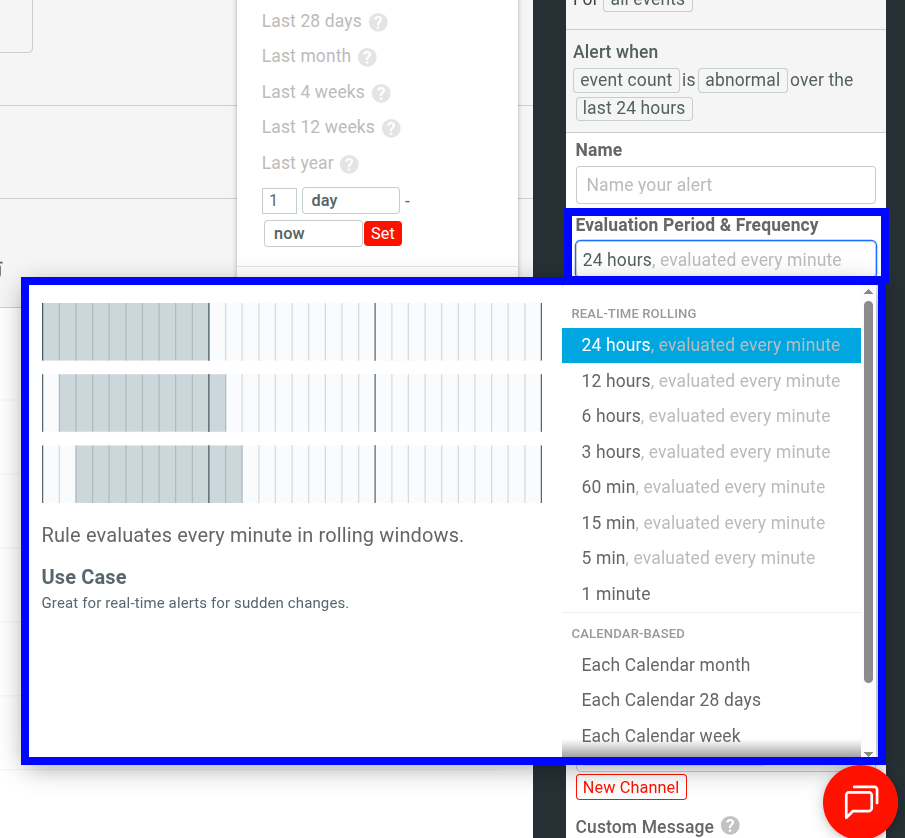
Use real-time rolling to set real-time alerts and calendar-based rolling to monitor long-term trends. For more information, see Real-Time Alerts and Calendar Alerts.
Channels
Select the channels you want to send the alert notifications to from the Send To field.
A channel is a communication method to receive notifications and make it easier to ensure the right people receive the right alerts. Moesif supports the following channel types:
- SMS
- Slack
- PagerDuty
- Webhook
If you already have existing channels, you can select them from here. Otherwise, select New Channel to set up a new channel. For more information about channels, see Creating Notification Channels.
Alert Type
Moesif supports two types of alerts:
- Static alert enables you to define a specific threshold for when to trigger an alert.
- Dynamic alert leverages Moesif’s anomaly detection and triggers alerts when the metric deviates from the historical trend line.
Static Alert
Static alerts serve as simple alerts that trigger when your metric reaches the threshold you specify for your metric.
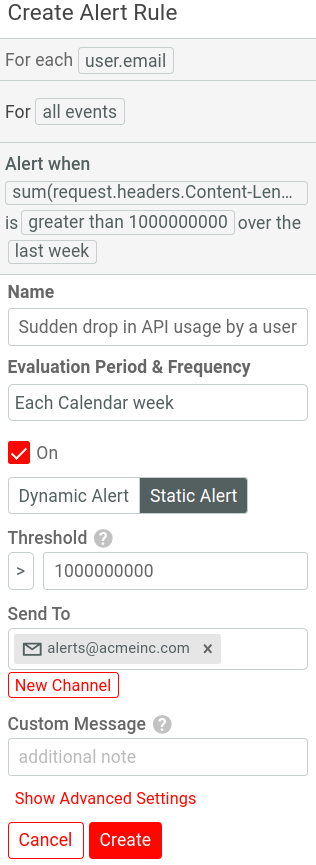
The alert triggers once your metric (such as Event Count) reaches your threshold.
Static alert supports the following operators:
><>=<=any
If you want a recurring alert that triggers for every time interval regardless of metric value, select the any operator in Threshold.
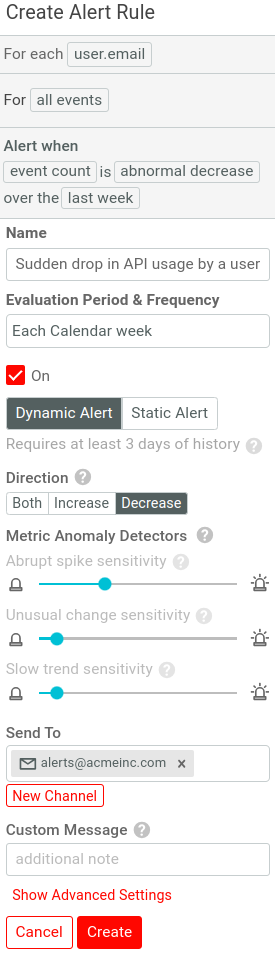
Dynamic Alert
Dynamic alert leverages Moesif’s anomaly detection that learns the trend line from historical data and alerts when the metric looks abnormal.
Dynamic alerts can help you when the metric varies drastically that would normally make static alerts impossible.
You can set Direction to monitor the important changes for your use case:
- Increase alerts you when the monitored metric has an abnormal increase.
- Decrease alerts you when the monitored metric has an abnormal drop off.
- Both alerts you when the monitored metric has an abnormal change in either direction.
When you combine dynamic alerts with Group By, Moesif monitors the trend line for each value separately. For example, let’s say you want to monitor when a customer has a drop-off in API traffic so customer success can preempt any customer churn issue. In this case, group by user.email and set the dynamic alert’s Direction to Decrease only. Moesif alerts you when a specific user’s API usage has a large decrease relative to the user’s historical trend line.
Changing Dynamic Alert Sensitives
Moesif recommends the default sensitivities to start. Adjust the sensitivity if you feel that you’re receiving too few or too many false alerts.
You can configure how fast the detectors generate alerts by dragging the Metric Anomaly Detectors sliders left and right. If you’re receiving too many false alerts, drag slider left. If you want alerts for small deviations, drag the slider right.
The following table summarizes the detectors:
| Detector | Alert name | When to decrease sensitivity |
| Abrupt spike detector | SPIKE | Your API receives a low volume of traffic so small fluctuations in error rates throw off the spike detector. |
| Unusual change detector | RISE/FALL | |
| Slow trend detector | POSITIVE TREND | Your API has seasonal patterns—for example, an API only used during working hours that naturally has an increase in error rates at 9 AM. |
Custom Message
Use the Custom Message field to add a custom message or note to your alerts. This is not supported for SMS messages.
Advanced Settings
Advanced settings enable you to tweak when Moesif sends or silences notifications. For example, once an alert rule is triggered, you may want to silence it for a short period of time to avoid too many notifications.
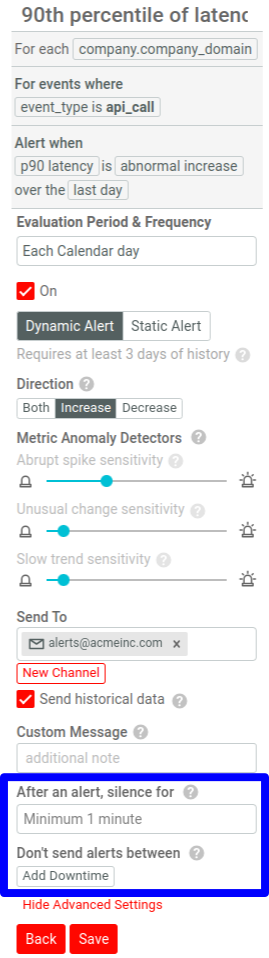
- Silencing alerts
- This setting allows you to silence any future notifications for the same alert rule for a specific period of time. This can help reduce the number of notifications for noisy alert rules.
- Alert downtime
- The downtime setting allows you to add a quiet period where during which Moesif doesn’t send any alerts. For example, if you have a cron job that performs some maintenance that brings down a service from 5 AM to 6 AM UTC everyday, you can set this schedule to avoid receiving false alerts.
To add a downtime, select Add Downtime and set values for the following fields:
Field Description Example Start time The start time for downtime window in 24-hour clock time. 05:00 End time The end time for downtime window in 24-hour clock time. 06:00 Timezone The timezone to use for the start and end time. PDT