Credit Usage Metrics & Reporting
Within every company profile in Moesif are multiple charts that can help with analyzing and reporting on credit usage and transactions. To access these reports, navigate to the company’s profile (either by clicking on the Company’s ID within a report in Moesif or by going through the Company Lookup screen).
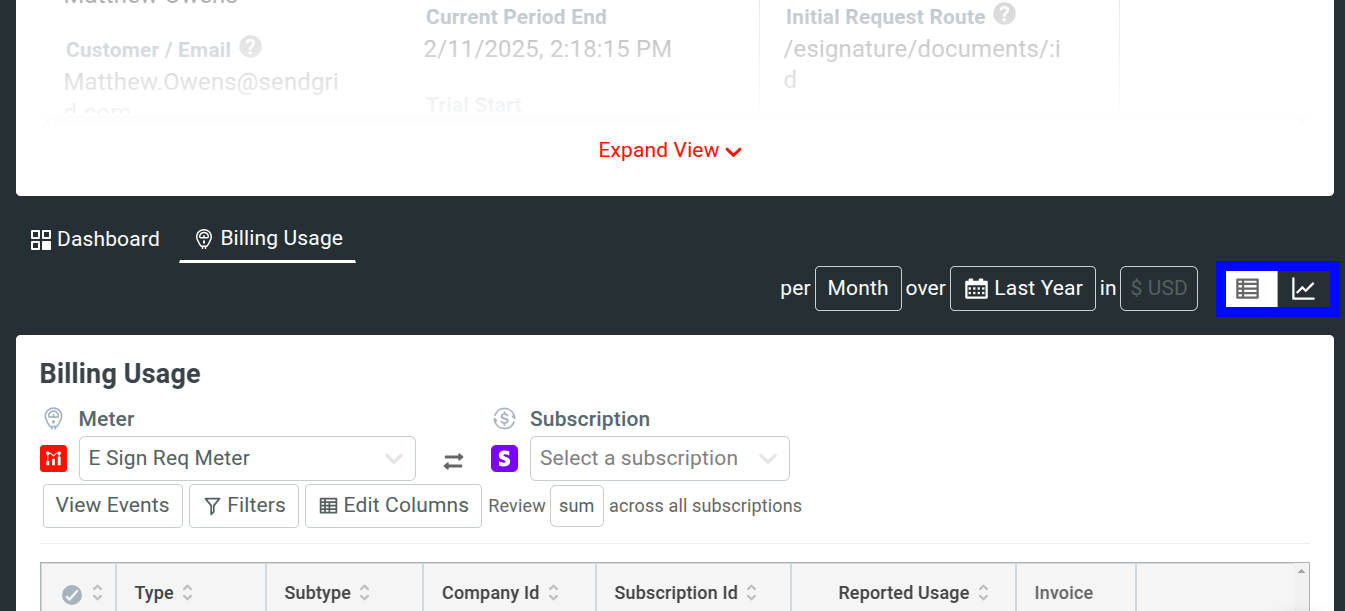
On the company profile, underneath the profile fields display, click on Billing Usage. This area will show multiple charts that can help you to understand billing usage for this particular account. By default, the screen will show the Billing Usage and Subscription Balance time series reports.
You can also toggle between chart styles by using the chart-type selector at the top of the chart. By clicking the table view button, you will then be presented with a table outlining all transactions. Clicking the graph view button will bring you back to the Time Series charts originally displayed.
Billing Usage Report (Time Series)
The Billing Usage report shows usage per Billing Meter across all subscriptions that a company has. In the top left of the pane, use the Meter menu to choose the meter that you would like to report on. The output of this chart is a time series report that shows Reported Usage (the actual events that have been recorded by the meter) and Amount (the $ value of the events, as calculated by the meter).
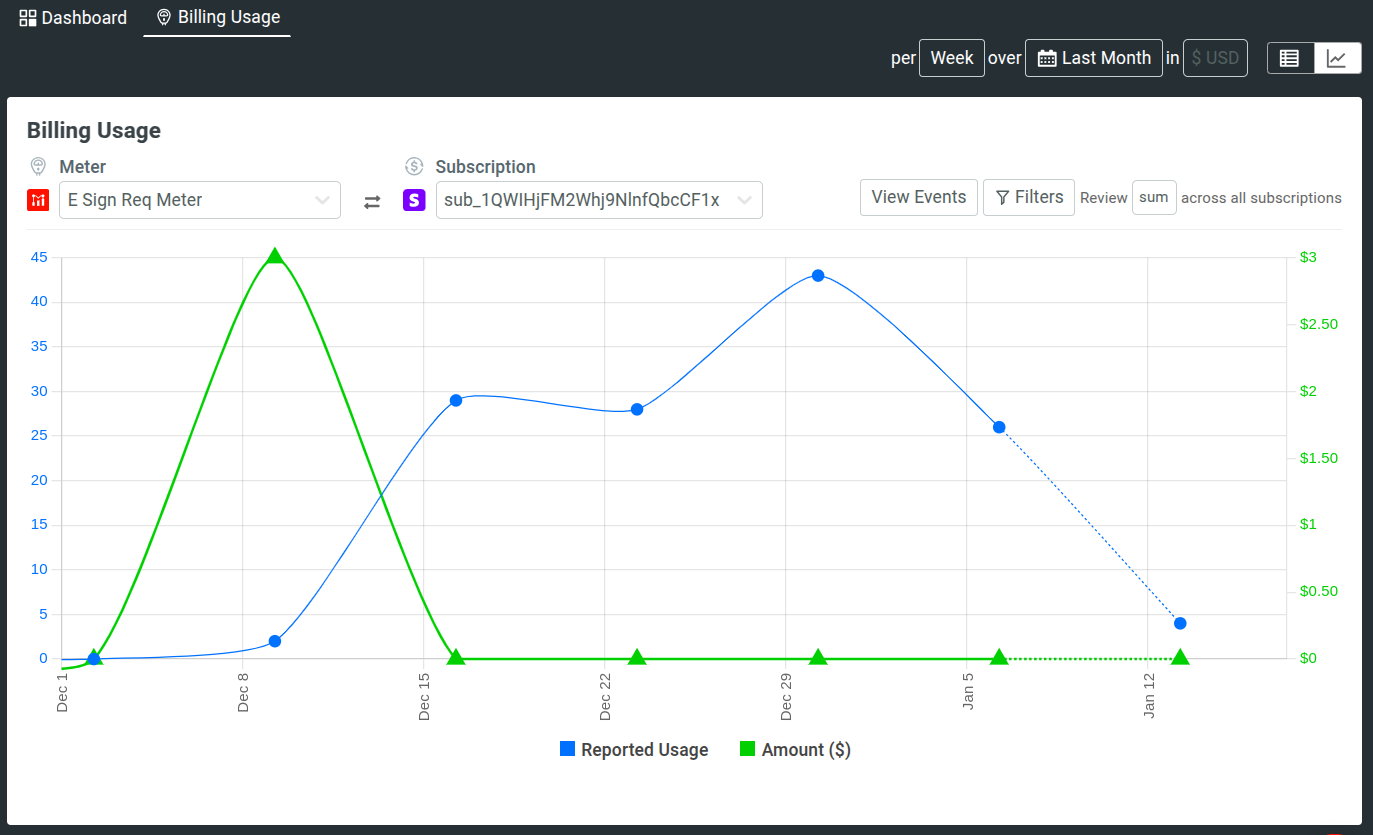
The time series Billing Usage report also allows the following actions through thhe charg utilities::
- View the associated event logs by selecting View Events.
- Filter by billing report status by selecting Filters.
- Choose the aggregation operator for the usage data.
Billing Usage Report (Table View)
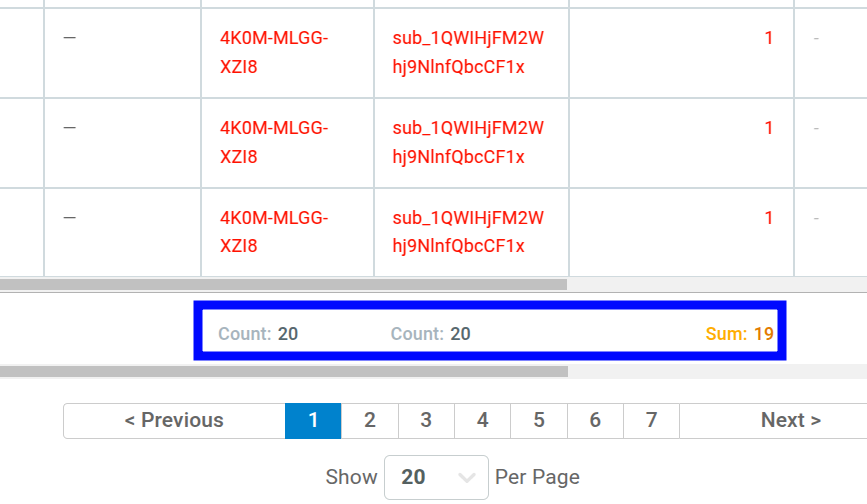
In the table view of the Billing Usage report, you will be able to view all transactions in a nicely laid out table. This will show every transaction in detail and can also be filtered by Meter and Subscription using the dropdowns at the top of the report.
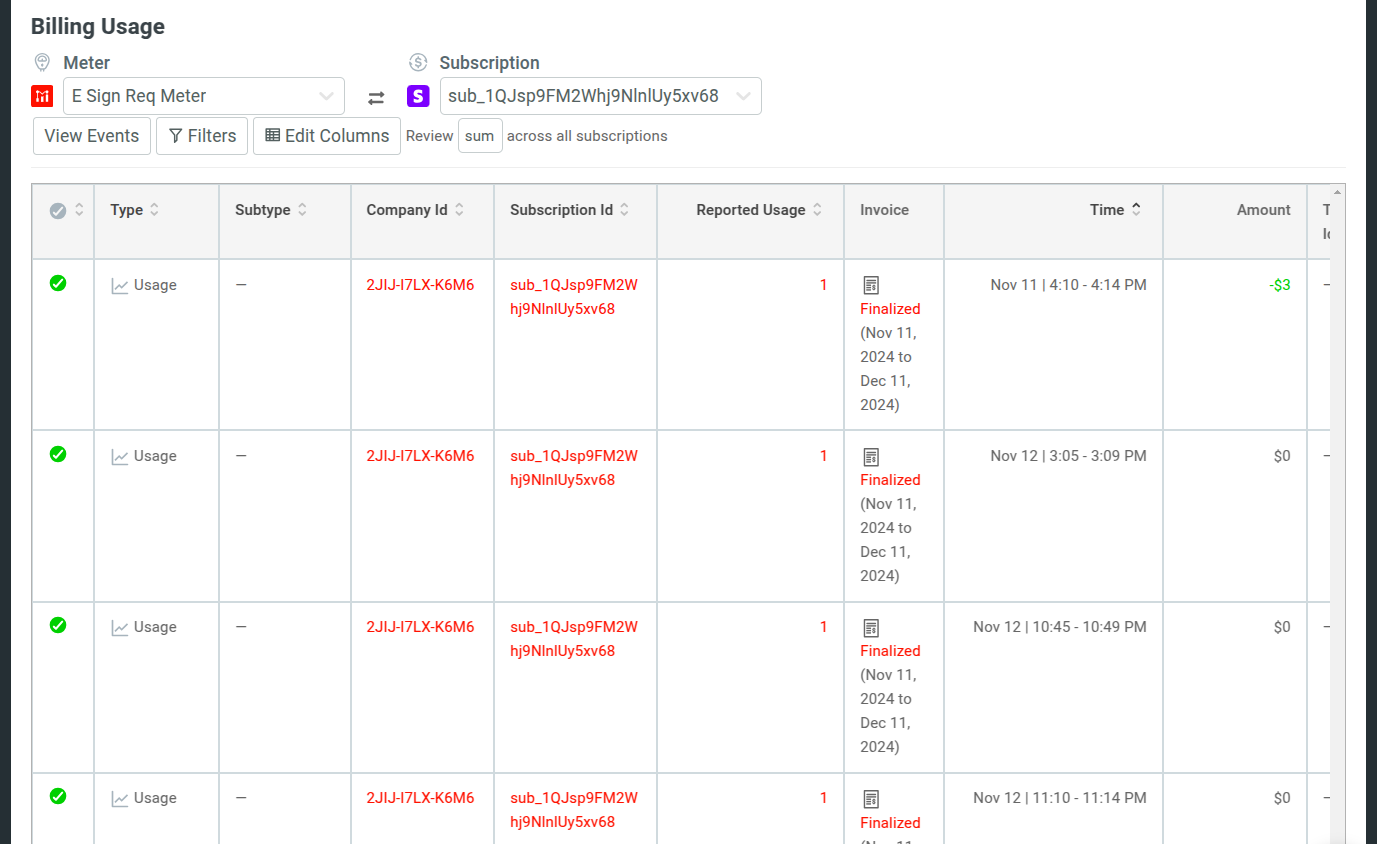
At the bottom of the table, you can see aggregation data about usage:
You can customize how the table view displays data and access further information by using the following utilities:
- View the associated event logs by selecting View Events.
- Filter by billing report status by selecting Filters.
- Select what fields to display in the table view by selecting Edit Columns.
- Choose the aggregation operator for the usage data.
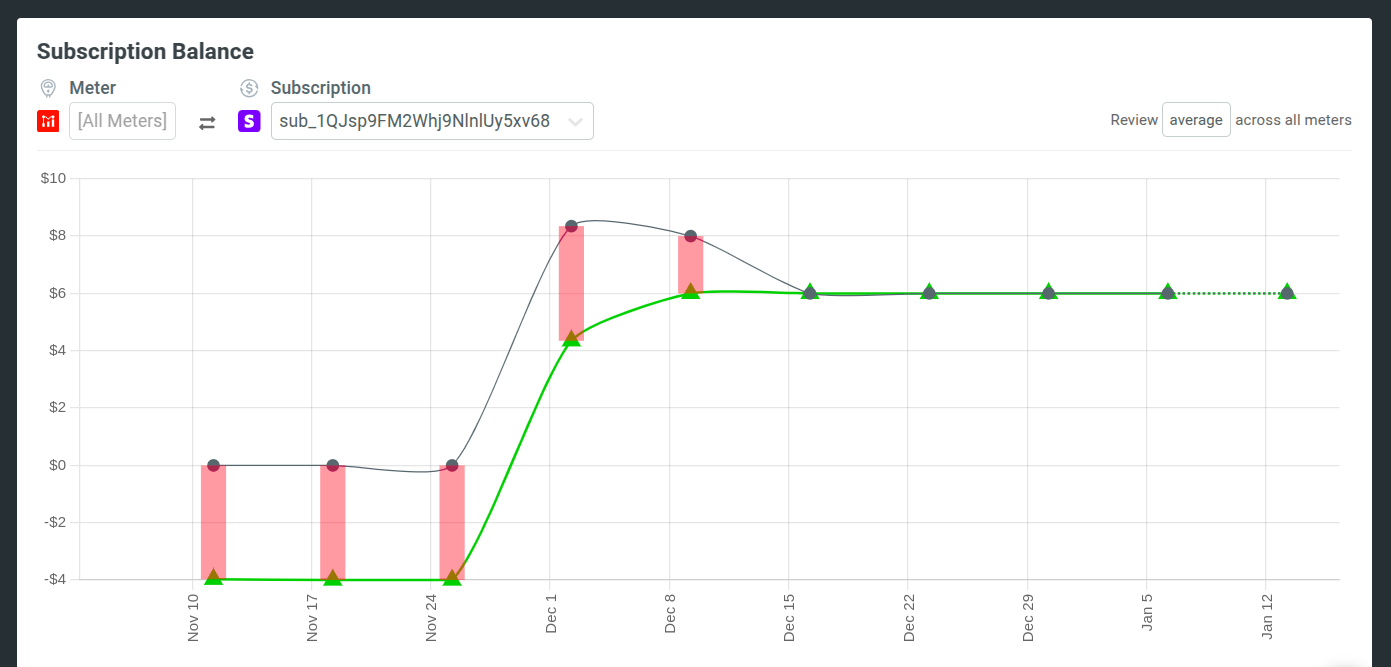
Subscription Balance Report
The Subscription Balance report shows usage across all Billing Meters for a particular subscription that a company has. To view the subscription balance report, select the time series view of billing usage report.
In the top left of the pane, under Subscription, you can choose the subscription that you would like to report on. The output of this chart is a time series report that shows the three balance factors within the Moesif ledger: Current Balance, Pending Activity, and Available Balance.