Creating Dynamic Alerts
Dynamic alerts can be used to monitor an increase or decrease in a specific metric. For instance, you may want to set up an alert to fire if there is an abnormal increase in HTTP ‘401 Not Authorized’ errors within a 15 minute window. These types of alerts work well if you aren’t sure of a specific threshold but want to keep an eye on abnormalities in traffic or events.
Setting up a dynamic alert in Moesif is very simple. Follow along to create an example dynamic alert that will look at both abnormal increases or decreases in HTTP 200 OK responses.
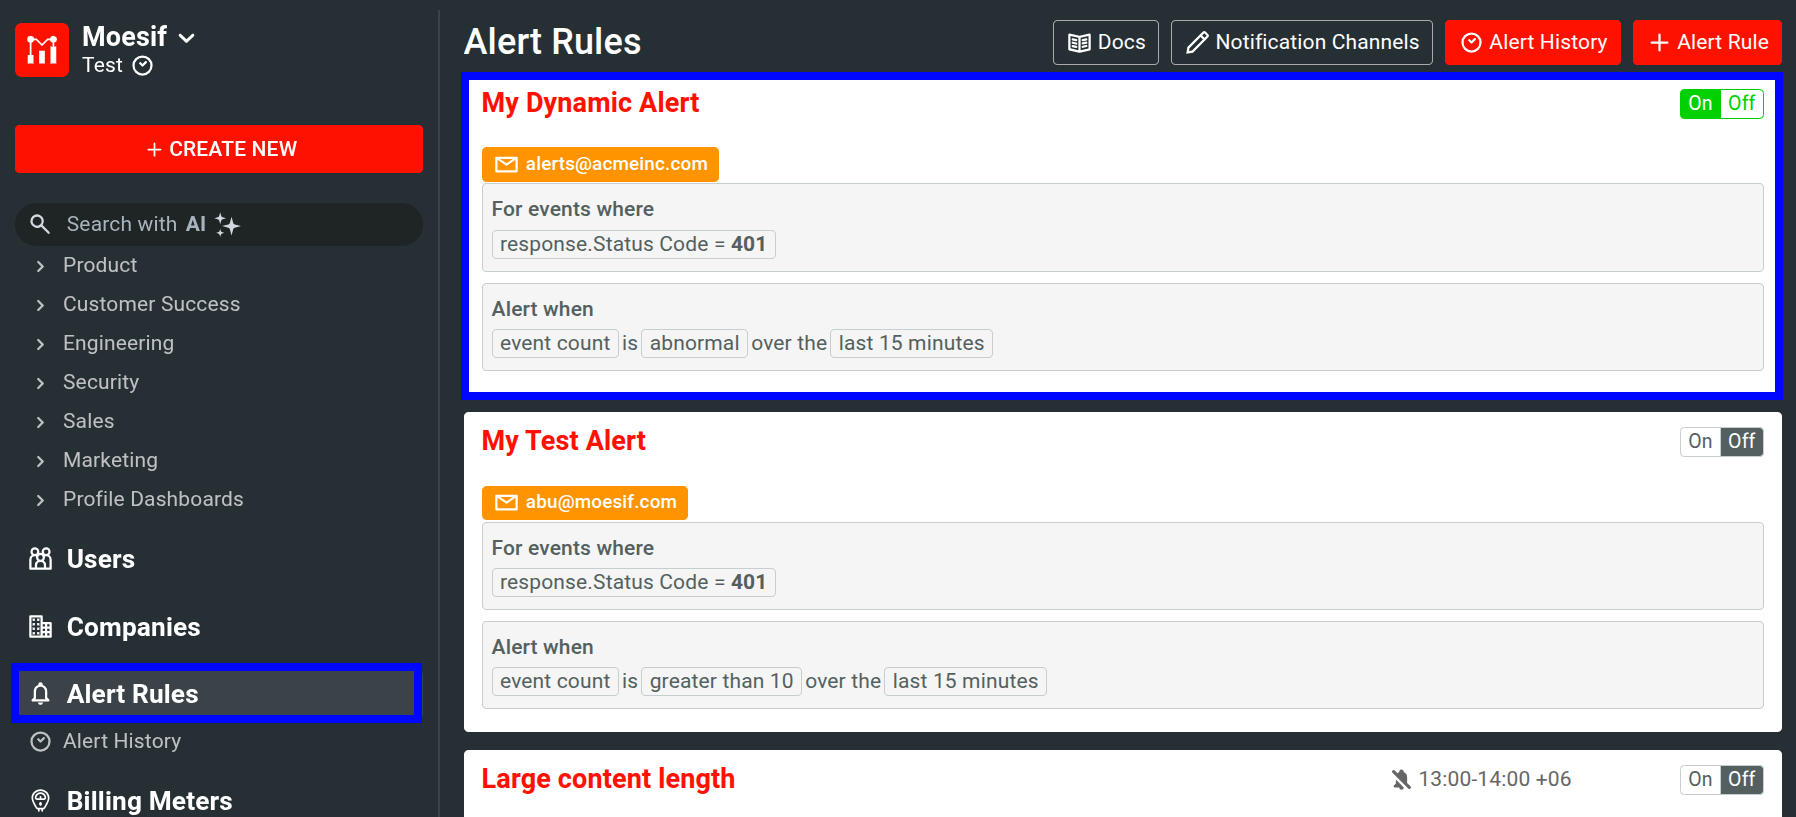
First, you’ll want to select Alert Rules from the left navigation pane.
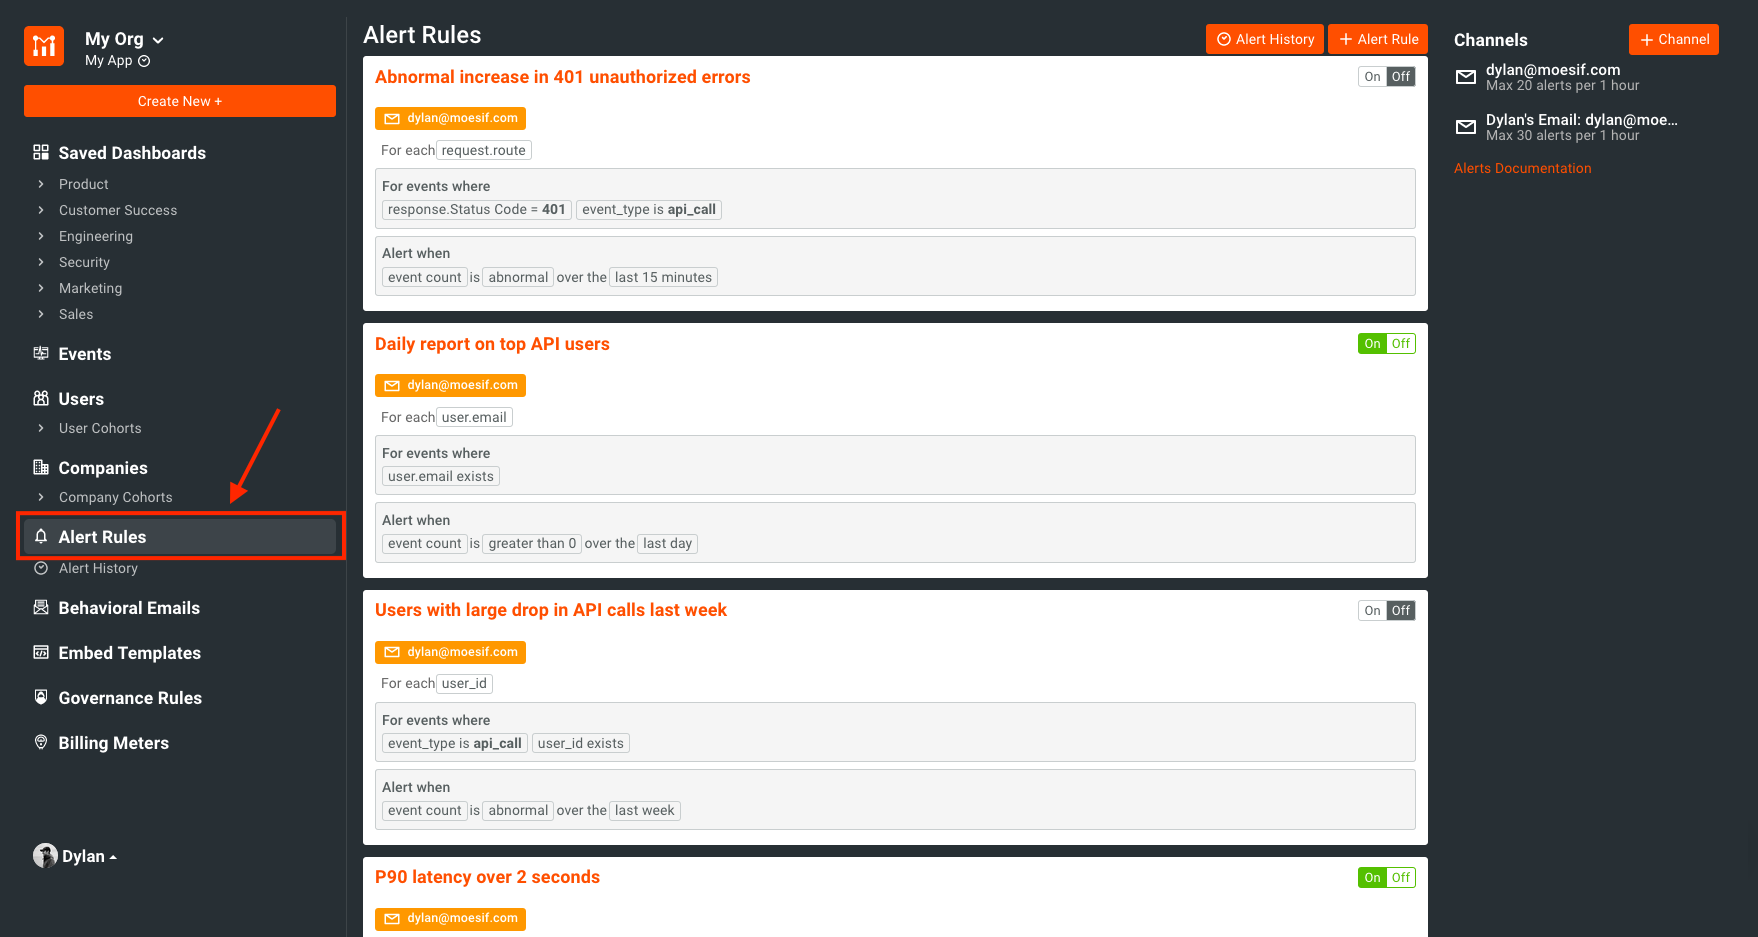
NOTE: If you haven’t set up any alerts before, you’ll notice a few that are there by default. These are just a few alerts that we have found useful for our users. You are able to delete or modify these to suit your needs.
Once on the Alert Rules screen, you want to click “+ Alert Rule” in the top right corner of the screen.

Creating a New Alert
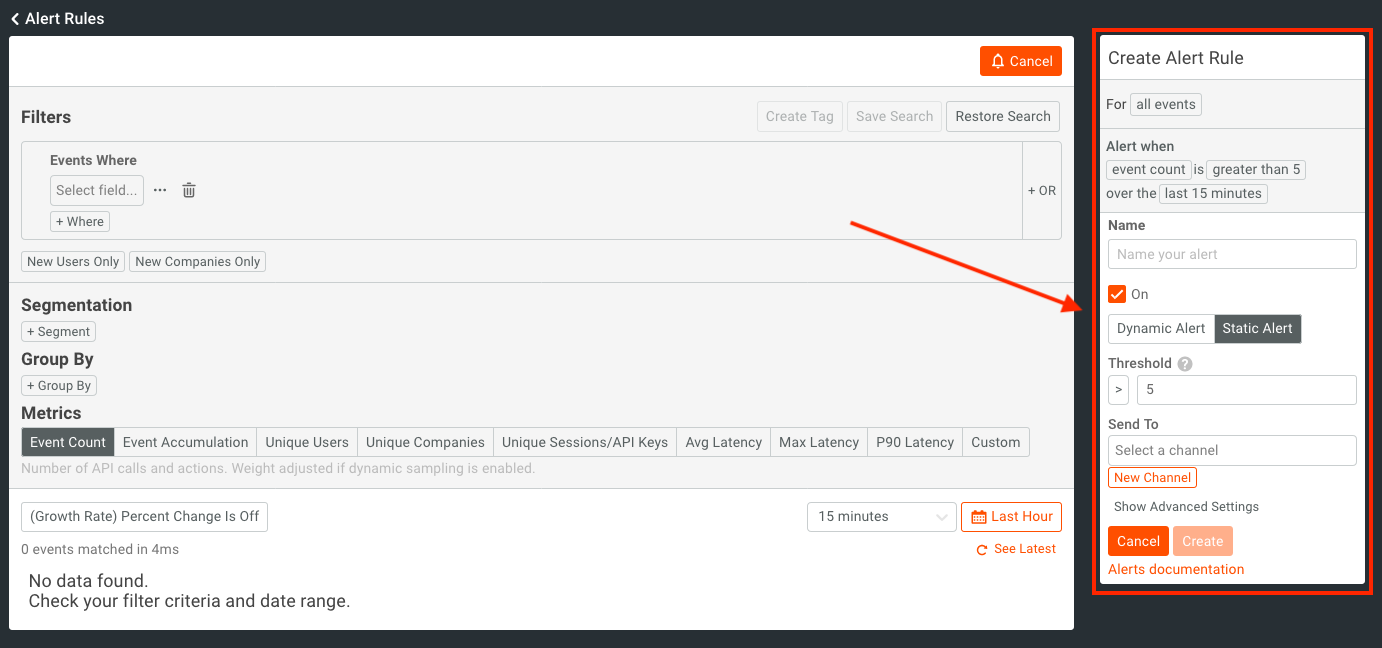
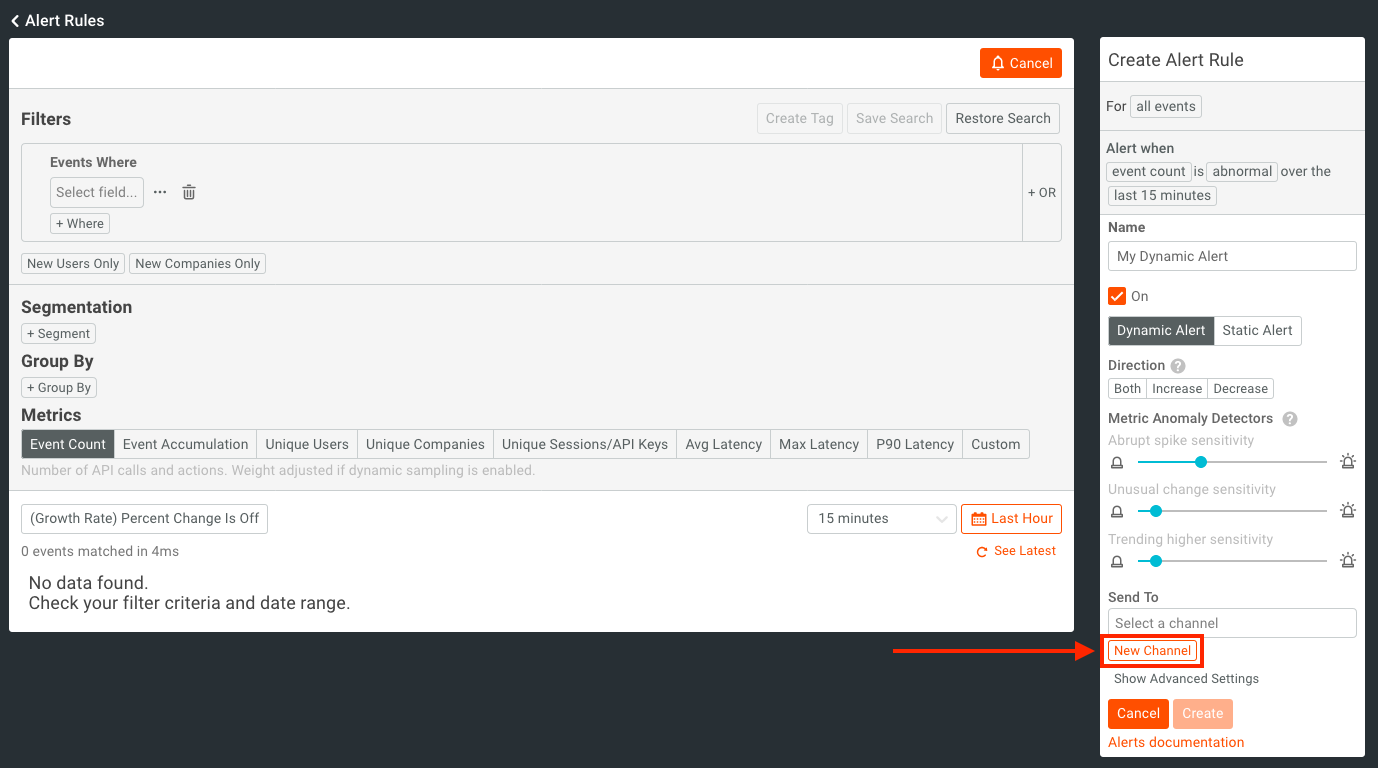
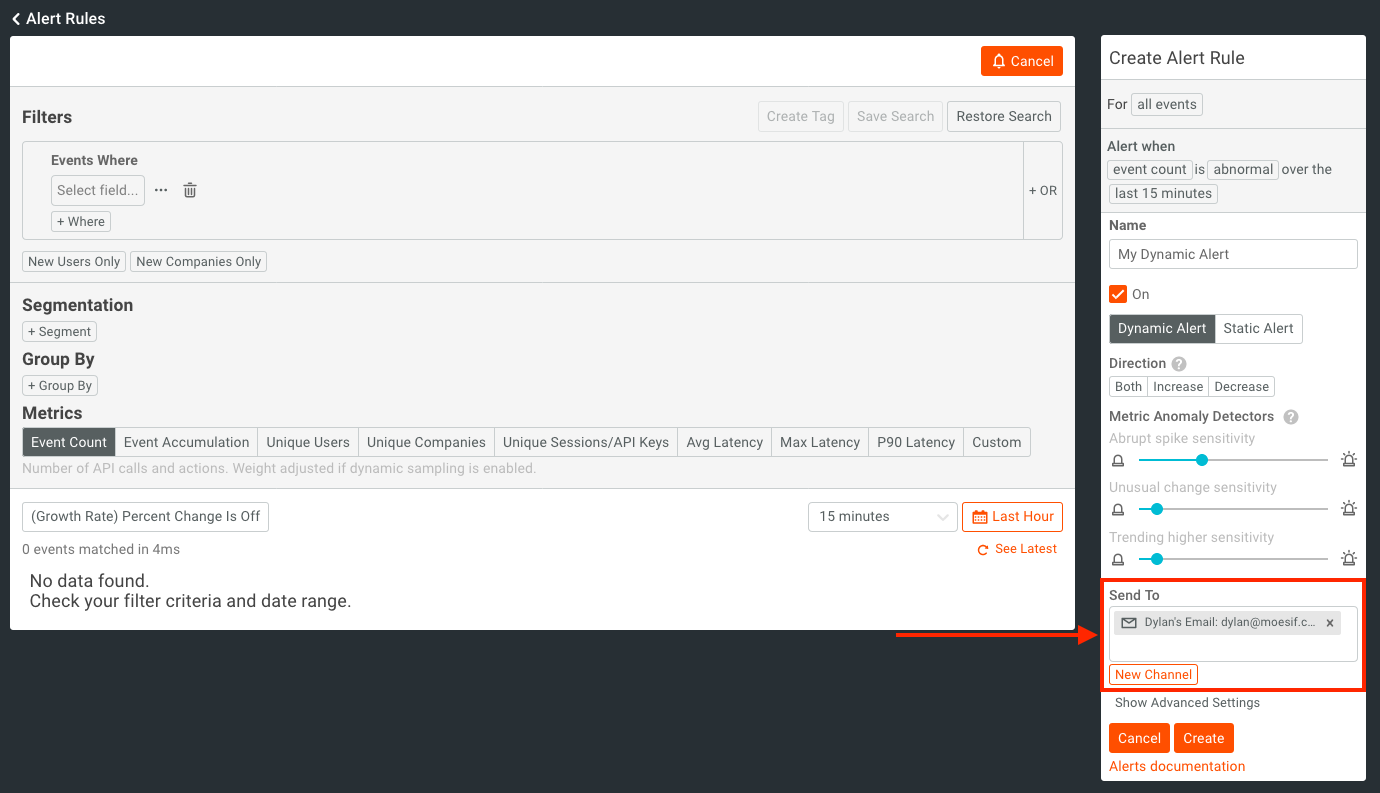
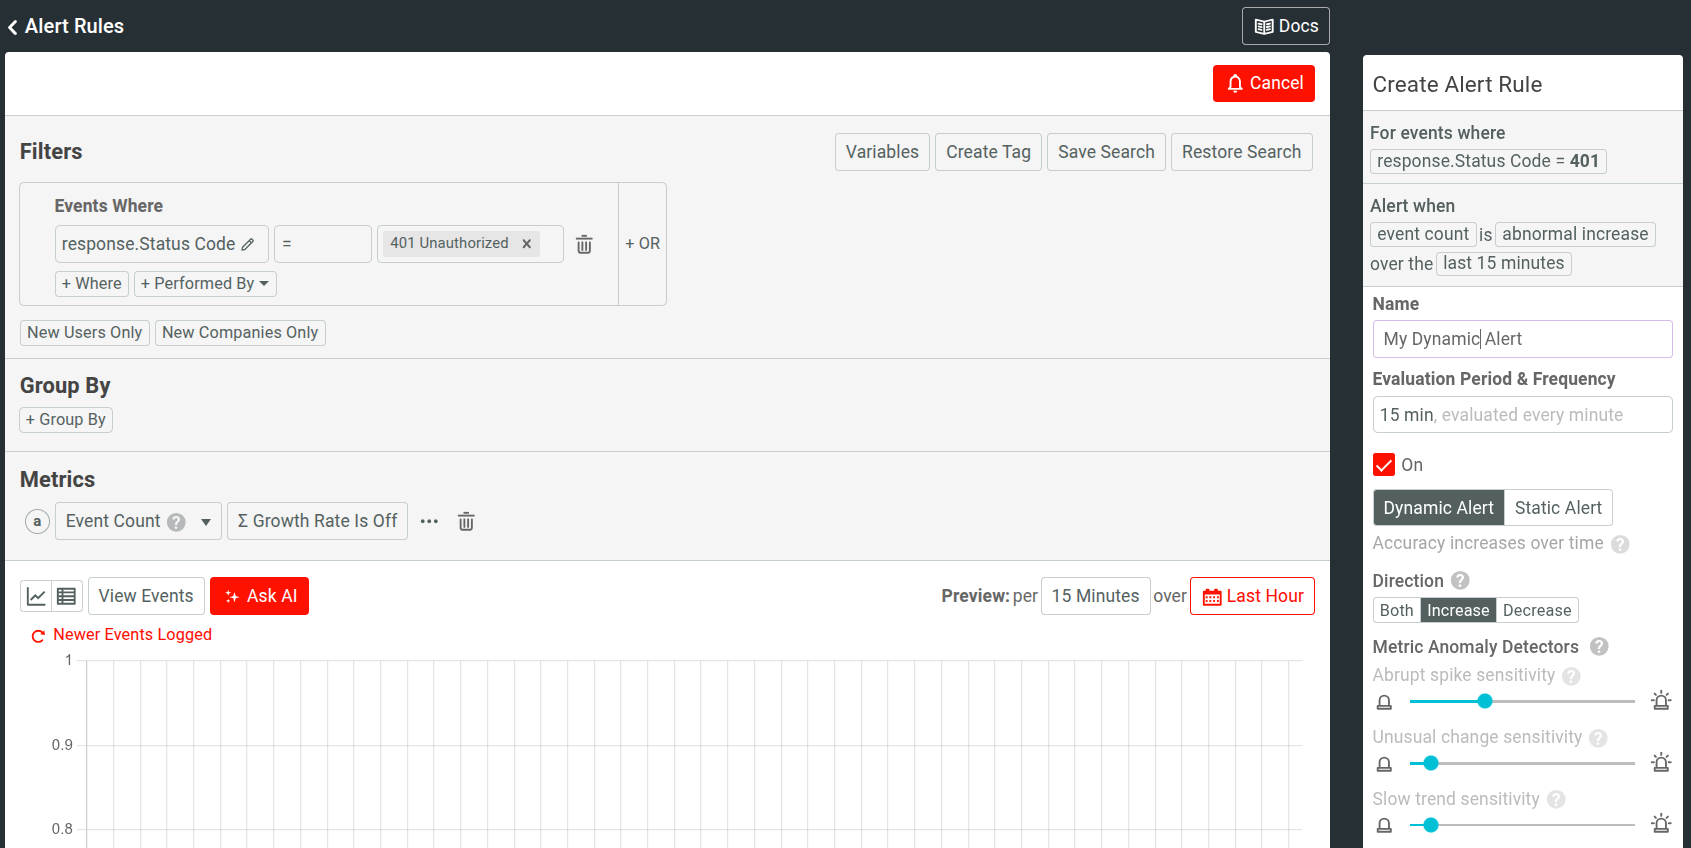
From here, you’ll see a new screen where you can input your alert criteria. On the right of the screen, you’ll see a summary of the alert you are about to create (or are updating if the alert rule already exists).
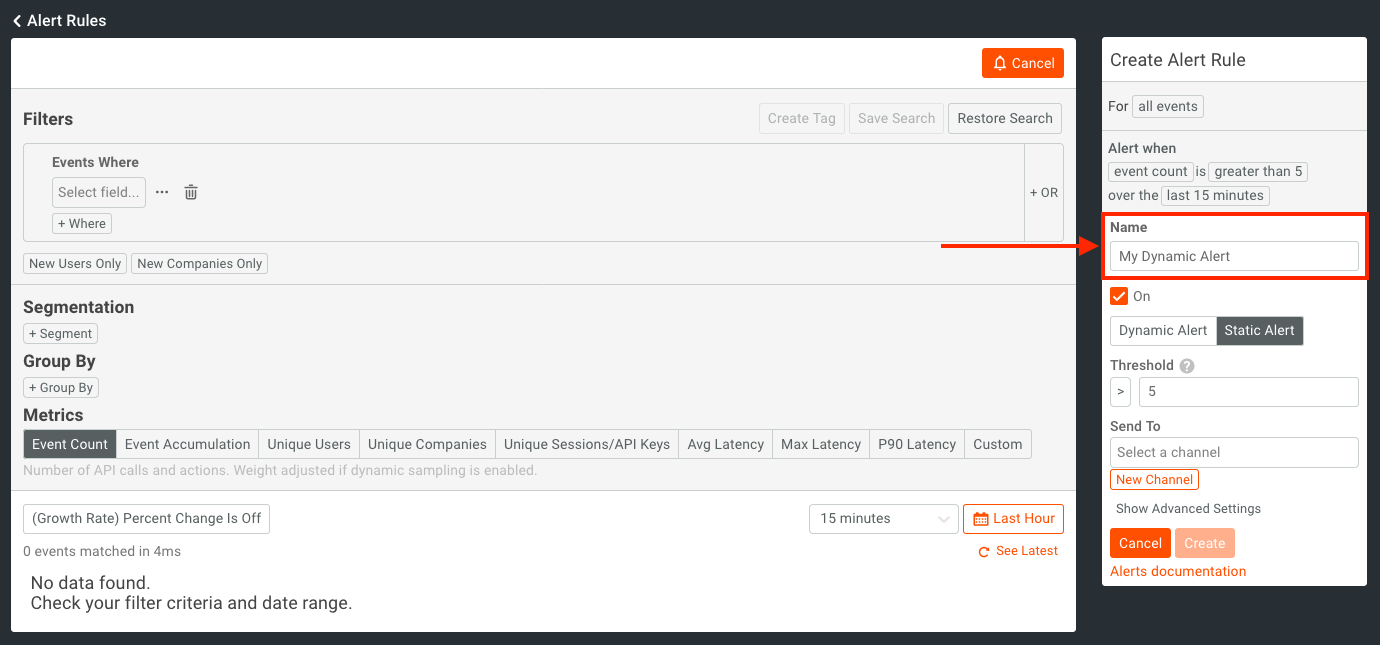
Firstly, in the Name text box, we will name our alert.
Next, you’ll want to make sure that the alert is active by having checked the On checkbox. You’ll also want the alert type to be set to Dynamic Alert.
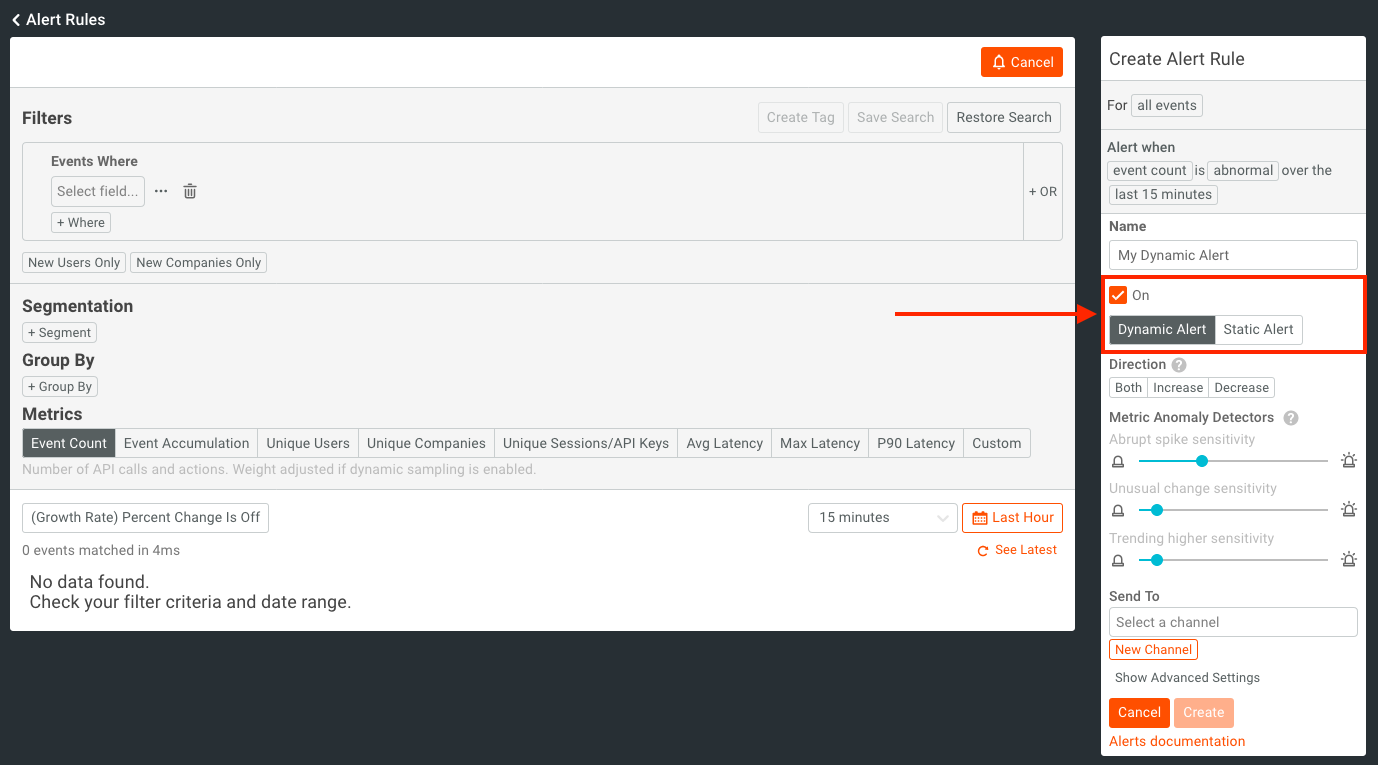
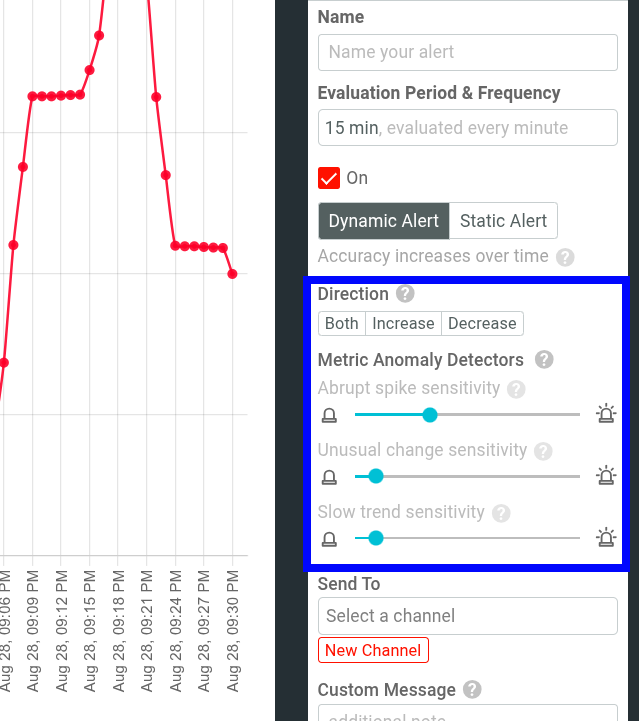
After this, we will set the Direction and Metric Anomaly Detectors fields.
First we need to pick a trend Direction. The selected value will detect trends when metrics go in a certain direction. Values for this are:
- Increase will alert you when the monitored metric has an abnormal increase.
- Decrease will alert you when the monitored metric has an abnormal drop off.
- Both will alert you when the monitored metric has an abnormal change in either direction.
Depending on how you’d like to follow certain trends, select the correct metric direction to accommodate your needs. For this demonstration I will choose “Both” so that any increase or decrease will be detected.
For Metric Anomaly Detection, we want to specify a few values. These include:
- Abrupt spike sensitivity
- Unusual change sensitivity
- Trending higher sensitivity
NOTE: Check out our docs for more info on Metric Anomaly Detection sensitives.
Creating an Alert Channel
We also want to specify which channels this alert should be sent to. Currently, Moesif supports sending alerts to the following channels:
- SMS
- Slack
- PagerDuty
- Webhooks
To add a channel to send the alert to, click the New Channel button.
NOTE: If you have already added the channel you want previously, simply click on the “Select a channel” dropdown and select your previously added channel.
After clicking this, you’ll see a new modal appear which allows you to pick a channel and add in the relevant details. In this example, I will add a new Email channel.
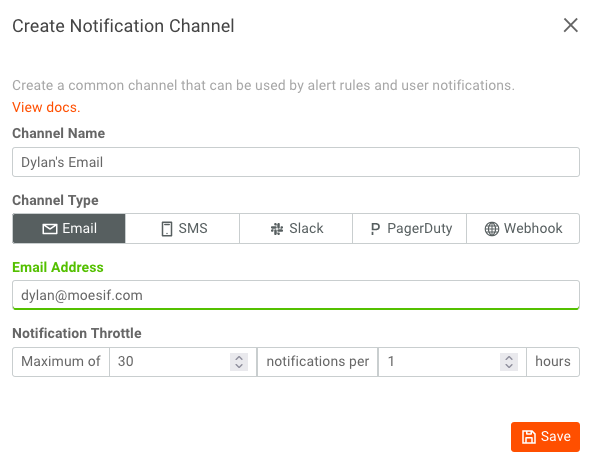
The fields for a new email channel include:
Channel Name - This is the name that you want the channel to display as
Channel Type - This is the type of channel you want the alert to go to. Depending on the channel selected, different inputs will appear for configuration.
Email Address - This is the email address the alert will be delivered to
Notification Throttle - This controls the max number of alerts that can be sent during a given time period. This helps to make sure that the right amount of alerts are being sent without spamming the recipient.
Once you’ve filled out the fields, click Save.
Now you will be able to select your newly added channel from the Send to dropdown. Once you’ve found your entry, click to add it as a delivery channel for your alert.
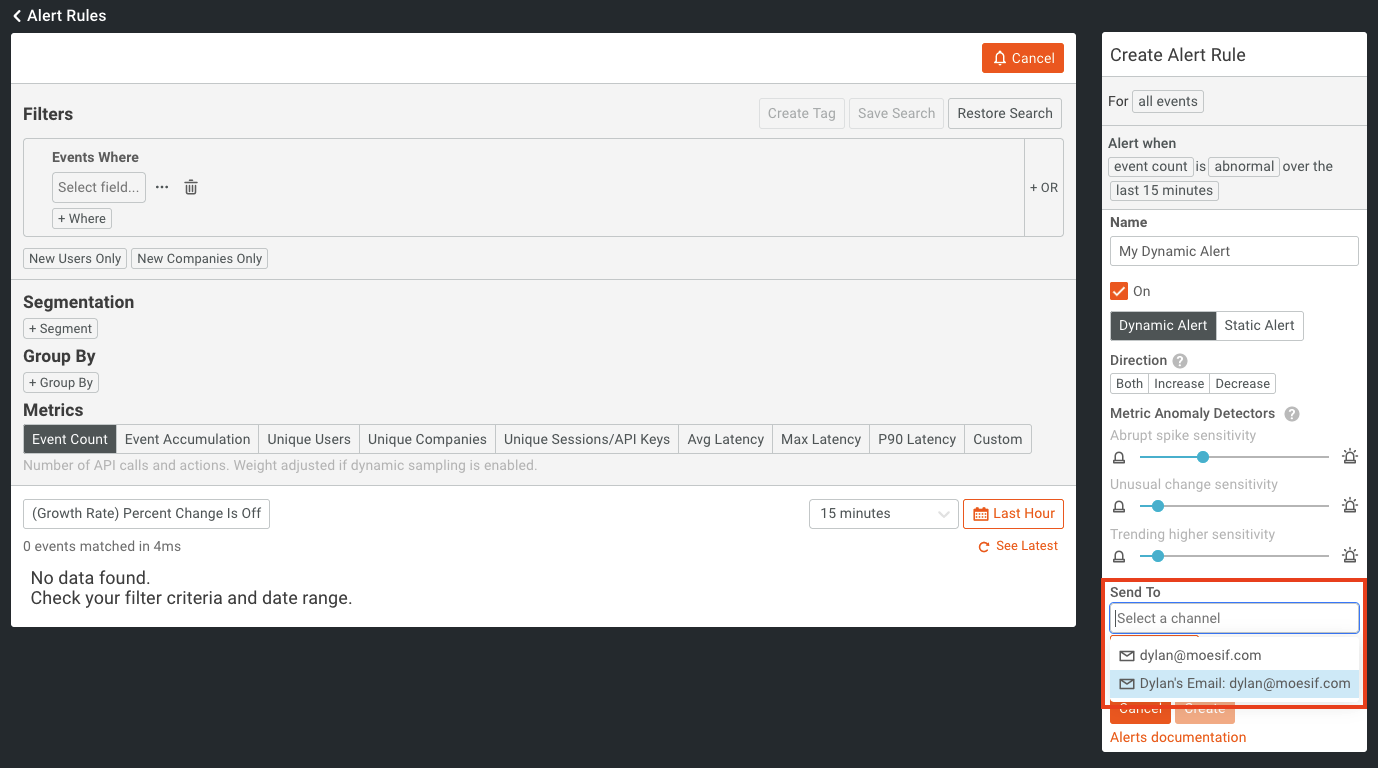
You should now see your channel added to the alert.
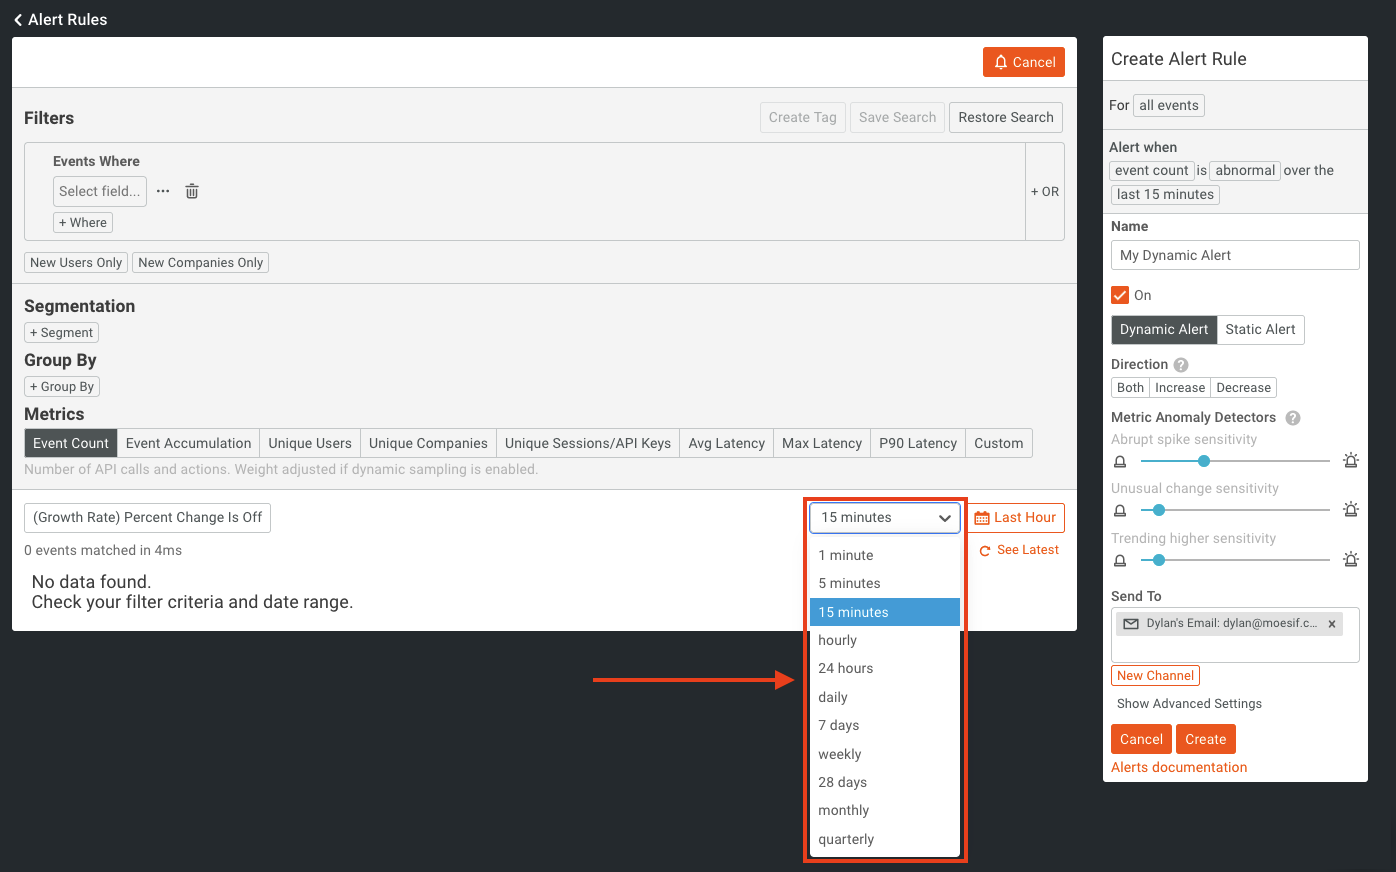
We will now set the interval for metric aggregation for the alert. The interval that we set will dictate the time interval that the alert criteria will evaluate against. Hourly or smaller intervals are evaluated continuously every minute in overlapping rolling windows. For example, if you select 15 minutes, Moesif will aggregate the metric from the last 15 minutes with a series like so: 12:00 to 12:15, 12:01 to 12:16, 12:02 to 12:17, and so on. On the other hand, daily or larger intervals are evaluated once per calendar interval. This means if you select daily, Moesif will aggregate your metric from 12:00 AM to 11:59 PM and send a daily report.
For this specific alert, we will select “15 minutes” from the dropdown.
Creating an Alert Filter
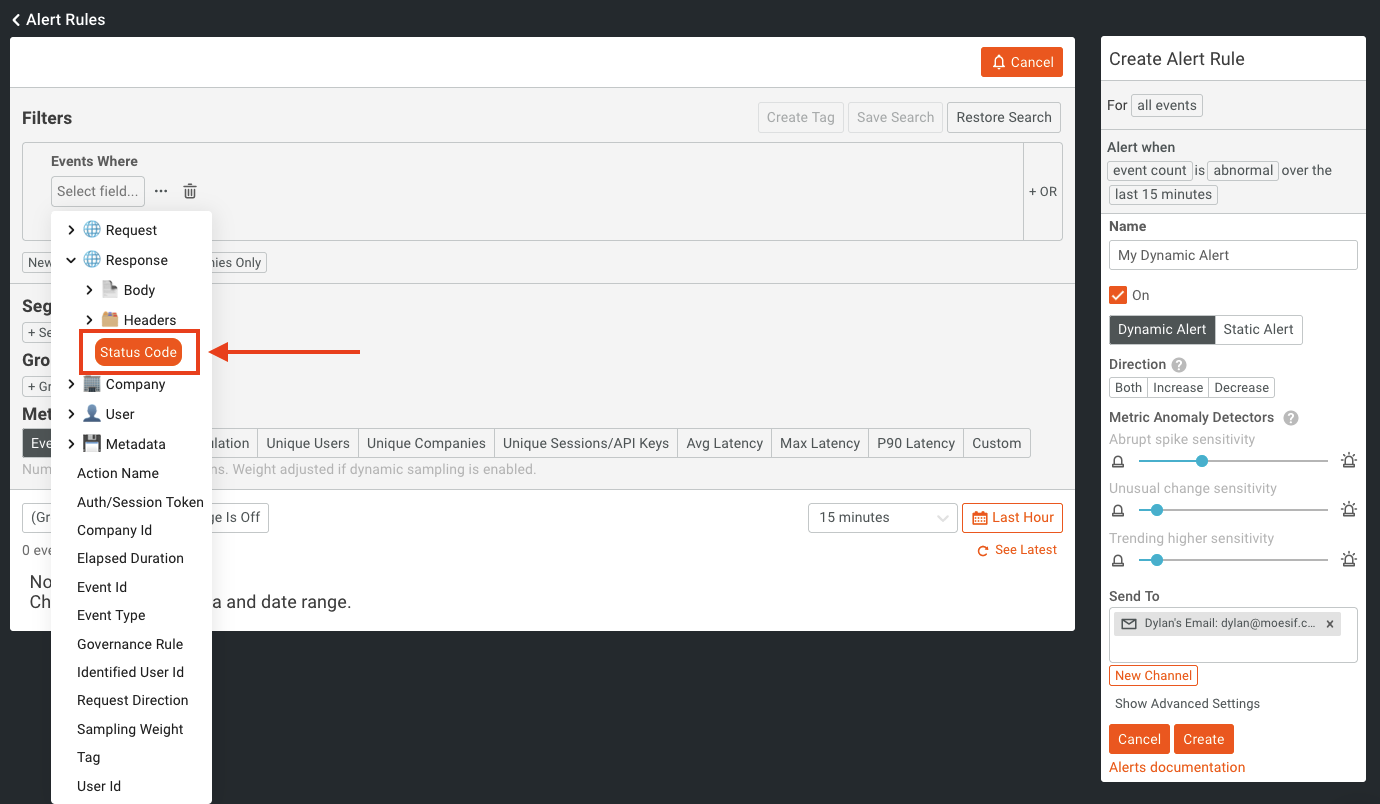
Most importantly, we will now set the alert filter. This is where we specify which events we actually want to aggregate. For this filter, we will simply look for any HTTP 200 response code that occurs in an API response.
To build this filter, click on Select field in the Filters pane. In the first criteria you will select Response, and in the sub-type, select Status Code.
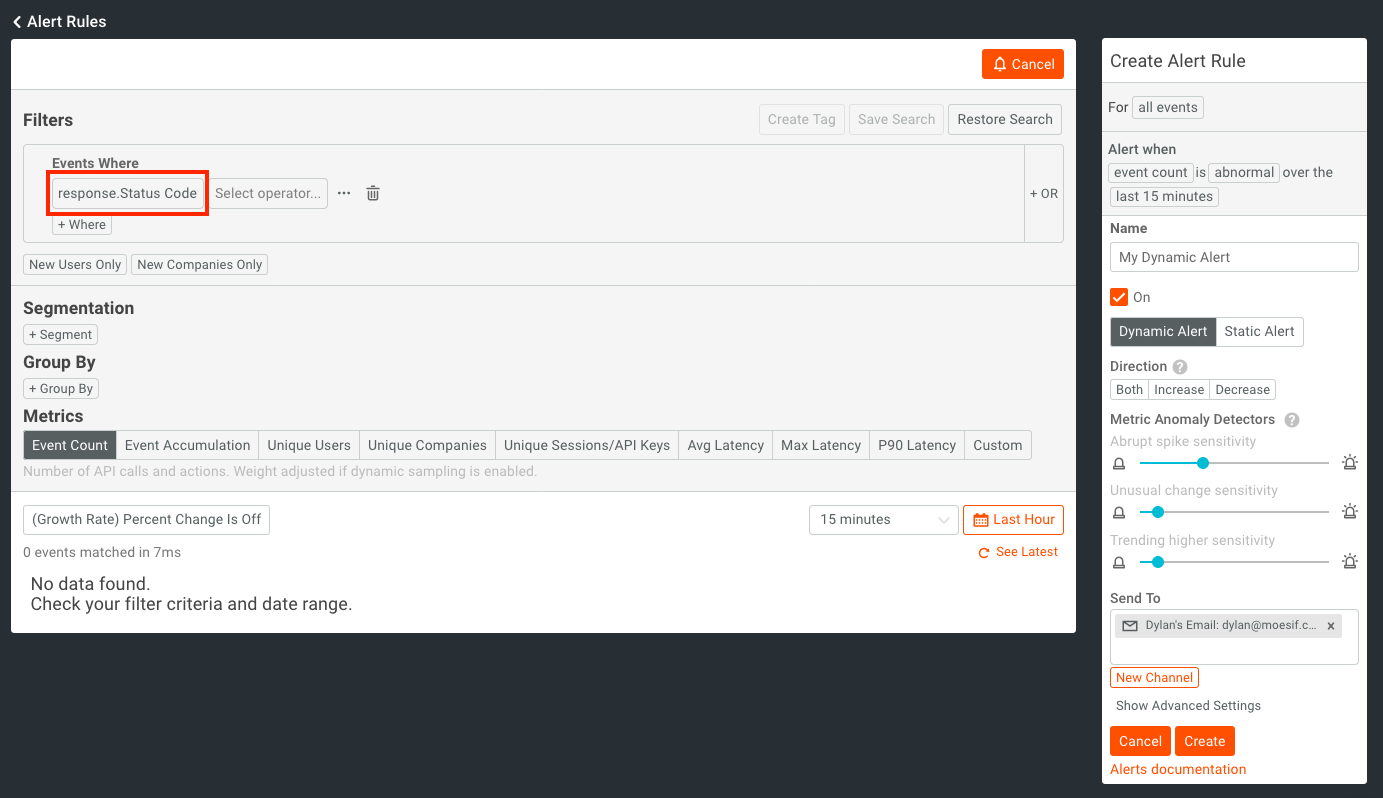
After this, you will click Select operator to choose the operator for the filter. For this comparison, we will use “=” operator.
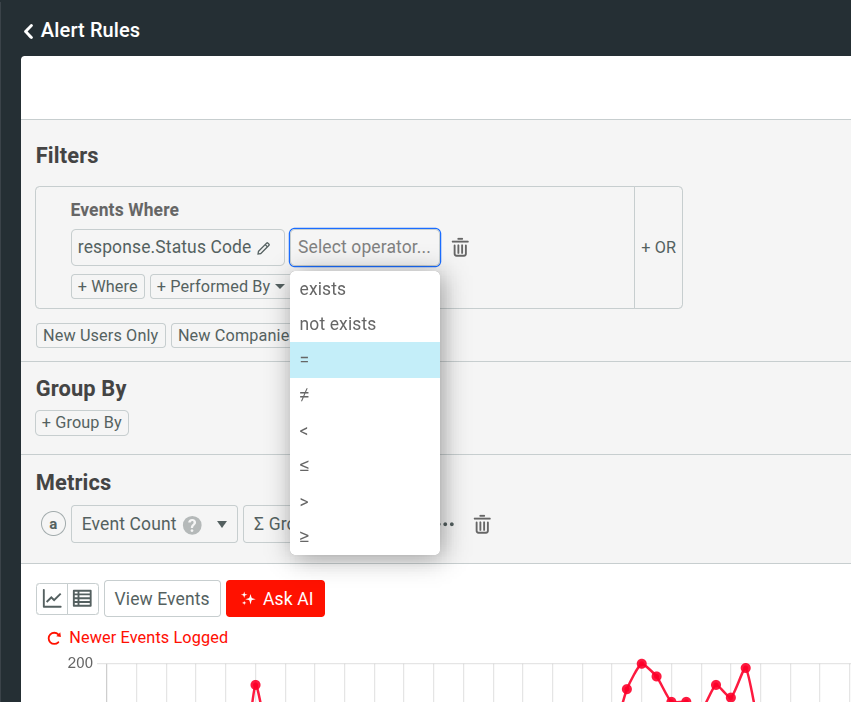
After the operator is selected, an input for value will appear. For the value here we will type in “200” and then select “200 OK” from the dropdown.
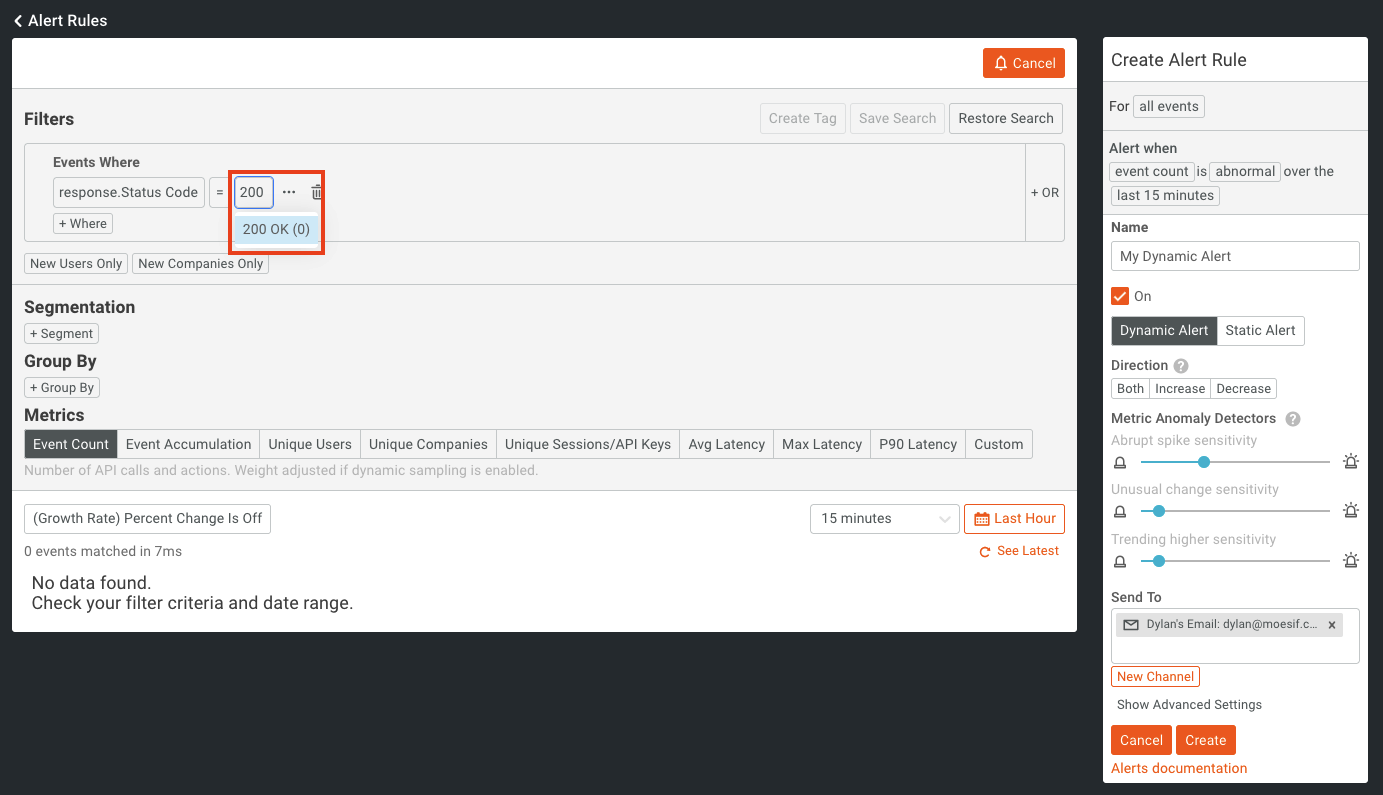
Once selected, your filter is then complete and ready to be used. It should look like this:
Saving an Alert
Now with everything configured, we will click Create to create the alert in Moesif.
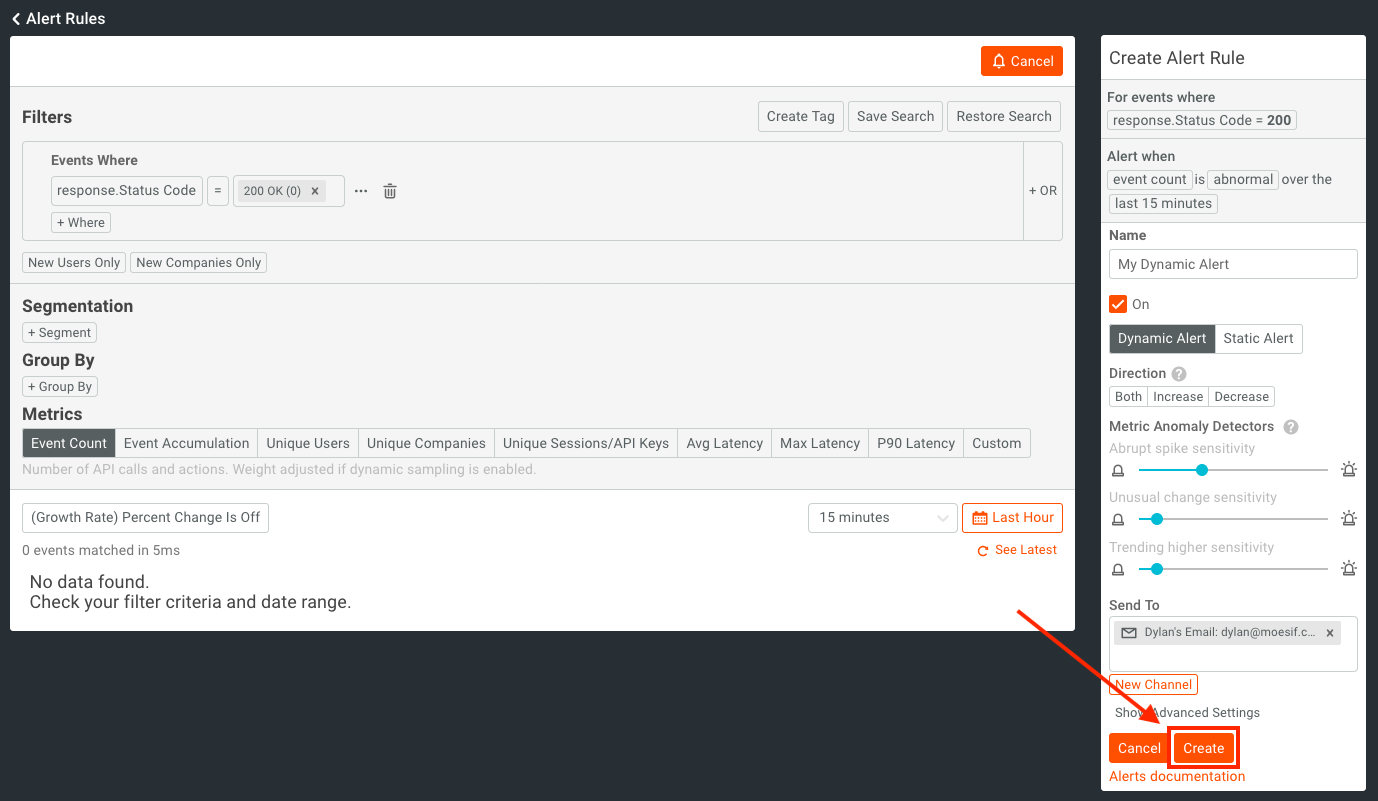
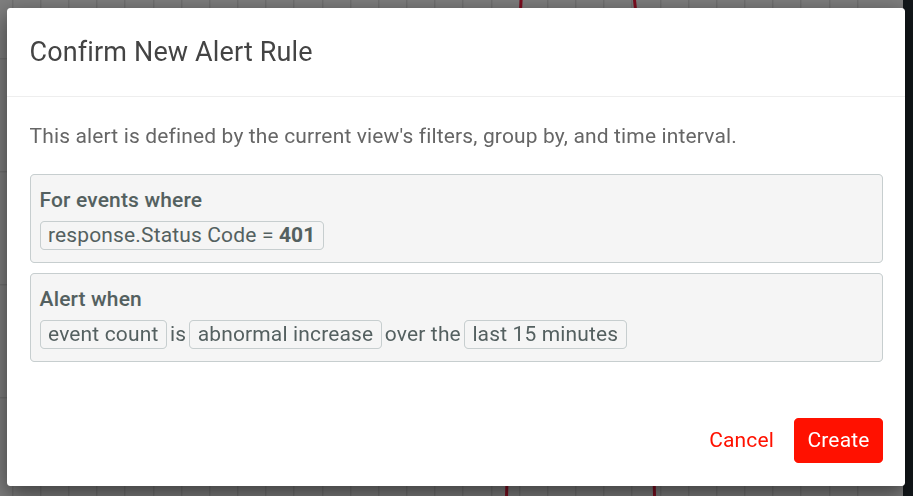
You’ll then have a confirmation dialog appear showing you the alert criteria and important configuration items. Do a final review and click Create once again.
After this, we will navigate back to the Alerts Rules screen. Here we will see our alert has been added and is active.
Receiving an Alert
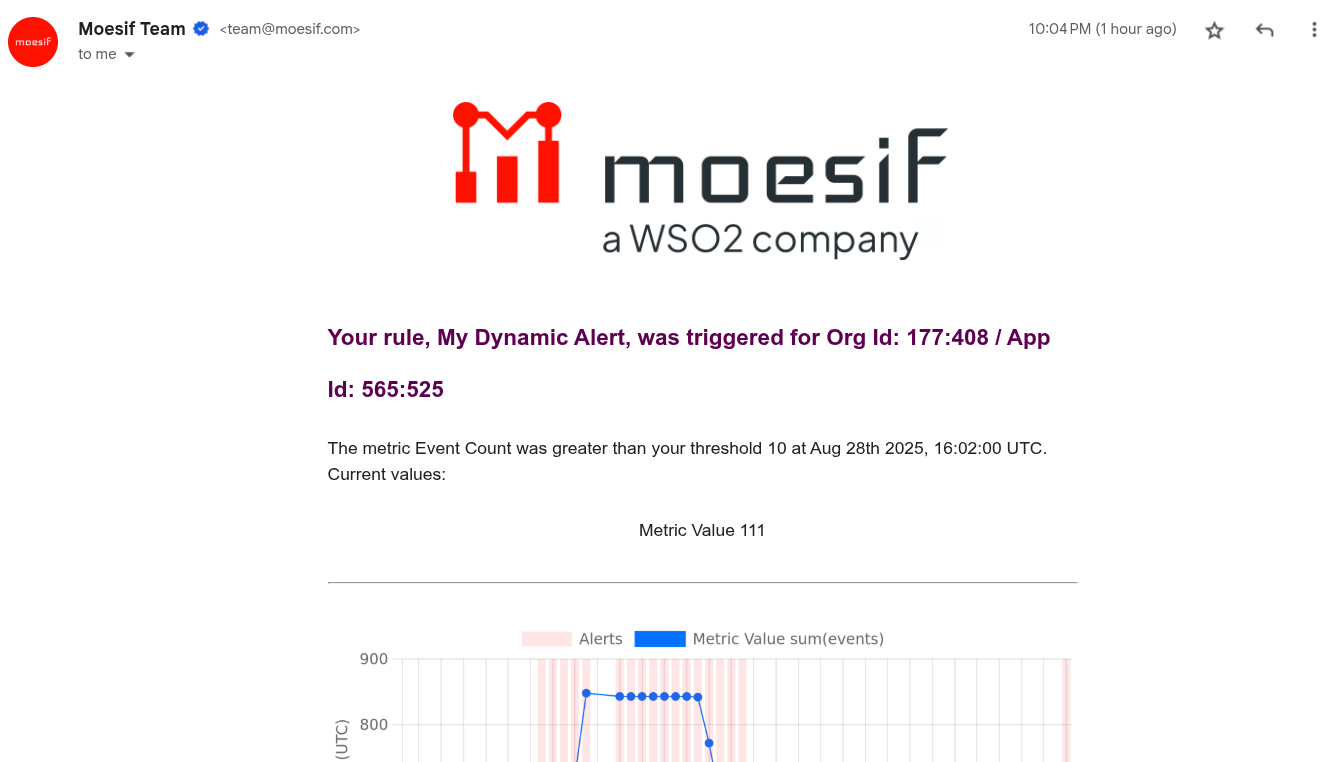
When an anomaly is detected, the alert will fire. You will receive an email (or alert in another channel if you set it up) similar to the one below that will show your an anomaly has been detected.
And that’s it! You’ve now configured your first dynamic alert in Moesif. With that, you can rest easy knowing that you’ll be notified of any anomalies that you are monitoring. This functionality will help developers, support, and management teams to provide better service to users and to more actively monitor and resolve issues within your APIs.