How Customer Success Teams Should Monitor Account Health and API Usage
Leading customer success for developer-first or API-first businesses is quite different from traditional enterprise software. The best API products are designed to be self-serve and hands-off, meaning customers rarely need to sign into a web portal once implementation is done. If you’re a Stripe or Twilio customer, when’s the last time you signed into their web portal? Hopefully not recently, otherwise that may imply a problem or issue. On the other hand, a traditional enterprise solution may look at the addition or reduction number of active seats for an account as an early signal of expansion or churn.
What is customer Success at API-first businesses
API-first businesses have two different “product experiences” that customer success needs to consider. First, there is the web experience when signing up and logging into your web portal. Then, there is the API experience integrating with and interacting with the API platform. Both are part of “onboarding experience” and should have measurable KPIs. Yet, the API is what drives long-term value. Customers who added many seats or team members but never got integrated with the platform and can churn quickly (if paying already).
Below are some comparisons for traditional enterprise vs API platforms. While we use the term “seats”, you can substitute with any pricing unit such as “licenses”, “CPUs”, or “physical locations”.
Leading indicators of revenue expansion
| Traditional Enterprise Software | API Platforms / Developer Platforms |
|---|---|
| Increase in number of active seats/used licenses | Increase in valuable API calls |
| Deploying to multiple locations or more departments | Deploying to production or more apps |
Leading indicators of customer churn
| Traditional Enterprise Software | API Platforms / Developer Platforms |
|---|---|
| Removal of many seats | Large drop in valuable API calls |
| Lot’s of inactive seats vs. active seats | Lot’s of low-value API calls vs. valuable API calls |
Issues during onboarding
| Traditional Enterprise Software | API Platforms / Developer Platforms |
|---|---|
| One or small number of seats activated | None or a small number of API calls made |
| Lot’s of negative support tickets | Lot’s of negative comments on Stack Overflow / Reddit |
Bad customer experience
| Traditional Enterprise Software | API Platforms / Developer Platforms |
|---|---|
| Lot’s of app crashes or UI quirks | Lot’s of 400 or 500 errors on API |
| Slow page loading | High latency API calls |
| UI requires many clicks to complete one task | API design requires many API calls to accomplish one transaction |
How to create customer success dashboards with Moesif
The first thing you’ll want to do is create two types of dashboards:
- An “overview dashboard” of all customer success metrics to identify problematic accounts
- A “per account dashboard” to zoom into how a single customer is doing
Overview dashboard
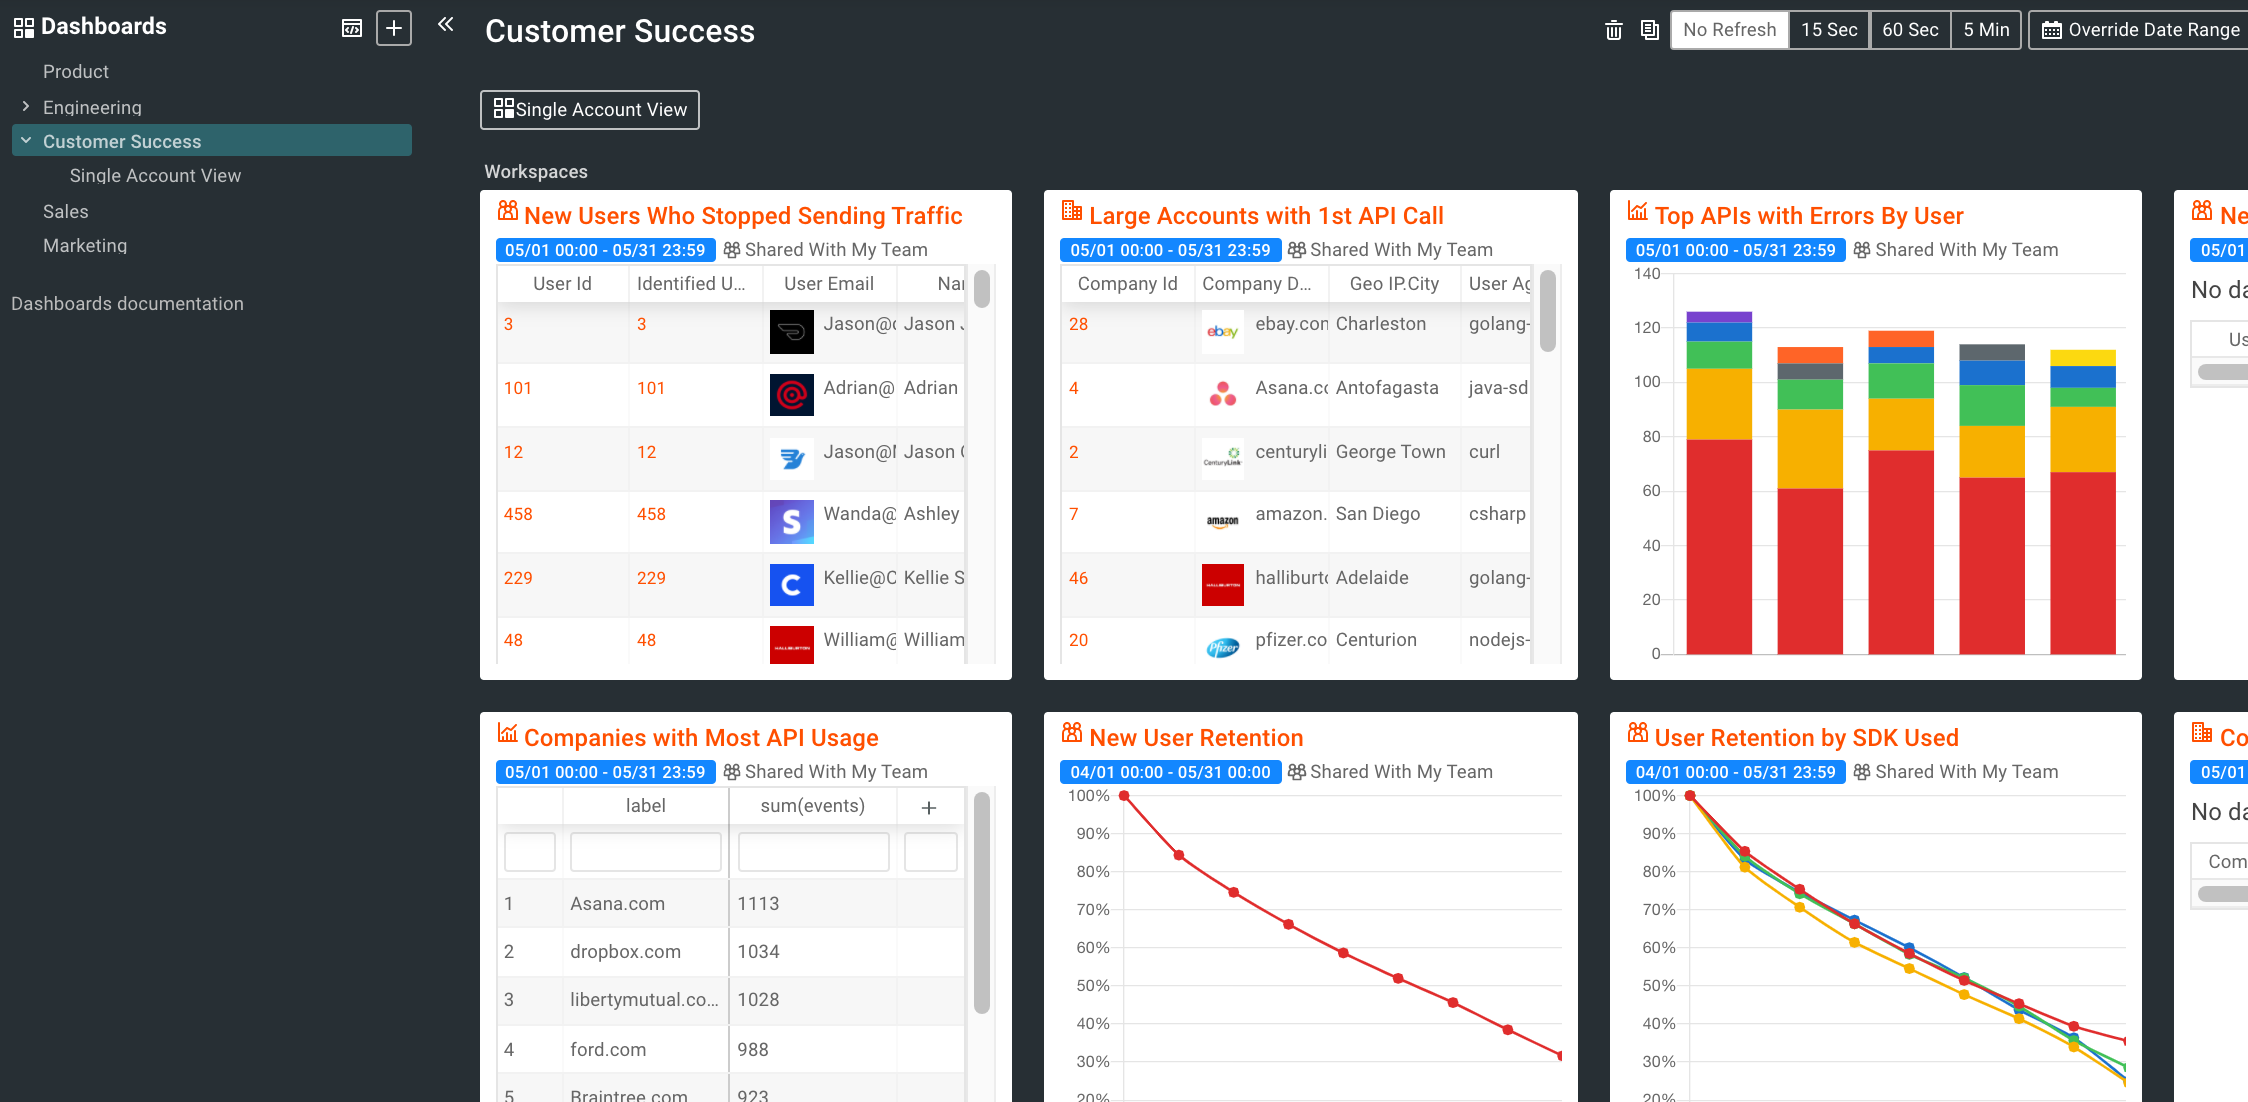
Each Moesif account has a prebuilt dashboard that enables you to gain the following six customer success reports:
| Chart Name | Description |
| New Users Who Stopped Sending Traffic | Shows all users who signed up recently but haven’t sent any API calls recently which could indicate churn |
| Large Accounts with 1st API Call | Understand which large accounts got activated today |
| Top APIs with Errors By User | Monitor users who are experiencing lot’s of errors with the API and may need help |
| Companies with Most API Usage | It’s good to know who your VIP customers are so you can prioritize support |
| New User Retention | If new user retention starts sloping downward, this could imply a serious product or customer experience problem |
| User Retention by SDK Used | Product and customer success teams should keep track of problematic integrations such as buggy SDKs |
These metrics provide a good starting point but you can modify or add dashboards that are specific to your API business.
Per account dashboard
A per account dashboard helps you zoom into how a customer is doing, issues they are experiencing, and provide context on whether you should reach out. Because many API businesses have thousands of customers, it would be tedious work to manually create a dashboard for each account. Instead, we can build a master dashboard and then switch between customers using Moesif’s Filter Override feature.
Step 1. Create the master dashboard
Create a new Dashboard in Moesif with a name such as “Single Account View”. Then, create a new chart that is scoped for a single customer. For example, to show a report on API usage for a single account, click on “Events” -> “Time Series”. Add the filters and metrics of interest as shown below.
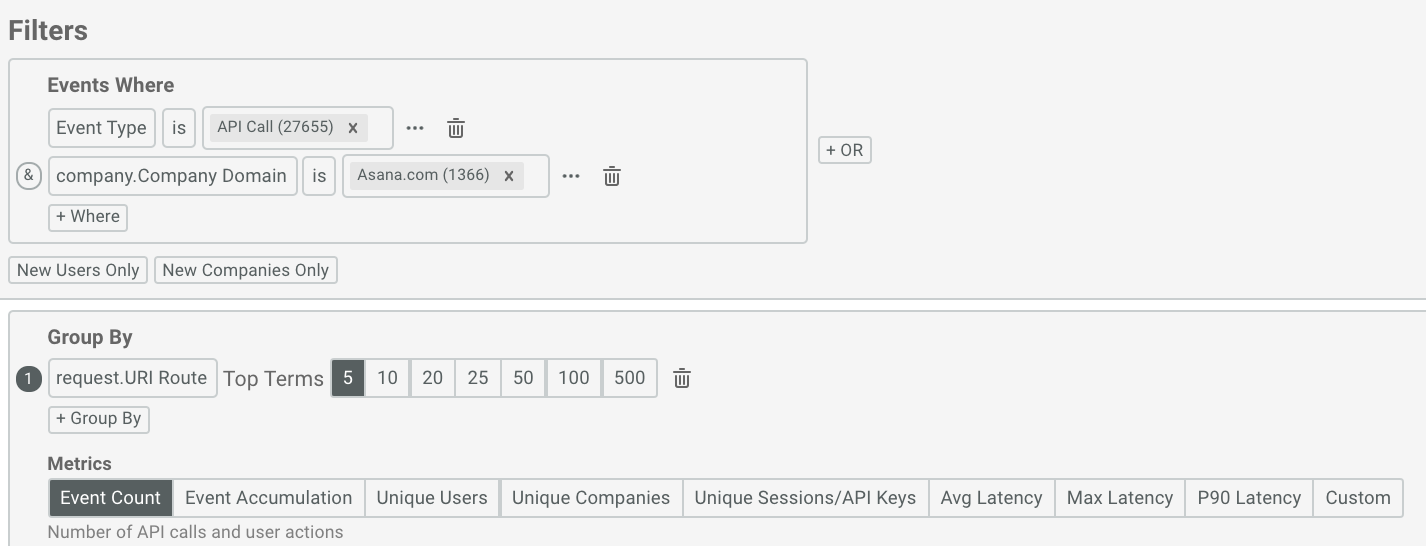
Ensure your chart has a filter for a single account such as by adding a filter on Company Domain.
It doesn’t matter what the value is as it’s a placeholder value. In this case, we selected Asana.com as the placeholder value.
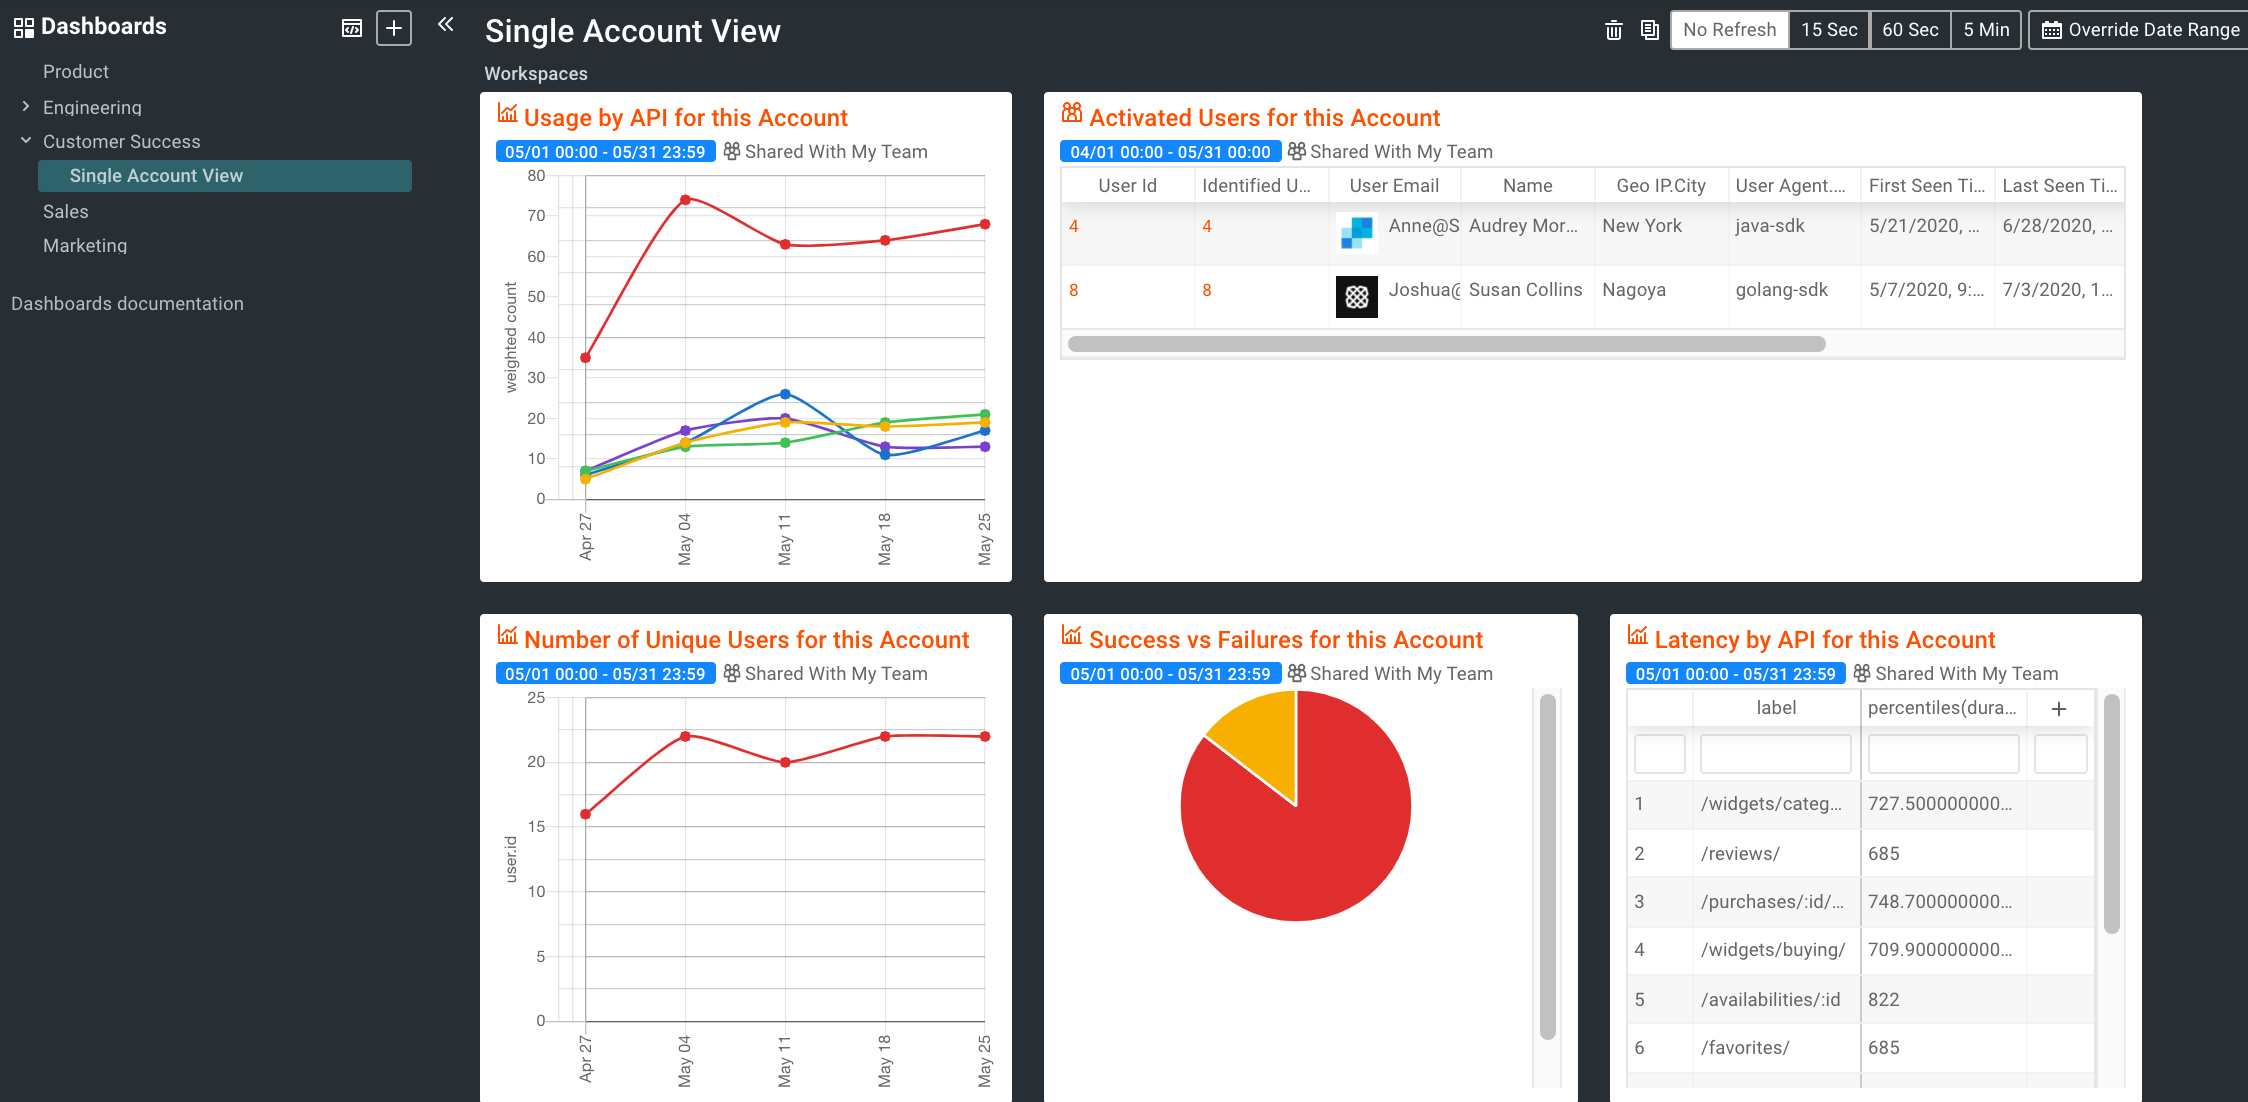
Continue adding the other charts and metrics until your “Single Account View” dashboard is complete like below:
This shows all the metrics related to Asana.com
Step 2. Switch between customers
Now that we built our master dashboard, navigate to it so we can toggle between accounts.
Click the Override Filters button at the top right corner of the dashboard. This will open a popup to select a filter to override as shown below:
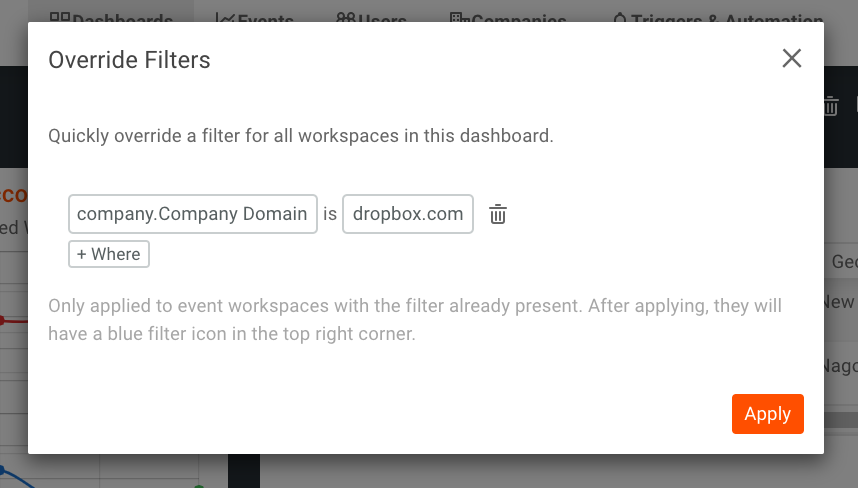
We can add the filter company.Company Domain and enter a different company value than from Step 1 such as dropbox.com and then click Apply
Even though the original dashboards were filtered on Asana.com, this will be overridden with dropbox.com like below:
At the top right of each tile, there will be a blue funnel icon. This icon indicates a filter override was successfully applied to the chart.
How to get alerted on changes with an account’s API usage
Now that we created some dashboards showing account health, it would be helpful to get alerted when one of these metrics are abnormal so customer success can be more proactive at reaching out to customers.
To do this, we can leverage Moesif’s monitoring and alerting features.
Step 1. Create a new time series report
A monitor can be added to any time series chart in Moesif. Go to “Events” -> “Time Series” to start creating a new report. In this case, we want to get alerted when an particular account has a large drop off in API traffic which could imply they are about to churn.
We should ensure we are tracking a drop of in valuable API Calls, so we can add a filter to only monitor calls where response.Status Code is 200 OK. After all, a drop off in 500 errors is a good thing and doesn’t indicate churn.
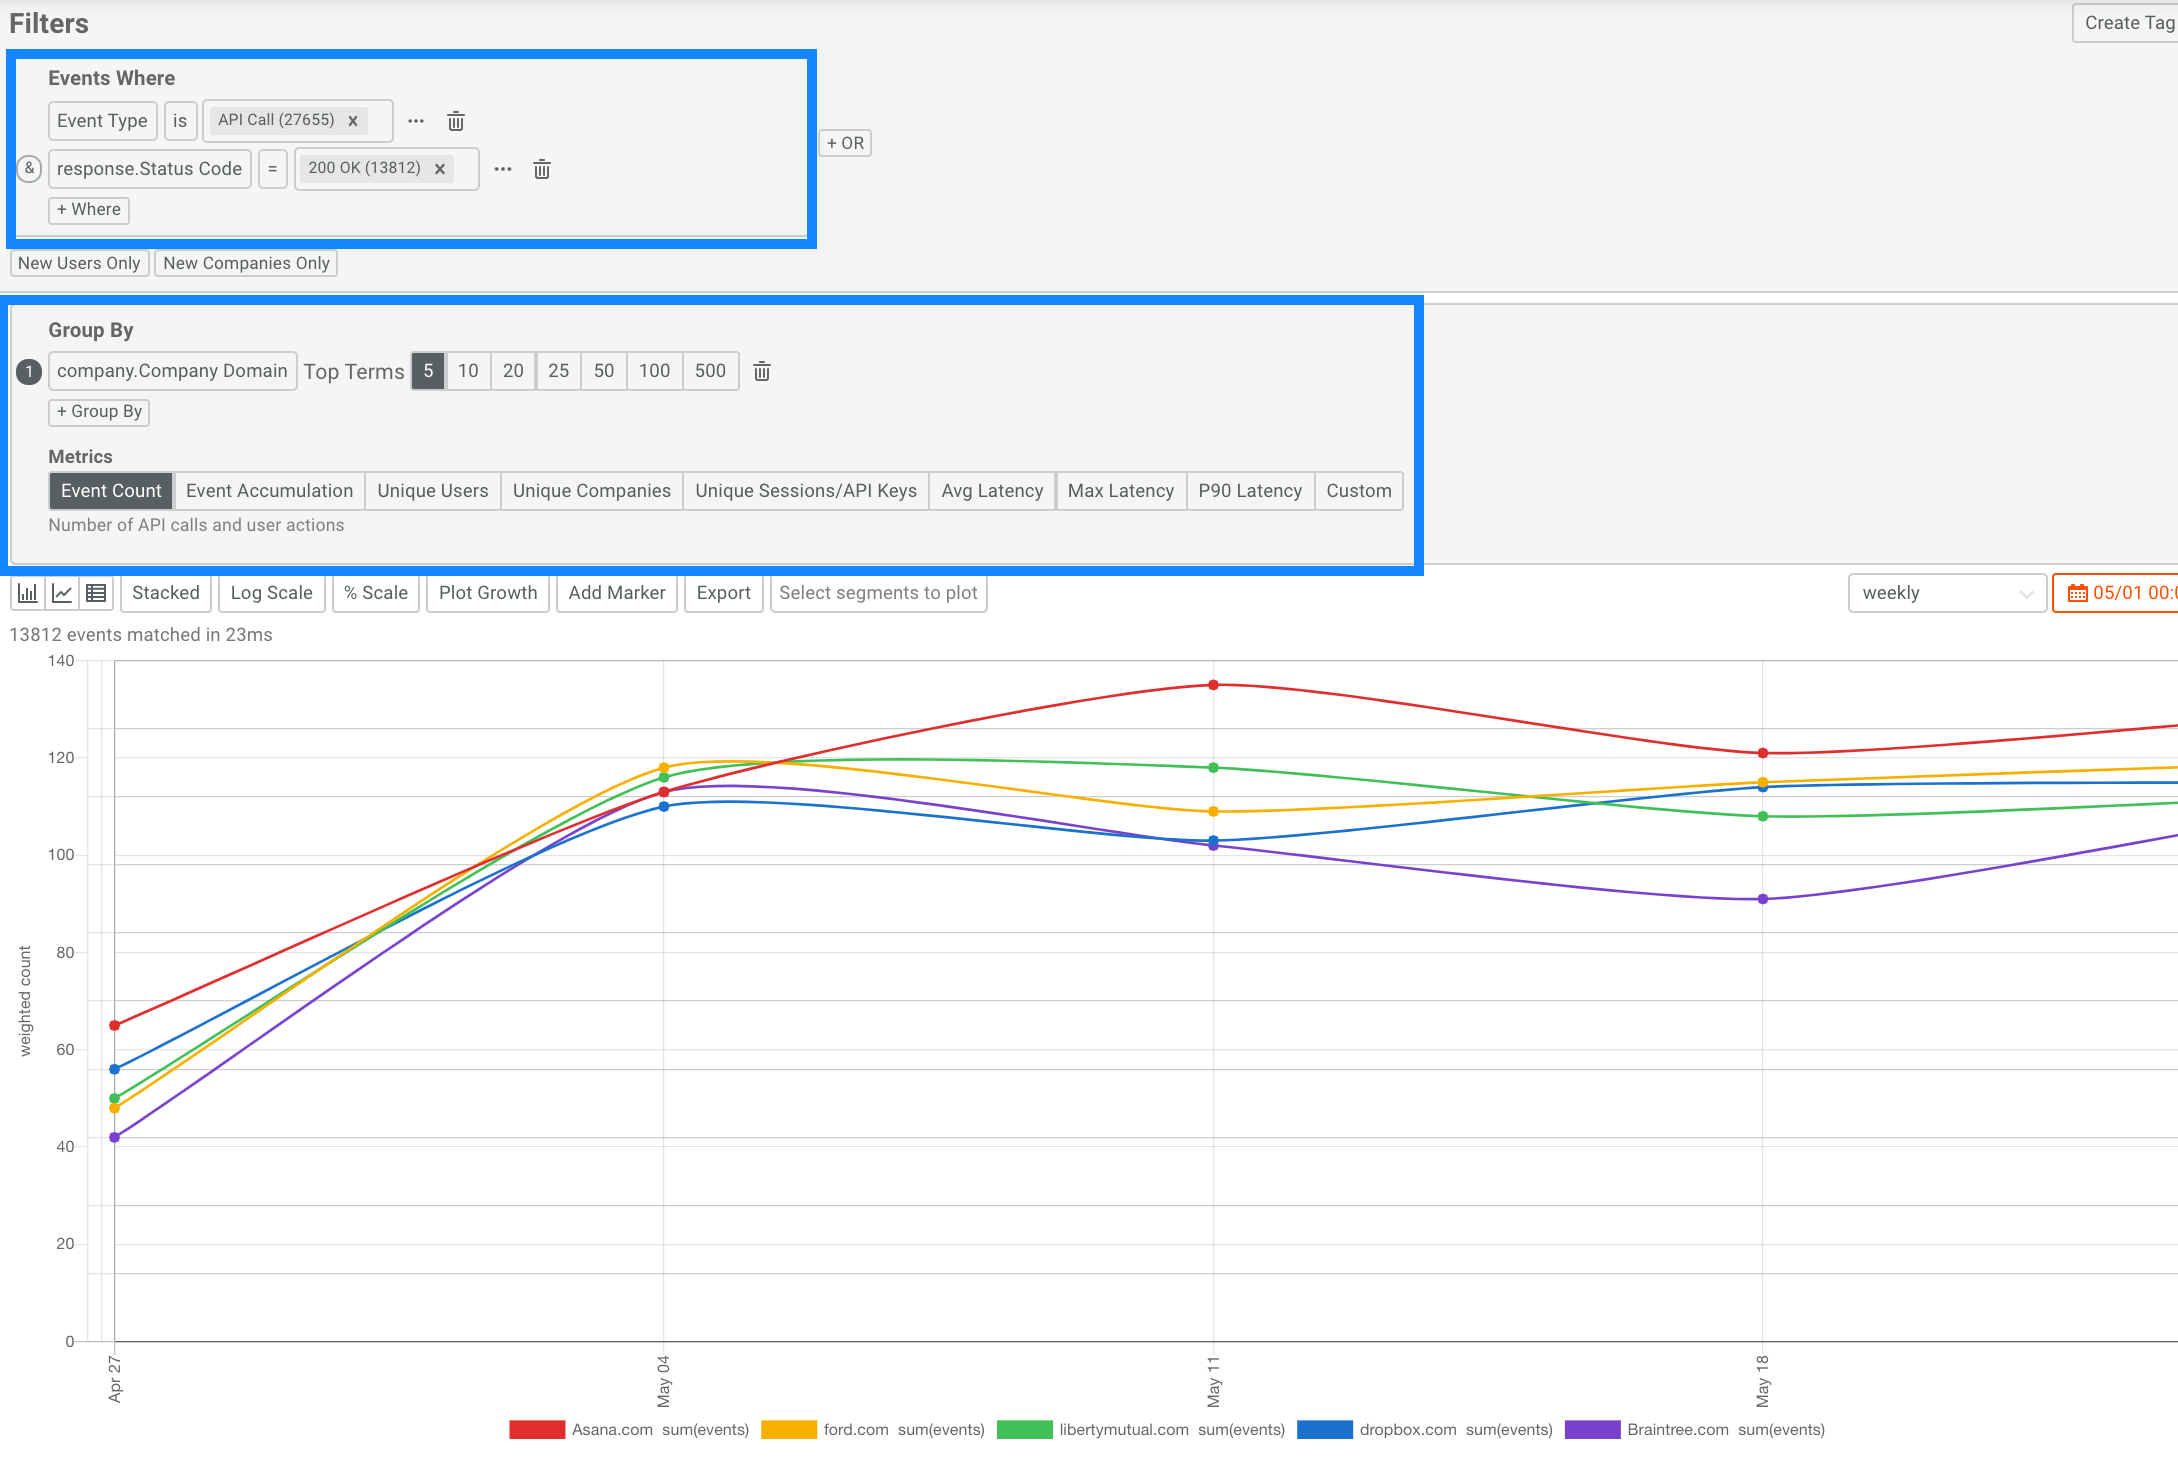
We also want to group by company.Company Domain as shown in the above blue box. This ensures we are tracking each company separately. For the metric, we’ll just select Event Count. We can later create additional alert rules for other metrics like average latency.
Step 2. Create alert rule
Click the orange Alert button, this opens up the Create Alert Rule popup like shown below in the blue box.
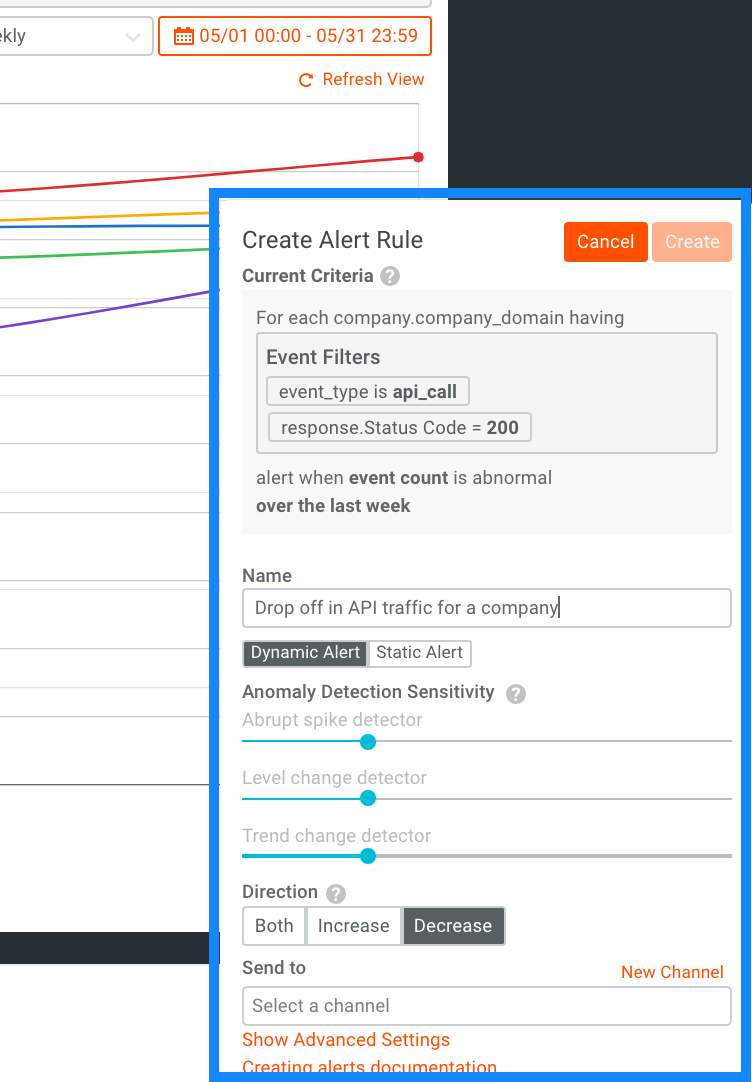
Because we are grouping by company, Moesif will track eah time series (i.e. each company) separately.
Because each company’s API usage varies drastically from one another, dynamic alerts which leverage anomaly detection are more suitable than static alerts.
For direction, select “Decrease”, as we only want to get alerted when there is a drop off in traffic, not an increase. Later, we can create a separate alert focused on increases in API traffic for an account.
Closing thoughts
Many tools out there are not designed for API businesses or focus only on infrastructure health. If you care about your customer’s success, having the right reporting and alerting in place is critical. Moesif is the number one analytics solution for API product and customer success teams to gain self-serve API metrics without being overburdened by high implementation and maintenance costs.

Related Articles

API Analytics and Monitoring
Monitoring MCP Security and Agent Behavior with Moesif
Monitor MCP server security and agent behavior with Moesif. Detect misuse, set alerts, and gain visibility into Model Context Protocol traffic.

API Strategy
Monetizing MCP (Model Context Protocol) Servers with Moesif
Learn how to monetize MCP server usage with Moesif. Track tool calls, enforce usage-based pricing, and meter agent access with full visibility.

API Development
Using Moesif for API Observability and Analytics in NGINX One
Enable API observability in NGINX One with Moesif to track latency, errors, and usage patterns through powerful API analytics and user-aware monitoring.

Podcasts
APIs Over IPAs 19: API Product Management with Emmanuel Paraskakis, Level 250
In this episode, Emmanuel Paraskakis of Level 250 joins to discuss the role and responsibilities of API product managers.
