Monitoring MCP Security and Agent Behavior with Moesif
The Model Context Protocol (MCP) has pioneered a new interface layer between AI agents and tools. It has become easier to enable seamless access to external services, APIs, workflows, and data with natural language. MCP servers are now powering the decentralization of AI intelligence and orchestrating the interplay among modern AI systems. In doing so, they also introduce a more open, fluid, and automation-driven attack surface.
However, traditional API security models weren’t built for this. Agent workloads are unpredictable. Payloads mutate constantly. And malicious use—like scraping, over-permissive tool chaining, or prompt-based exploits—can go past your detection until it’s too late.
This article demonstrates how to secure your MCP server by making agent behavior observable. With Moesif, you can monitor JSON-RPC calls, detect scraping or high-risk tool use, set intelligent alerts, and trace anomalies back to specific users or models.
 Monitor MCP Server Traffic and Agent Behavior with Moesif
14 day free trial. No credit card required.
Try for Free

Why Security in Model Context Protocol (MCP) is Complex
MCP servers, unlike traditional REST APIs, operate as runtime environments for AI agents. These servers accept structured JSON-RPC requests that agents generate from user prompts, ultimately resulting in dynamic tool executions. This effectuates security challenges that stem not from protocol flaws, but from the unpredictable and autonomous nature of the clients themselves.
MCP clients are not humans—they are large language models (LLMs) or agents acting programmatically. Your single prompt can generate hundreds of requests, chaining multiple tools in the process. These requests might not follow rate limits, adhere to expected usage patterns, or even originate predictable flows. They can trigger storage access, execute shell-like operations, or stream unstructured data back to the user. That means you can’t derive intent from traffic shape—and traditional WAFs or API gateways often miss real threats.
The payloads are just as unpredictable. Because MCP uses JSON-RPC, every request can look syntactically valid while semantically dangerous. For example, an agent calling a file retrieval tool may specify arbitrary file paths, query large datasets, or pull records only meant for restricted access. Since agents generate payloads, prompt injection becomes a real attack vector; a compromised instruction can push an agent to chain tools in unexpected or malicious ways.
Complicating matters further, MCP tool interfaces are often exposed without granular security controls. Many teams launch a server with file access, API wrappers, or internal automation tools and expose them through MCP’s standardized method layer. Without fine-grained authorization or telemetry, it’s difficult to know who is doing what, and when. Its ramification also provokes cost-based abuse. An attacker may not steal data but instead overwhelm your infrastructure with calls to expensive tools—triggering third-party APIs or compute-heavy workloads that rack up unintended costs.
Traditional API security has been built around predictable analytics, static schemas, and authenticated users. Its architecture proves ill-suited in environments where LLMs behave as clients, tools form dynamic chains, and traffic reflects emergent agent behavior.
MCP security requires a different mindset. You have to assume unpredictability, focus on runtime visibility, and treat tool invocation patterns as part of the security surface. Without telemetry and behavior monitoring, you risk blind spots that static access controls can’t catch.
Key Security Risks in MCP Servers
Scraping
A user prompt might result in dozens—or hundreds—of file retrievals, search operations, or API calls. Without visibility or usage caps, this behavior can result in silent scraping of large volumes of sensitive or proprietary data.
Each request, being JSON-RPC, appears structurally valid. Therefore, it becomes difficult to distinguish automated overuse from legitimate access—especially when the agent is simply following the logic encoded in its prompt.
Suspicious Tool Chaining Behavior
AI agents often invoke multiple tools in sequence to fulfill a prompt, but some usage patterns indicate elevated risk. When tools that typically operate independently are accessed in brisk succession—or repeatedly by the same user—it may signal prompt injection, misuse, or inadvertent escalation.
These tools are hard to detect with static request validation alone. Each individual call may appear legitimate, but in aggregate, they may reflect abnormal behavior. The real threat lies not in the tool access itself, but in how tools form a chain to amplify access or cost.
Excessive Data Exposure
MCP servers often return large, loosely structured responses, for example, full documents, datasets, and HTML content. These payloads rarely go through inspection for volume, structure, or sensitivity. An unbound agent—or malicious user—can repeatedly extract large quantities of information simply by iterating over such high-yield responses.
This form of passive exfiltration might be difficult to detect if your server doesn’t log response sizes or classify content types. And because MCP calls look semantically similar regardless of intent, detection requires tracking usage patterns, not just request signatures.
Overuse of Costly Tool Invocations
Some of the most expensive misuse happens when AI agents repeatedly invoke tools that trigger compute-heavy tasks. Since agents are stateless from a billing perspective, they don’t distinguish between free and expensive tools. If your server exposes actions that incur third-party costs or backend strain, a single agent loop—or misaligned prompt—can exhaust resources quickly.
Weak Observability into Agent Behavior
The vast majority of MCP implementations lack sufficient telemetry to audit what users and agents are doing. Consider metadata like tool category, payload shape, token counts, and content size. Without logging such details, it becomes nearly impossible to detect suspicious behavior until damage has occurred.
A single user could trigger tools in succession, perform access attempts, or consume high-cost resources, all without tripping alarms—simply because you didn’t have the necessary fields to correlate activity at runtime.
Inadequacy of Traditional REST-Based Controls
MCP servers differ from REST conventions. They typically expose a single endpoint through method-based dispatch logic. This breaks common assumptions around URI-based access control, static schema validation, and endpoint-specific rate limits.
Without parsing each request’s method and intent, your server’s controls can’t differentiate between high- and low-risk operations. This makes it easy for misuse to hide in plain sight—especially if all access appears to be hitting the same surface area.
How Moesif Helps Provide Visibility in MCP Traffic
Traditional API logs and transport-level monitoring fall short because they lack visibility into structure and intent of agent-driven calls. Moesif helps you solve this by transforming your raw MCP server traffic into structured, meaningful insight.
Parsing Method-level Activity from JSON-RPC Payloads
Most MCP servers expose a single RPC endpoint, encoding actual tool usage in fields like method, params, or tool_name. Moesif captures each request out of the box and logs them with details like the following:
- Method name
- Response status code
- Customer identifiers (like user ID and company ID)
- Request and response headers
You can add custom metadata as well.
The following shows a Live Event Log in Moesif with some MCP traffic details.
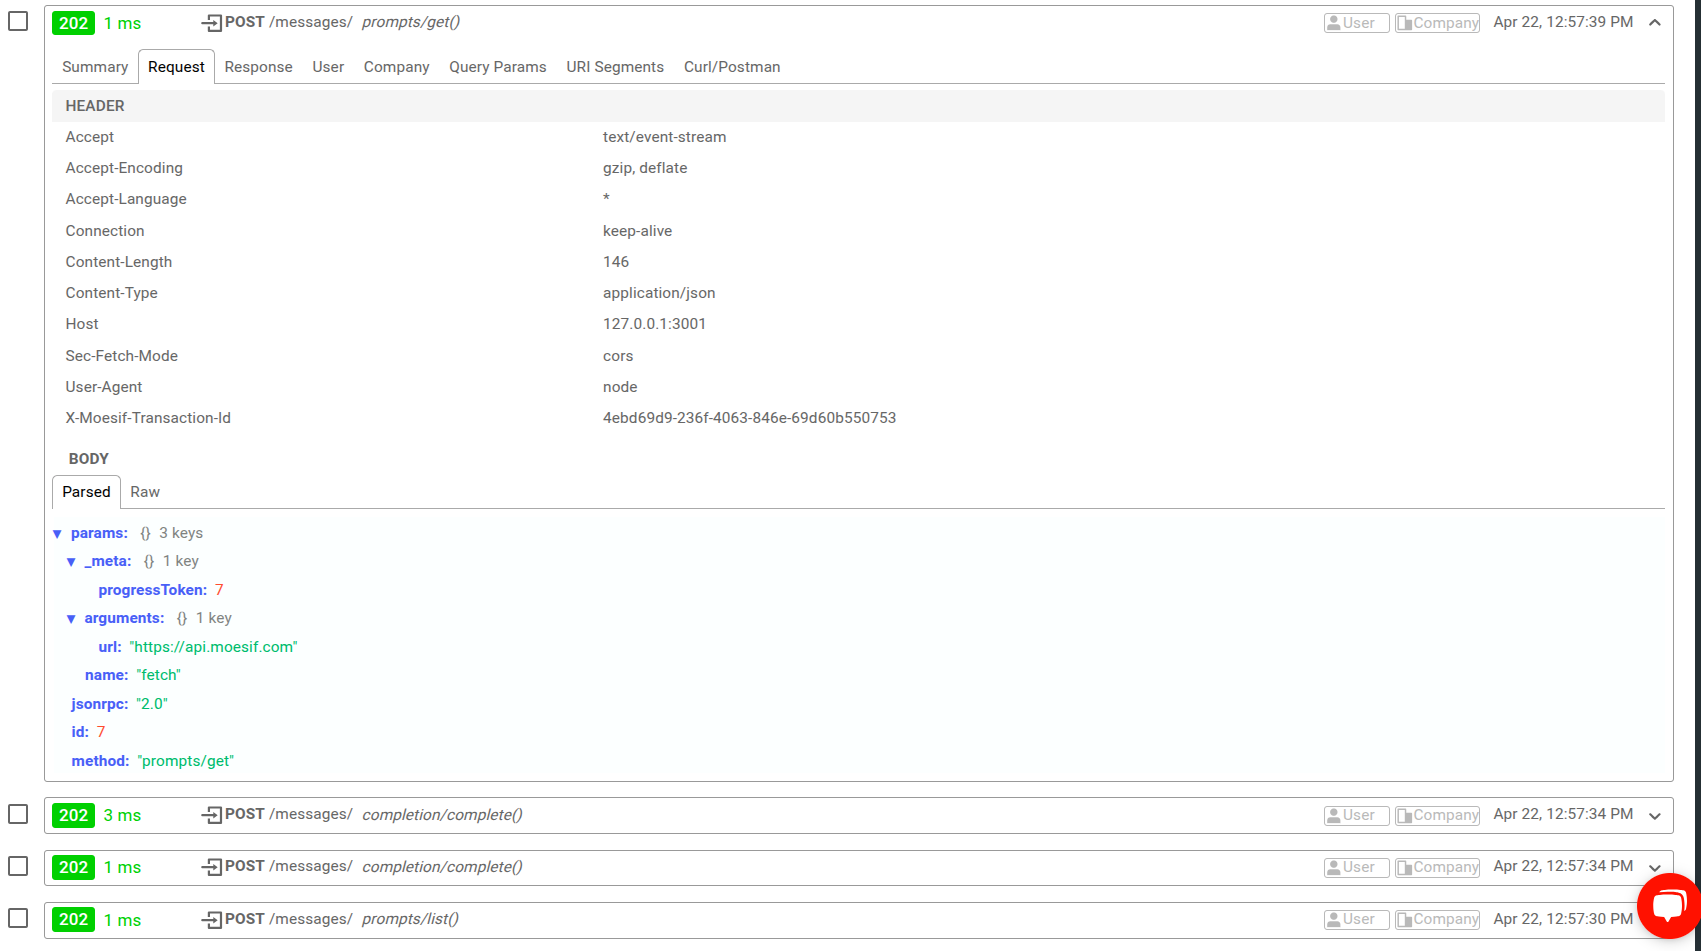
This allows teams to distinguish between otherwise identical calls to the endpoint based on what the calls are actually doing—whether that’s accessing a document, querying a database, or running a transformation pipeline. It also means every tool invocation becomes traceable and attributable.
Visibility into Patterns of Misuse
Many of the most damaging behaviors—like scraping, agent looping, or excessive chaining—only become visible in aggregate and context. Moesif helps you detect anomalies by comparing behavior over time, across users, sessions, or methods, using time series. For example, you can use Segmentation to filter and group traffic by different criteria:
- Total number of requests per method or tool category
- Unusual spikes in response size, latency, or payload complexity
- Usage by users or API keys
Since traffic is available in real time, Moesif can also help investigate sessions escalating from low-risk to high-impact tool usage. You can observe the shape of the abuse, even if no single request looks malicious.
Trace Incidents Across Sessions, Agents, and Models
Attacks on MCP servers sometimes unfold slowly, across dozens of requests or over long-lived agent sessions. Moesif’s ability to contextualize and link events by user ID, session ID, or custom fields (like agent_version or model) helps you follow that progression. It becomes easier to investigate after the incident or detect an issue while it’s still unfolding.
You’ll find it especially useful when diagnosing high-cost activity or confirming whether a behavior originated from a human, an automated agent, or an injected prompt.
Reveal Hidden Cost and Abuse Signals
Security risks can also have economic repercussions. Recurrent calls to expensive tools, high token counts, and excessive outbound API usage can quietly consume resources. Moesif can help reveal:
- Users driving disproportionately high infrastructure cost
- Patterns of redundant tool invocation
- Frequent retries or failures that may signal scraping attempts
For example, consider an agent invoking the same service with identical input. With Moesif you can:
- Filter those requests.
- Observe the lack of variance in the
params. - Group them under a single user or API key.
- Spot and get alerts on the abnormal call frequency compared to the rest of your user base.
Setting up Security Alerts in Moesif
Once you’ve instrumented your MCP server and gained visibility into agent behavior, the next step is to set up automated alerts that catch abnormal usage and notify you in real time.
Moesif provides a flexible alerting and monitoring system where you can define behavioral thresholds, monitor usage in real time, and escalate issues through your notification channels of choice.
Define Behavioral Thresholds
Unlike traditional API rate-limiting tools, Moesif alerts have been designed to track semantic patterns across requests. Rather than merely setting limits on request counts, you can enforce thresholds based on user attribution, patterns, and resulting system impact.
Here are some examples that you can base your alerts on in Moesif:
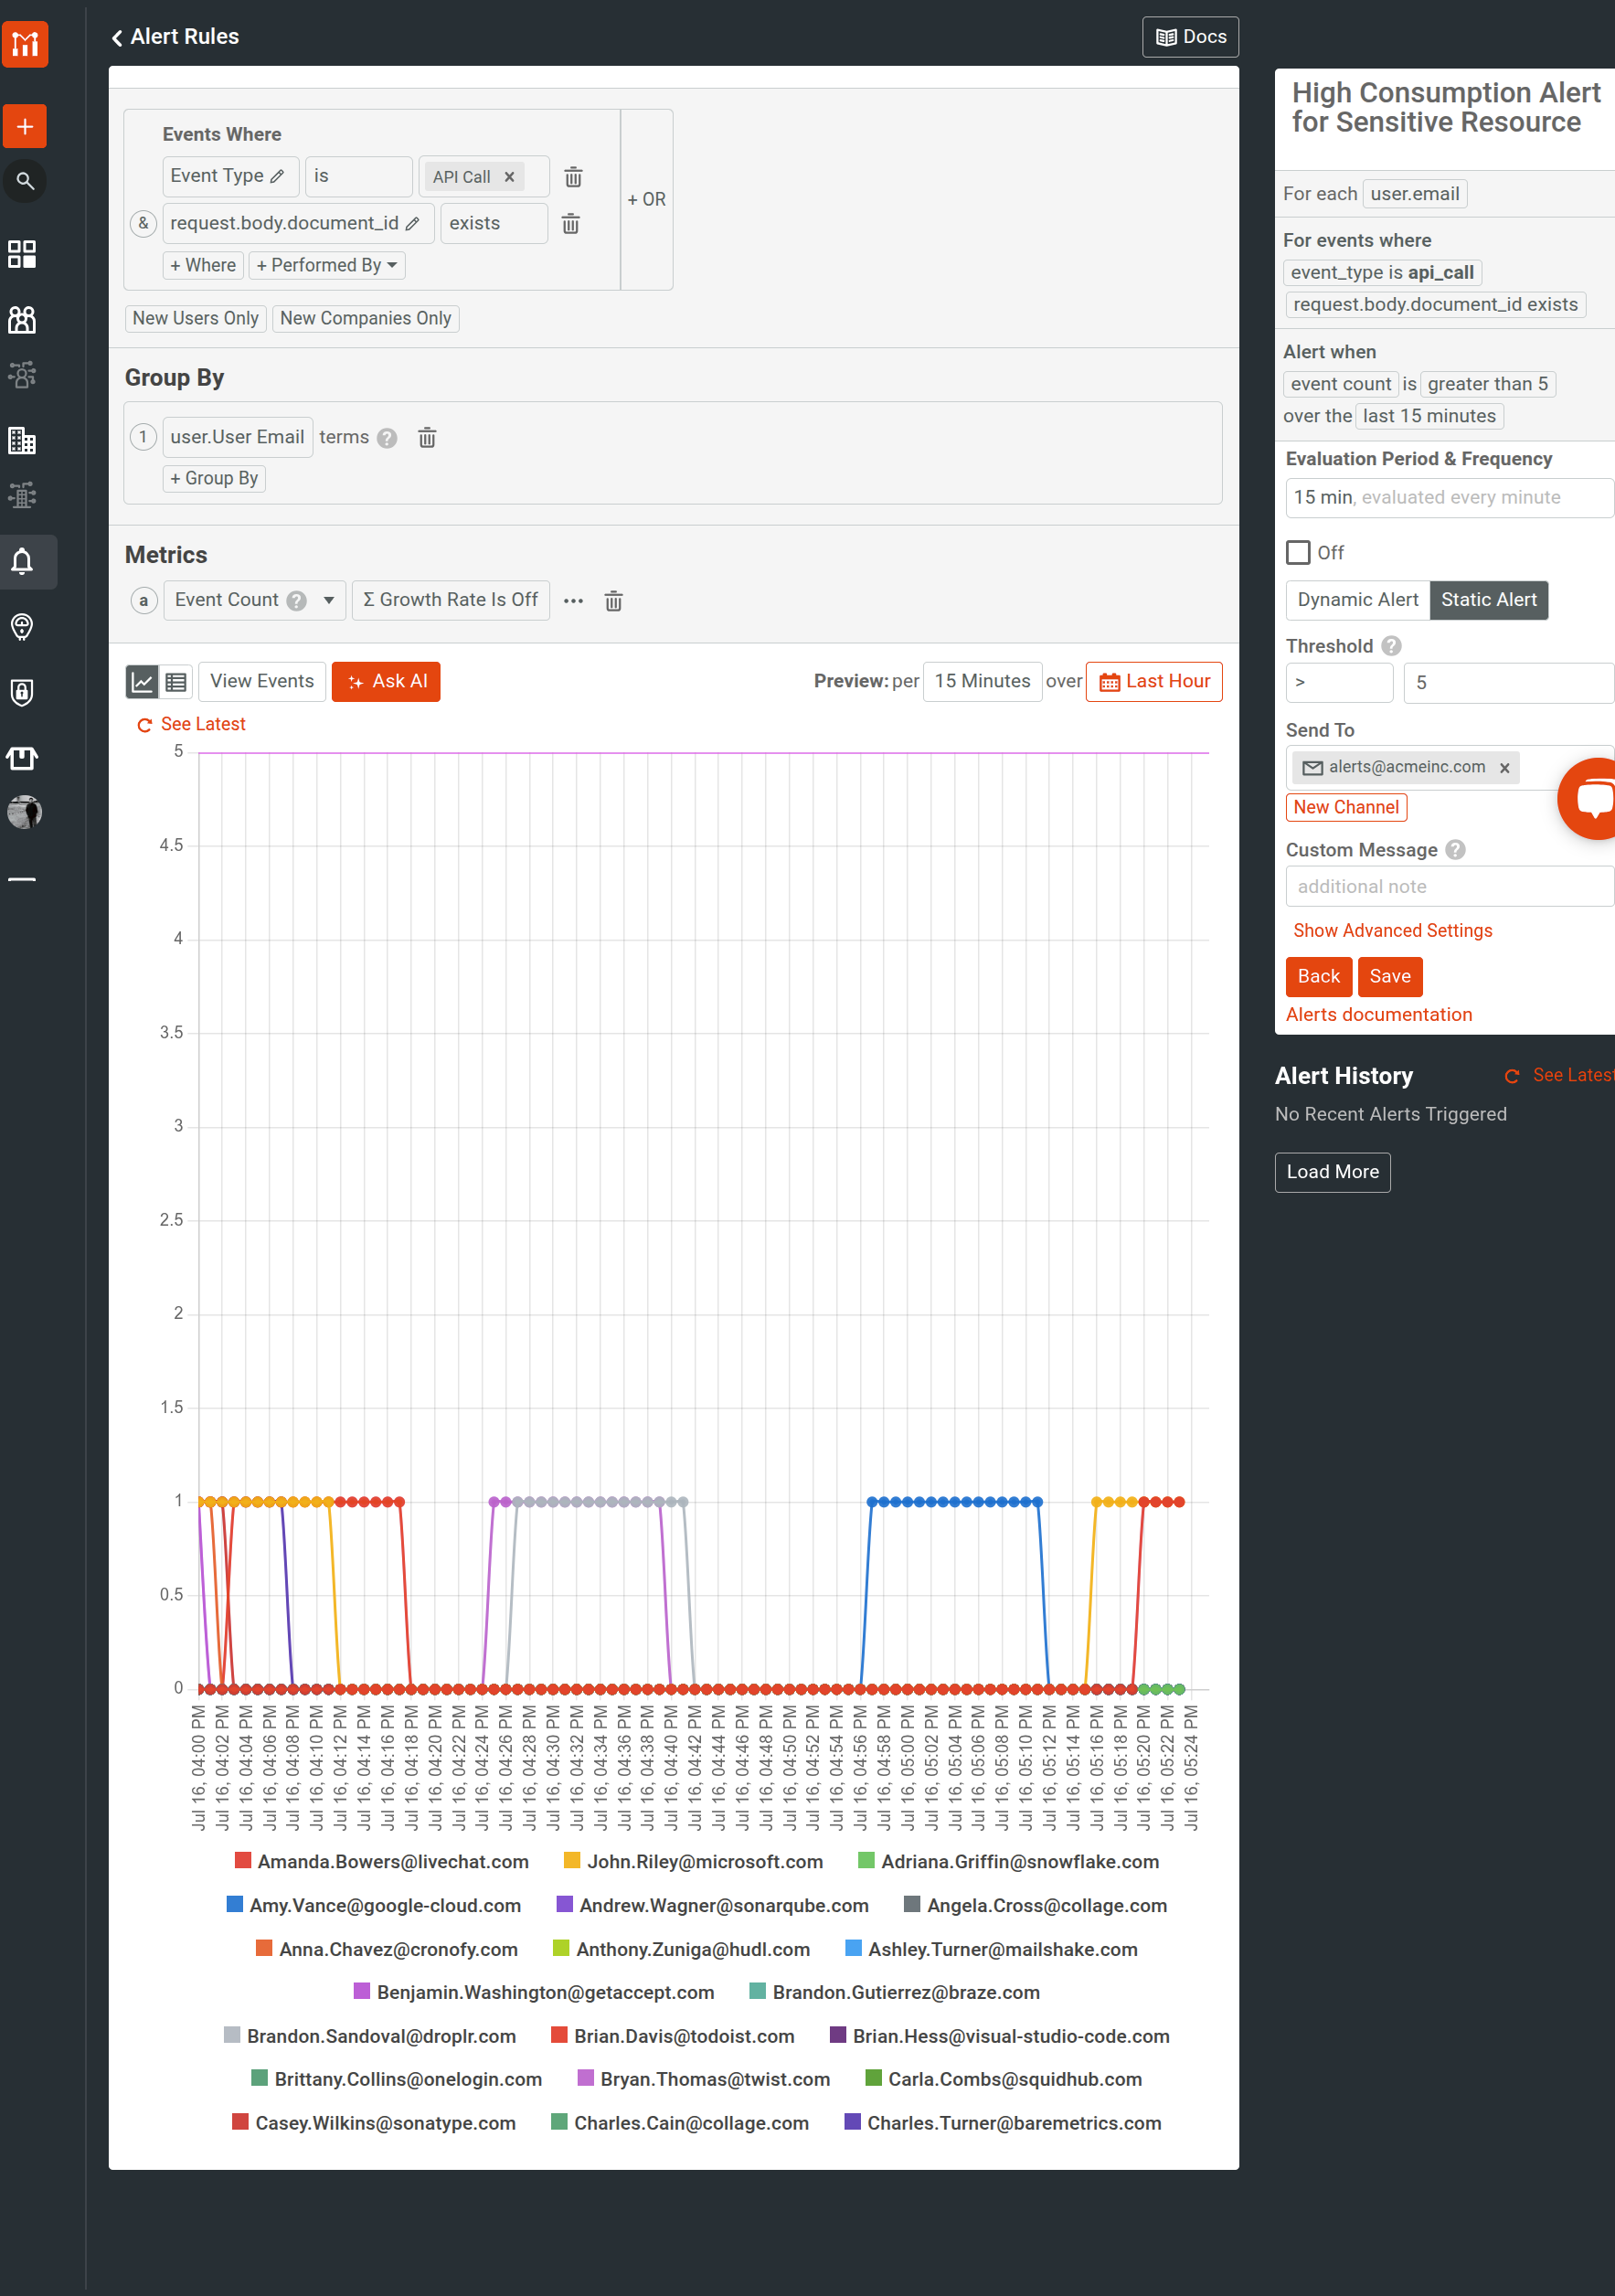
- Tool usage frequency—the following creates an alert to monitor privileged data access, defining a threshold of 5 requests per identified user in 15 minutes:
![Moesif Alert Rule for alerting on sensitive data access. An alert rule in Moesif]()
- Response size anomalies—for example, responses larger than 1 MB.
- Payload shape—like unusually nested or large input payloads, using
key countandcountoperators.
Create Alerts from Time Series
In Moesif Time Series, you can configure alerts directly as you set up the analysis. You can start inspecting a specific call pattern or behavior, then a rule based on that filter.
For example:
- Inspect spike in document-access requests.
- Filter for a specific user, content type, and response size.
- Select Alert to monitor for recurrences of that pattern.
For example, the following Time Series defines a custom metric to analyze input token consumption, and categorizes the data by user IDs.
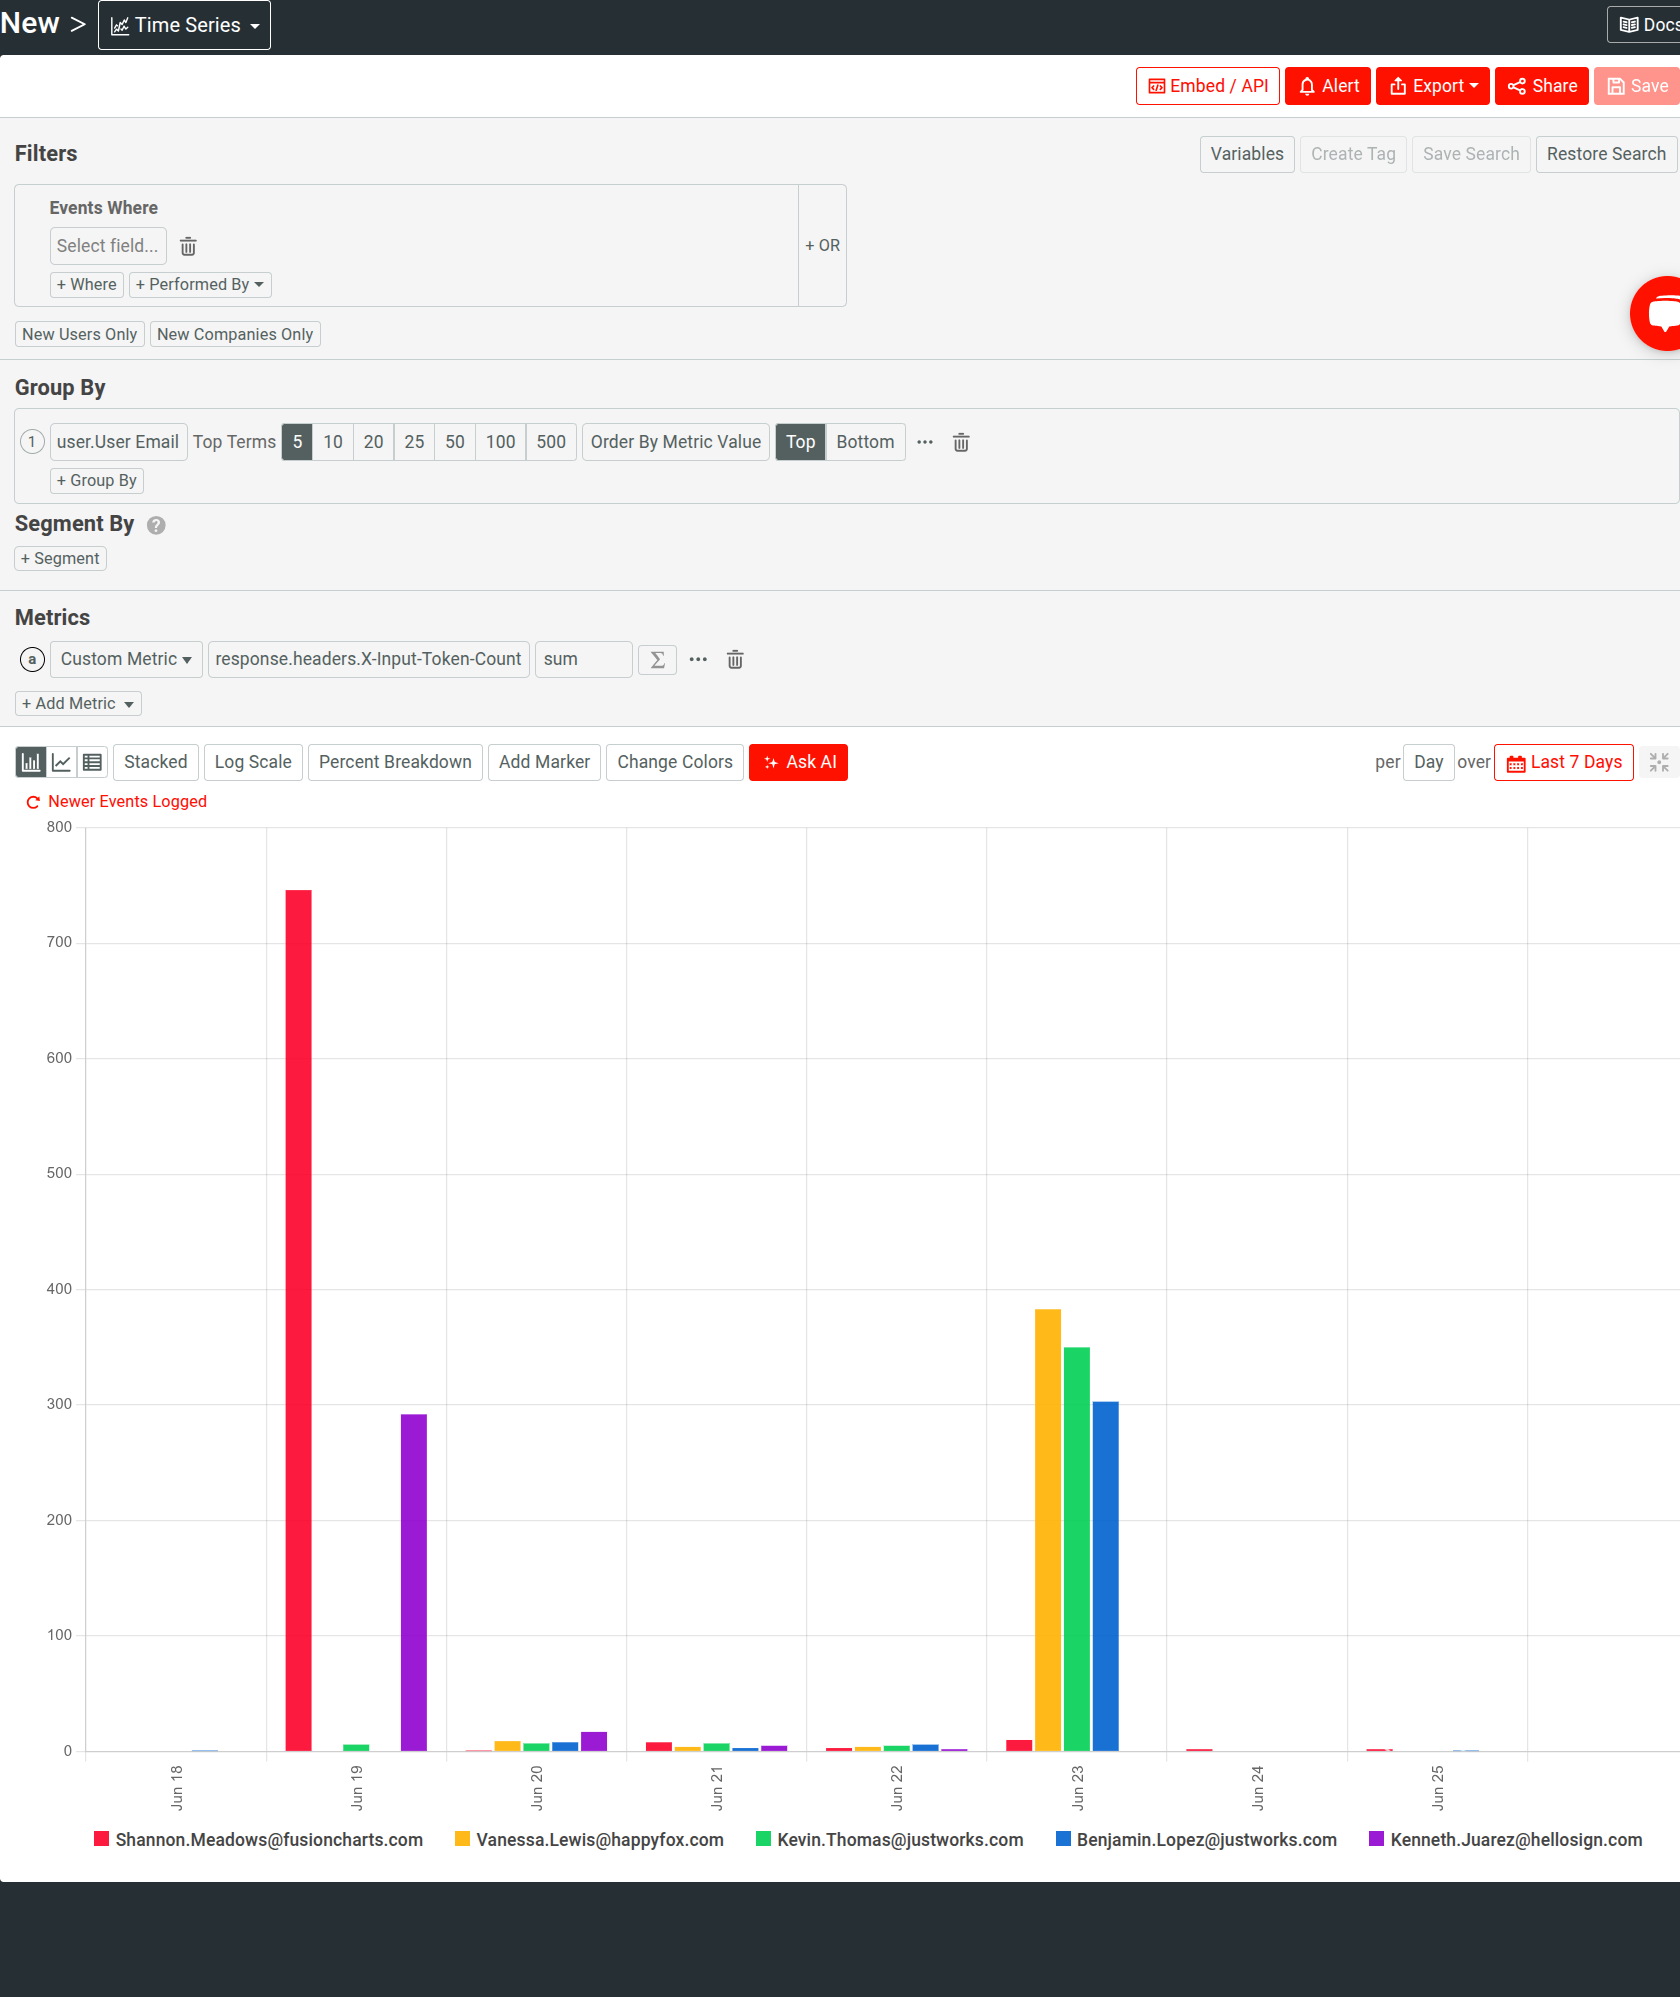
Selecting Alert takes you to alert configuration with the existing criteria applied where you can start fine-tuning the alert.
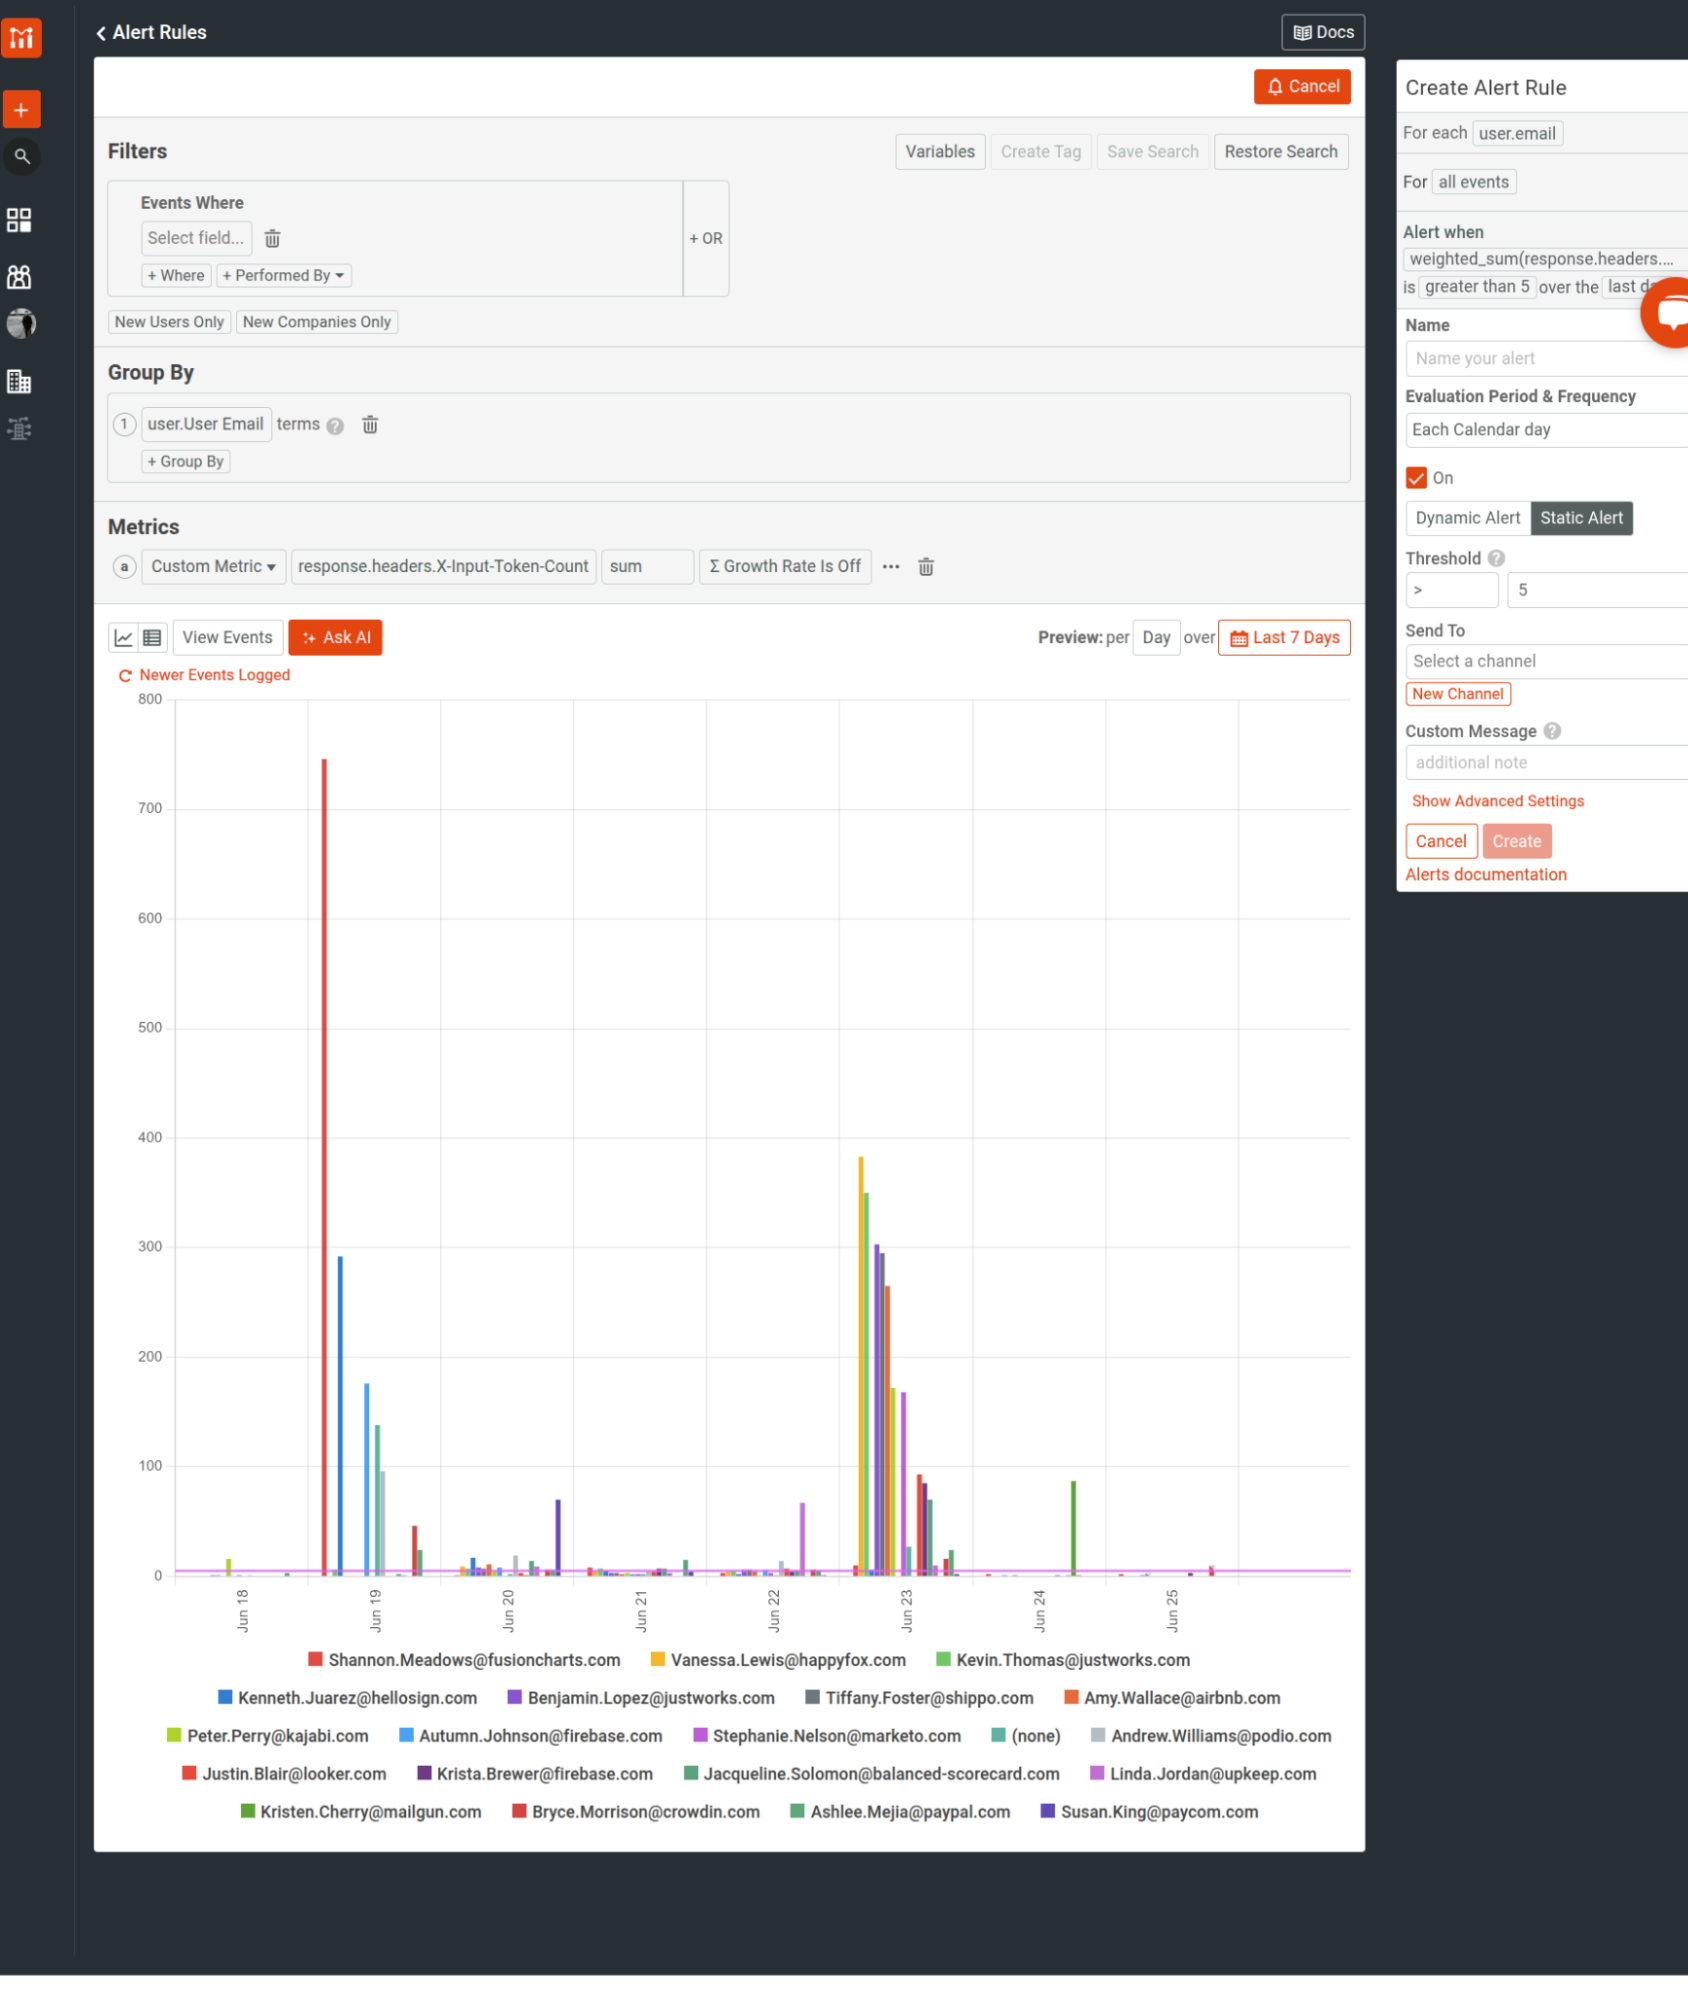
You can select View Events in the alert pane to see the events under the same event filters criteria and time range.
Alerting Channels and Integration
You can configure alerts in Moesif to dispatch them to various channels:
- Slack for real-time team visibility
- PagerDuty for incident response
- Email for security notifications or user audits
- Webhook endpoints for custom automations or throttling logic
For email notifications, a triggered alert looks like this:
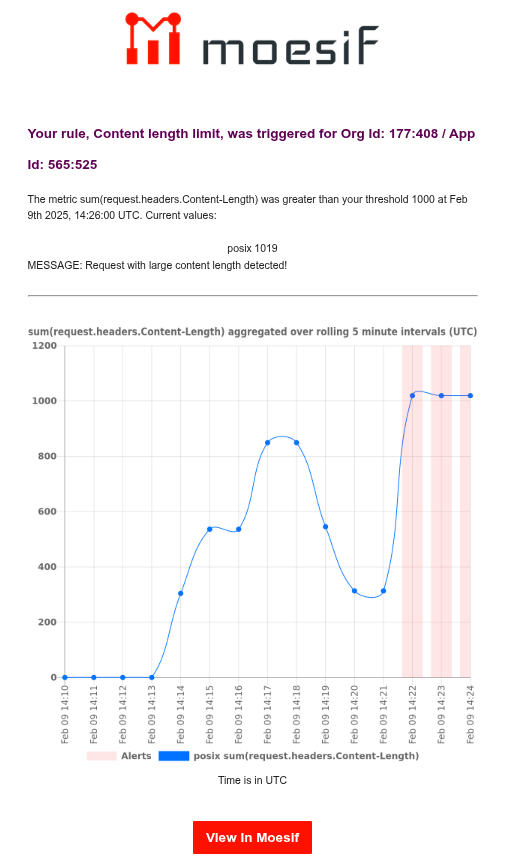
Select View in Moesif to view the details in Moesif dashboard. There, you can select View Events to observe the corresponding events in a Live Event Log workspace. This allows you to quickly zero in on events that have triggered a rule.
Alerts Without Latency or Performance Impact
Moesif alerts operate asynchronously and do not introduce latency into your MCP server flow. Since Moesif handles observability through SDKs or gateways with lightweight, non-blocking instrumentation, alerting doesn’t slow down your agent workflows or impact user experience. This makes Moesif suitable for not just production use, but also for high-throughput or real-time systems where you can’t afford to compromise performance for monitoring.
Final Thoughts
MCP security is a systems problem—one rooted in behavior rather than access. The autonomy AI agents now possess has introduced risks that you can solve only by understanding how tools are used, how behavior changes over time, and how real users and agents shape your system. You must treat observability as a design requirement, to successfully build MCP servers that scale without silently failing. For software teams building AI agents and tool-based orchestrations, this is the baseline for doing it responsibly and sustainably.

