Heatmap Reports
This document explains how to use Geo Heatmap in the Moesif’s API Analytics suite.
Overview
A heatmap visualizes frequency of data at geographic locations using a range of different colors. Heatmaps are a great way to understand your product, its users, and how both correlate when geographic location is an important part of your analytics requirements.
Moesif’s Geo Heatmap supports supports GeoJSON and the full range of filters available in other metric types such as Live Event Log, Time Series, and Segmentation.
Use Cases and Benefits
If your product has a large customer base spread across different regions, Moesif’s Geo Heatmap can help you quickly pinpoint regional issues.
For example, the following heatmap filters by the number of declined transactions globally.
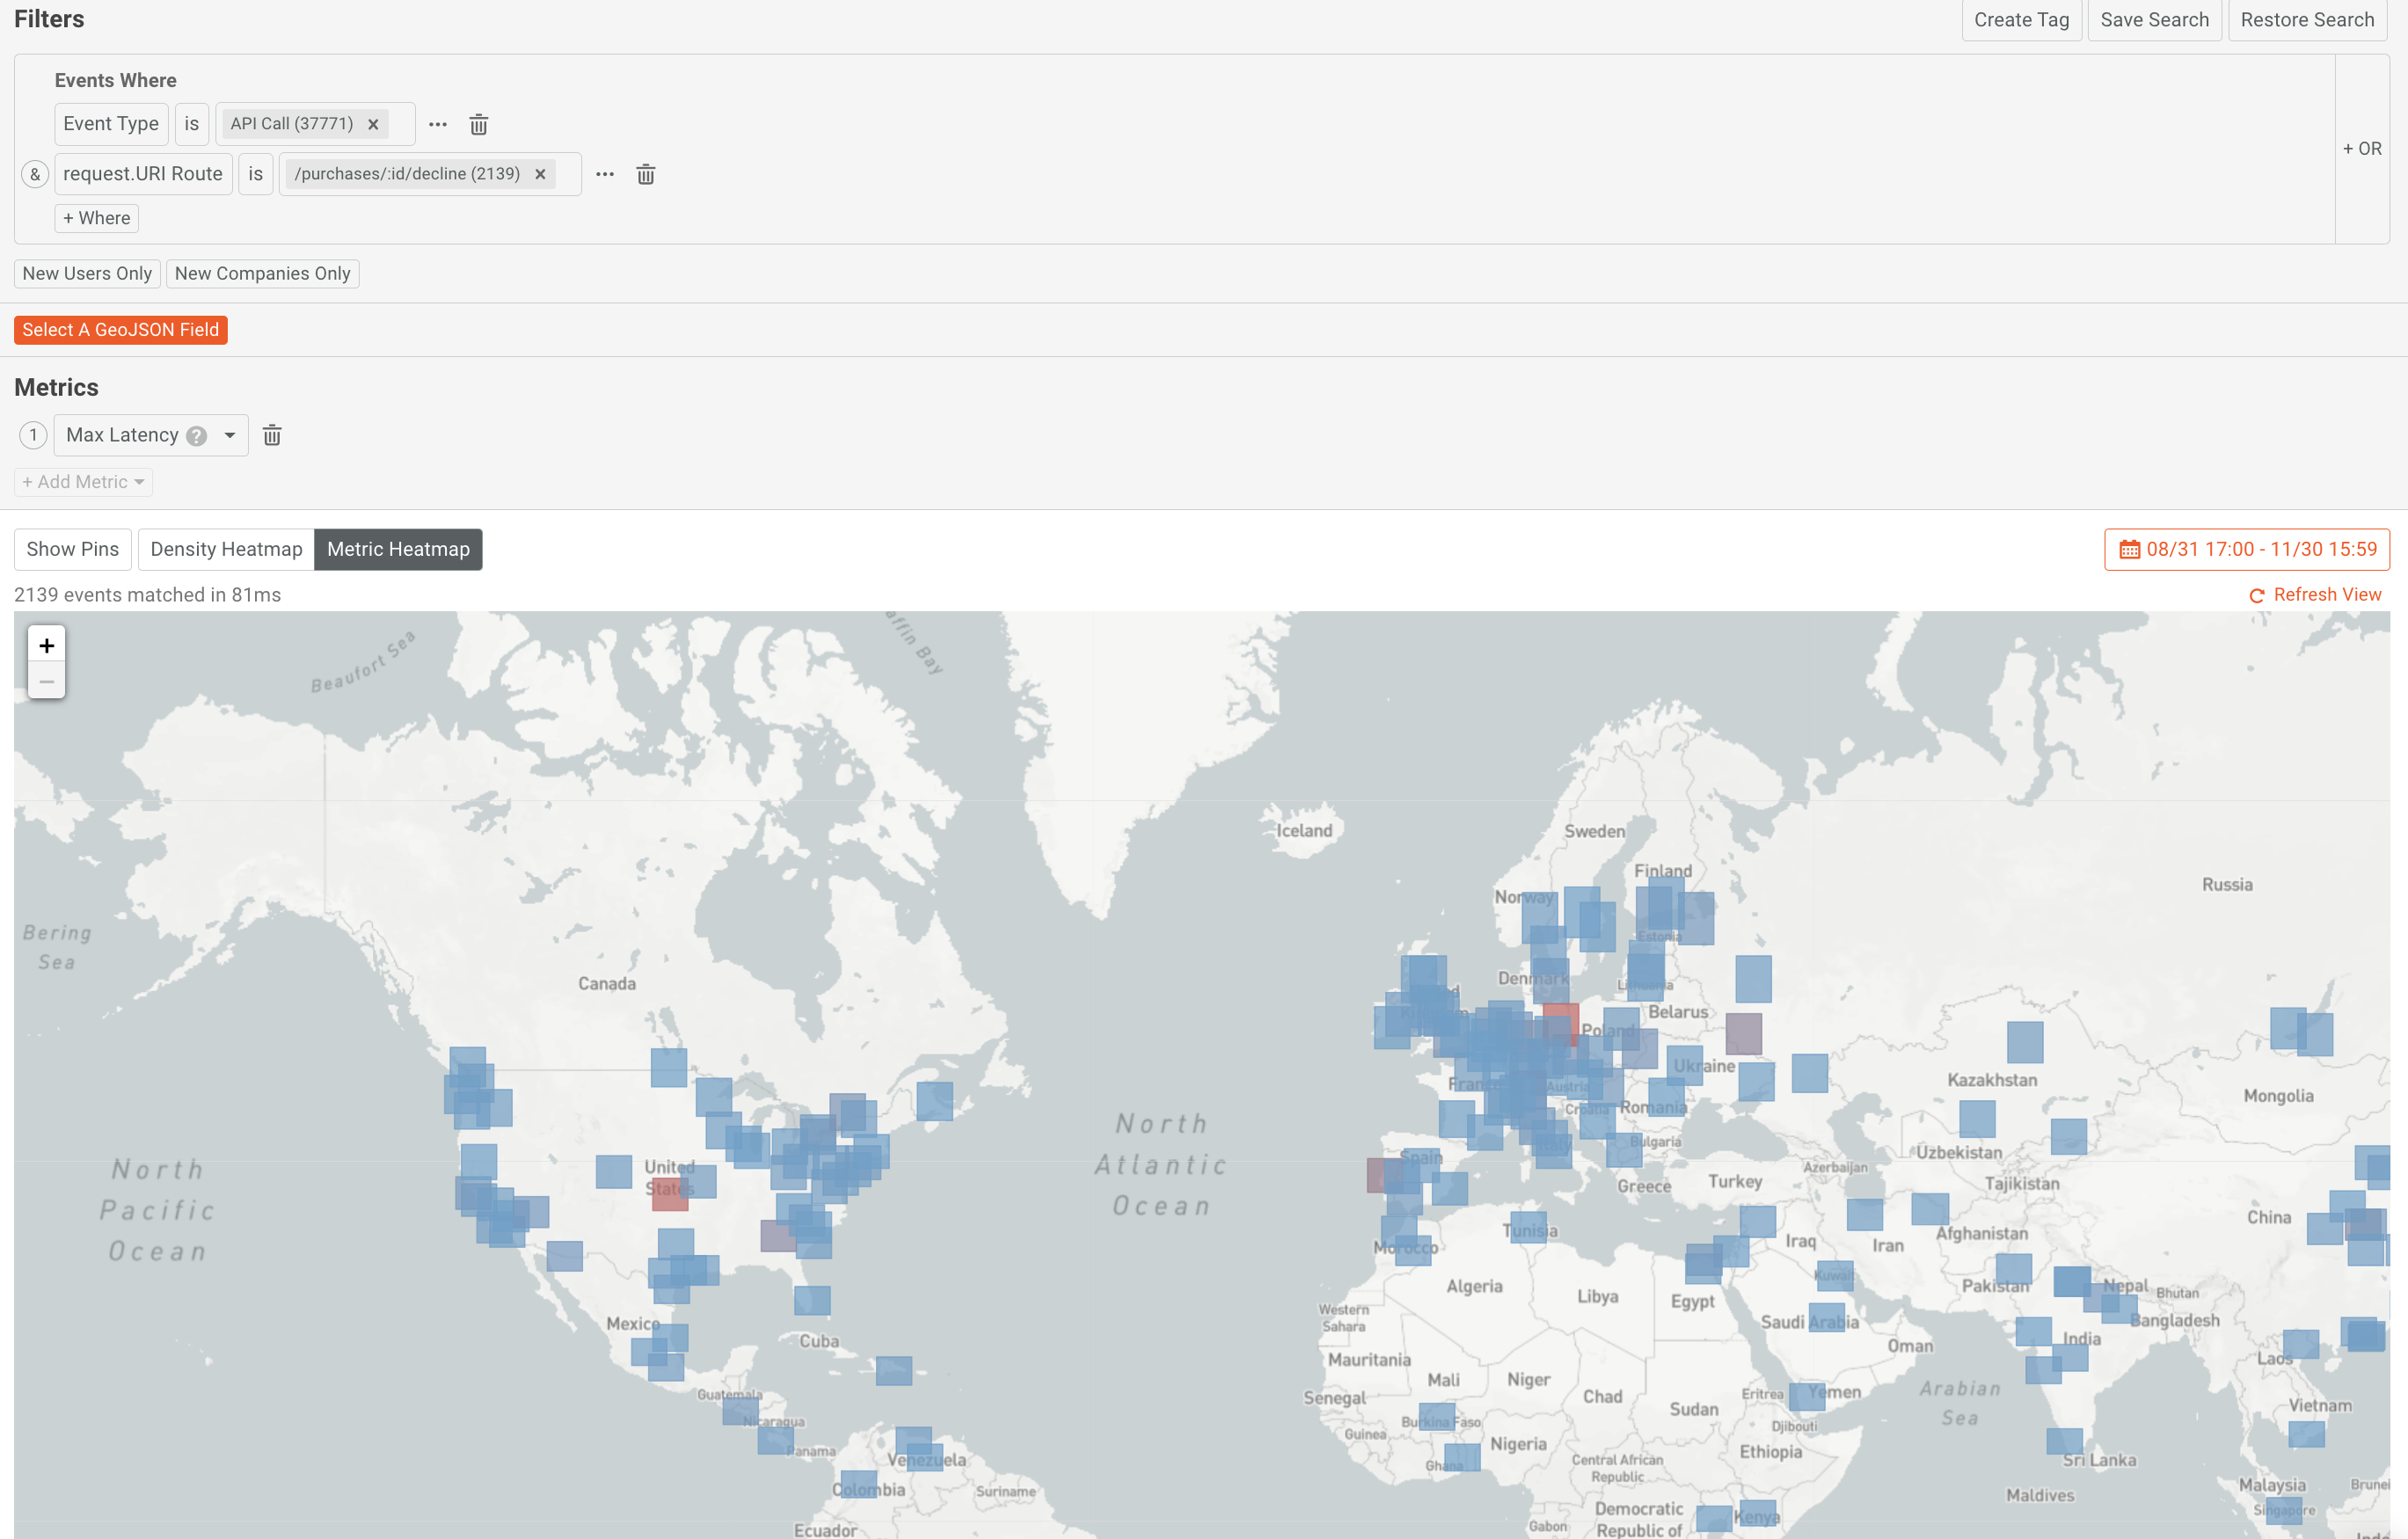
The heatmap shows a large portion of 401 Unauthorized response status codes coming from the Eastern US. The aggregate stats get updated as you apply more filters. In this case, the majority of 401 Unauthorized status codes come from the /availabilities endpoint.
Heatmaps use color coding to illustrate the intensity profile of data. The use of different colors to communicate metrics makes heatmaps easier to consume. Use of colors also helps distinguish between different states rather than raw numbers. The simple but powerfully multifaceted nature of heatmaps makes them a potent analysis tool in various situations. .
Create a Geo Heatmap
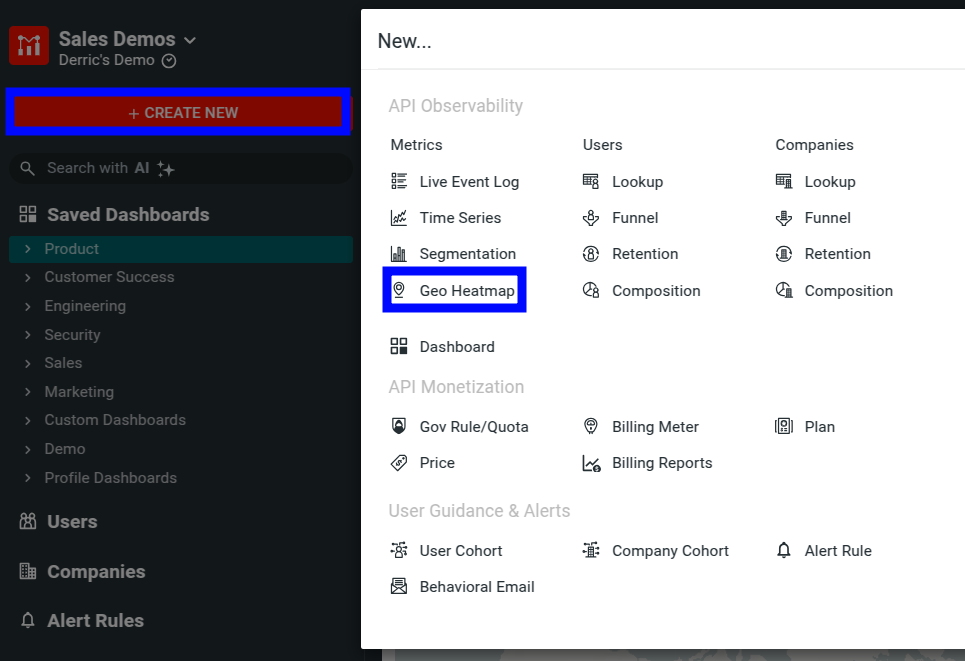
To create a geo heatmapt, select + Create New in the navigation menu and then select Geo Heatmap from the API Observability section.
Filters
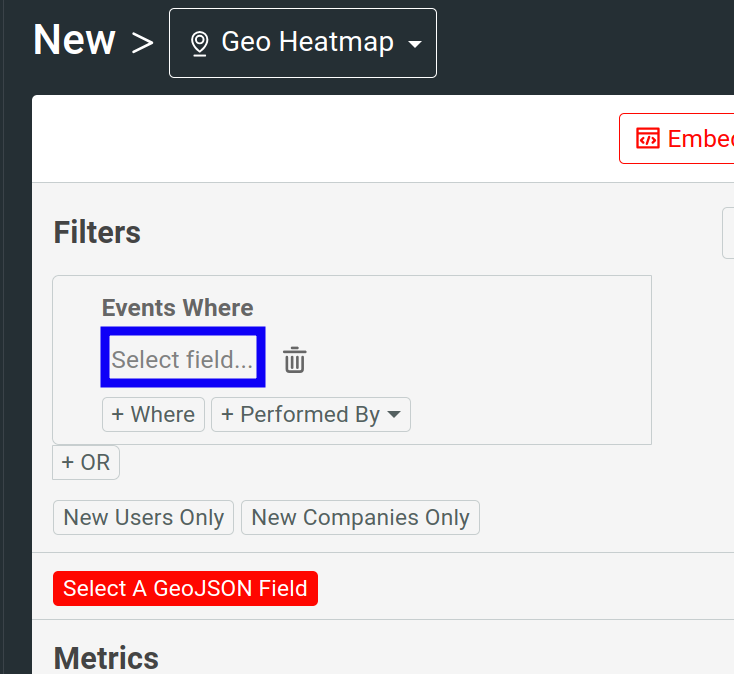
You can refine a heatmap using filters. To access the filters, select the Select field list in the Filters pane.
For more information about the available filters, see Reference: Analytics Filters.
You can chain multiple filters together by selecting Where and OR.
Filter By Cohorts
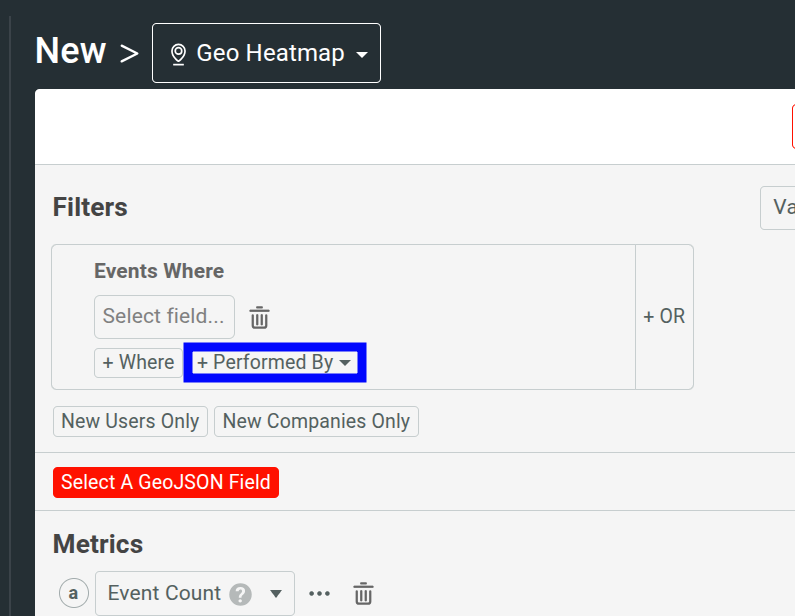
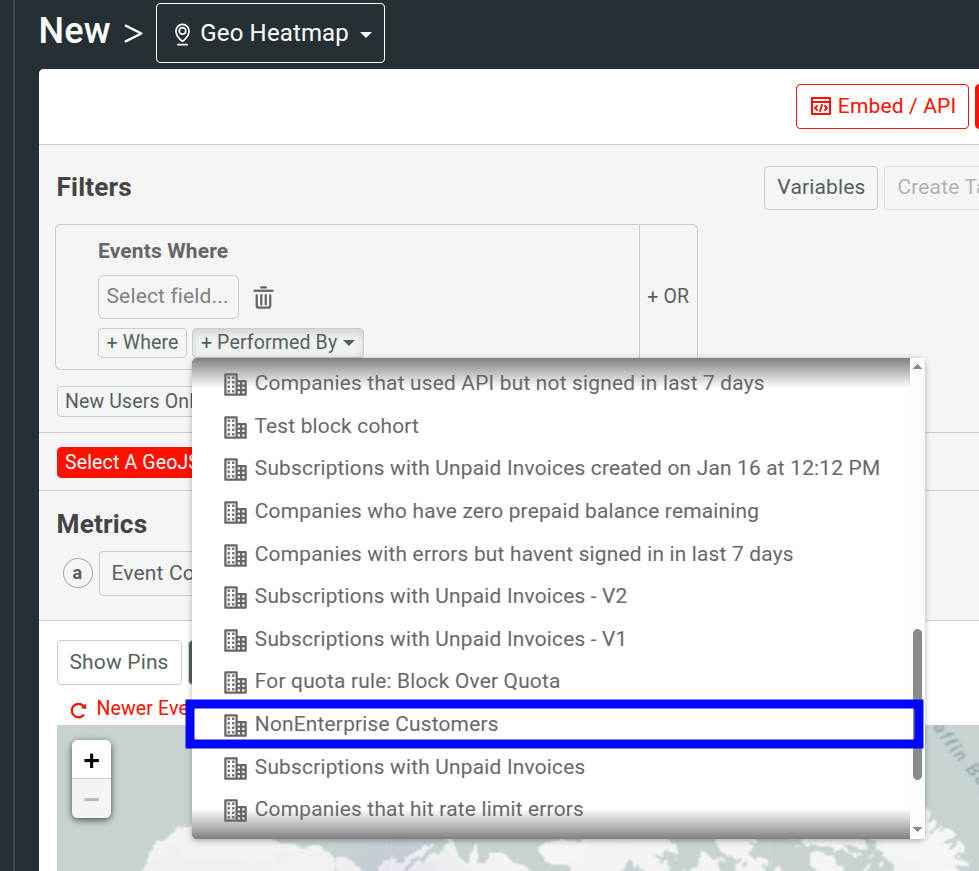
You can further refine your heatmaps by selecting a user or company cohort from the Performed By list:
This allows you to create heatmaps based on specific customer cohorts—for example, new users that have been encountering errors or events for enterprise customers. For example, the following filters out enterprise customers and displays API calls for non-enterprise customers only:
Inline Cohorts
Use inline cohorts to define a cohort criteria directly in your heatmaps. This allows you to instantly refine your analysis when you don’t already have an existing cohort to filter by.
To define an inline cohort, select Performed By and then select + Inline User Cohort or + Inline Company Cohort. It opens up a new dialog where you can define a cohort criteria using customer and event filters.
Named Variables for Filters
You can define named variables that hold filter values and then use it across filters.
To add filter variables, select Variables. Then select Add Variables to define a variable. After defining your variables, select Save.

To use a variable, enter the variable name enclosed in double curly braces in a filter value. For example:

You must manually enter the variable name this way to use it. You can quickly check defined variables by hovering over Variables—the tooltip shows the defined variables and their values.
This feature allows you to avoid manually updating filter values in complex and dynamic filtering scenarios.
Include Data of New Users and Companies Only
To take only new users and companies into consideration, enable the New Users Only and New Companies Only filters respectively. These two filters allow you to plot heatmaps only for users or companies who’ve made their first API call within the time period you specify.
Use GeoJSON
GeoJSON is available to Moesif Enterprise plan users.
Instead of using IP addresses to plot heatmaps, you can use GeoJSON-formatted shapes from API body fields or request query parameters. Select Select a GeoJSON Field to get started.
How it Works
You can include GeoJSON-formatted shapes in your request or response payloads or query parameters. Moesif automatically detects the GeoJSON data in the API traffic. Then you can specify the data field from Select Geo Field:

This example selects the Location field from the request payload’s geo_ip
field. Moesif only plots the shape defined in the Location field rather than
IP addresses in the resulting metric heatmap.
Configure Metrics and Chart
Moesif Geo Heatmap offers different ways to specify, configure, and visualize heatmaps.
Location Pins
Select Show Pins to enable inverted-drop-shaped location markers on the map. Selecting each pin allows you to see the specific metric value in that location.
Heatmap Types
Moesif supports the following heatmap types:
- Density heatmap
- Metric heatmap
Density Heatmap
Density heatmaps helps visualize geographic concentration of data points for your metric. A density heatmap creates smooth, continuous color gradients that highlight areas with a cluster of activity, also known as hotspots. Areas with intense, warmer colors, like red or orange, indicate higher concentration of data points. The color fades out smoothly in areas with fewer data points, for example blue or green.
Example Use Cases of Density Heatmaps
- Identify areas with highest concentration of API calls to evaluate API usage.
- Visualize geographic source of failed login attempts or malicious requests.
- Map out where API errors or high API latency are most frequently occurring.
- Track the geographic spread and concentration of users who are adopting a new API feature
Metric Heatmap
A metric heatmap plots each individual data point of the metric as a separate square on the map. The color of each square represents the value of a specific metric associated with that data point. Darker colors like red indicate higher values and lighter colors like blue indicate lower values. Combining with location pins, metric heatmaps allow you to visualize properties of individual events or find outliers that might get lost in an aggregated view like density heatmaps.
Example Use Cases of Metric Heatmaps
- See the latency or processing time for every single API request on a map.
- Identify specific user transactions or events with unusually high or low values.
- Observe the journey of a specific company, with a metric that computes the time the company has spent on your product’s website pages.
Select the Metrics to Plot
By default, Geo Heatmap plots only the Event Count metric. A heatmap can contain only one metric at a time.
The following predefined metrics are available:
- Event count
- Event accumulation
- Unique users
- Unique companies
- Unique sessions or API keys
- Average latency
- Maximum latency
- P90 latency
- Request body count
- Response body count
- Maximum available balance for subscriptions
- Maximum pending activity for subscriptions
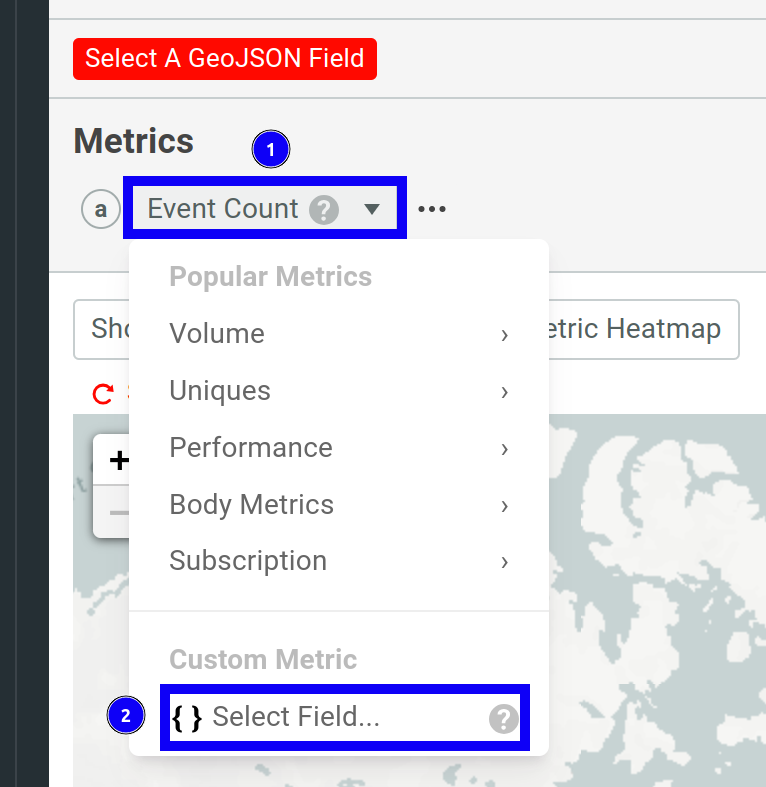
You can also add custom metrics by selecting a new event field.
Create Custom Metric
To create a custom metric for the heatmap, follow these steps:
- Select + Event Count and then select { } Select Field.
![Add custom metric by selecting a custom field in a Geo Heatmap chart]()
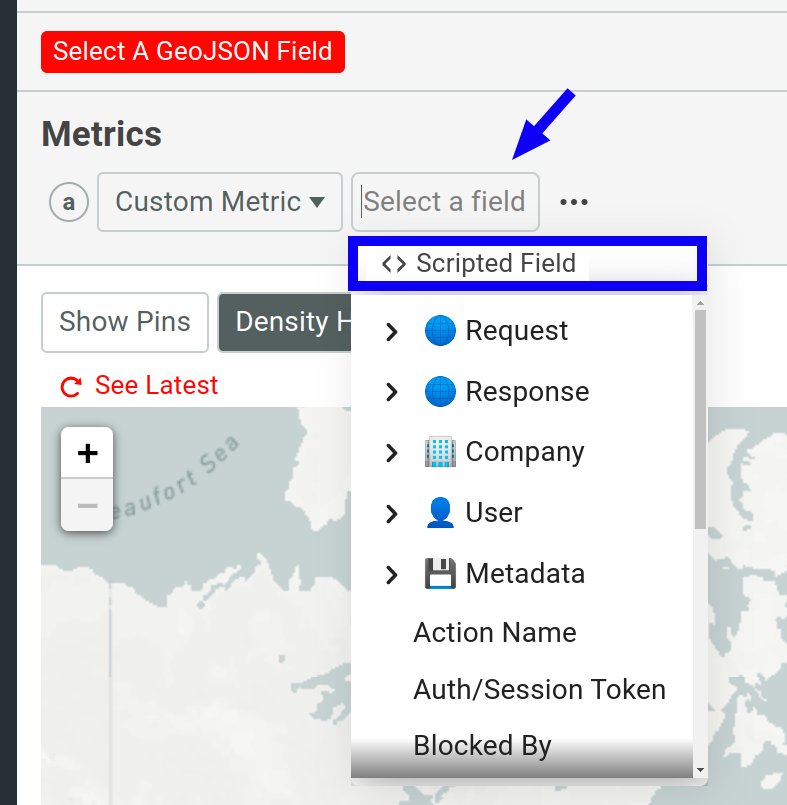
- Select an event field from the Select a field list—for example, Duration (Milliseconds). Alternatively, write a script that computes the event field.
-
Select a computation method for the values of the event field. For example, if you’ve selected Duration (Milliseconds), you can select
avgto display the average elapsed duration of API requests over time.The computation methods available depend on the data type of the event field. For example, numeric types have the following computation methods available:
sumavgminmaxaccumulatepercentiledistinct
Add a Scripted Field
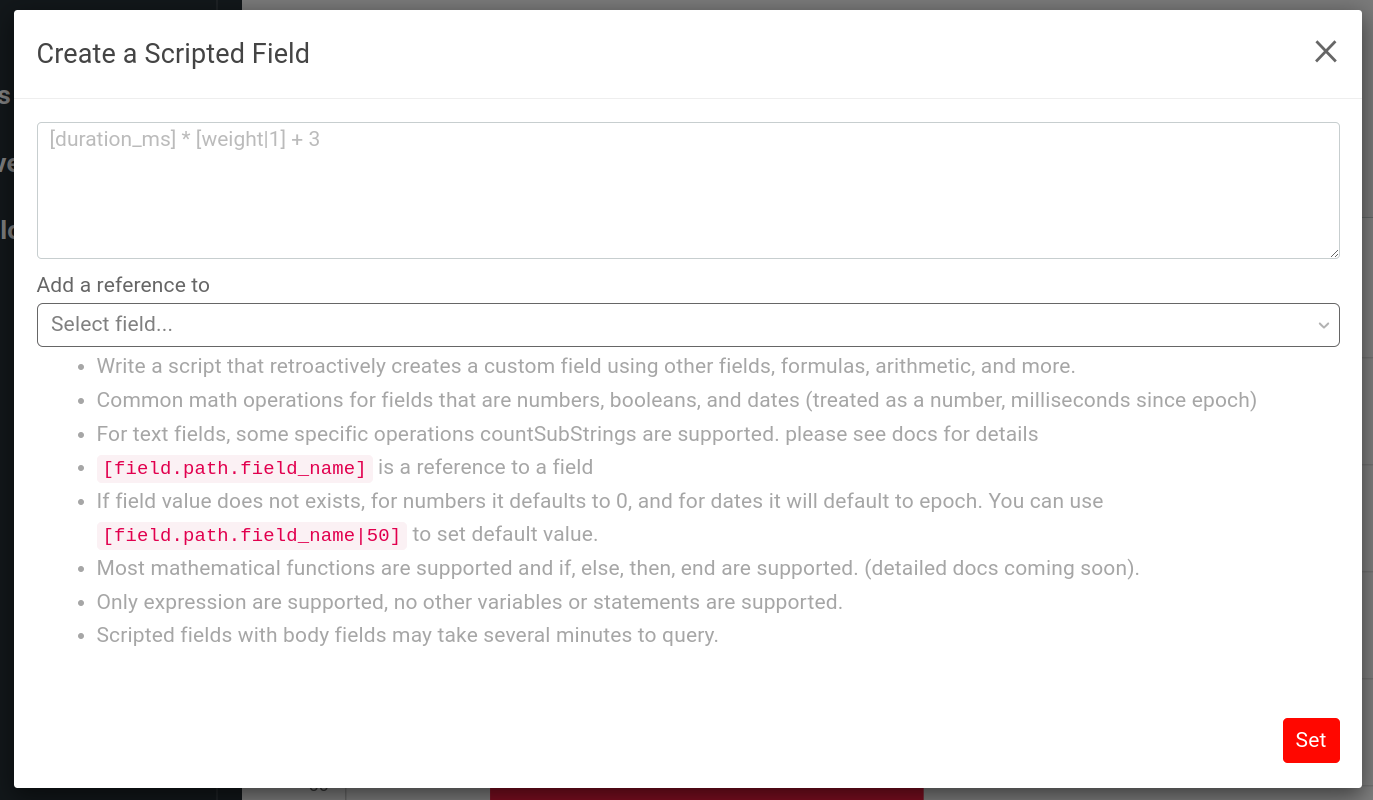
If a field does not exist in your request or response, you can compute the field using a script. The script retroactively creates a custom field from other fields, using formulas, arithmetic, and conditional expressions. A scripted field has the following capabilities and limitations:
- Only numbers, booleans, and datetime data types (treated as a number, milliseconds since epoch) are supported.
[field.path.field_name]references a field.- If field value does not exist, for numbers it defaults to 0, and for dates it defaults to the epoch. You can use
[field.path.field_name|50]to set the default value. - Most mathematical functions are supported. Conditional expressions using
if,else,then, andendoperators are supported. - Only expressions are supported. No other variables or statements are supported. Scripted fields with body fields may take several minutes to query.
To add a scripted field, follow these steps:
- Select + Event Count and then select { } Select Field.
![Add custom metric by selecting a custom field in a Geo Heatmap chart]()
- Select <> Scripted Field.
![Add a scripted field in a Geo Heatmap chart]()
- Write the script and then select Set. The field list following the script text box contains all the existing fields so that you can easily reference them in your script.
![Scripted field dialog]()
Metric Configuration and Shortcuts Menu
For each metric in the Metrics pane, select … Configuration and Shortcuts to further customize your chart.
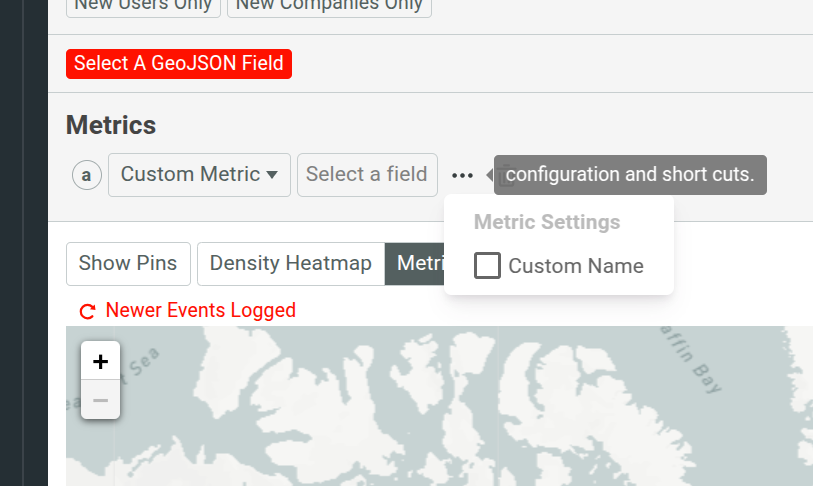
Custom Name
Select the Custom Name checkbox to set a custom name for the metric.
Save and Share
Moesif gives you several options to share a Geo Heatmaps workspace. Before you can share, you must first save the workspace to a dashboard.
After saving, follow the instructions in Sharing Workspaces to share your workspace.