Moesif Ballerina Integration
This document describes how to set up, configure, and use the Moesif observability extension of the Ballerina programming language. The extension provides an implementation for publishing traces, metrics, and logs to a Moesif application.
Moesif currently supports OpenTelemetry logs and traces. Metrics are not supported.
Get Your Moesif Application ID
- Log into Moesif Portal.
- Select the account icon to bring up the settings menu.
- Select Installation or API Keys.
- Copy your Moesif Application ID from the Collector Application ID field.
Enable Moesif Extension to Publish Traces
To package the Moesif extension into the JAR file, follow these steps.
- Import the package in your program:
import ballerinax/moesif as _; -
Add the following configurations in
Ballerina.tomlwhen building your program:[package] org = "my_org" name = "my_package" version = "1.0.0" [build-options] observabilityIncluded=true -
To enable the extension and publish traces to Moesif, add the following configurations in
Config.tomlwhen running your program, replacing<moesif-application-id>with your Moesif Application ID:[ballerina.observe] tracingEnabled=true tracingProvider="moesif" [ballerinax.moesif] applicationId = "<moesif-application-id>" # Mandatory configuration. reporterBaseUrl = "xxxxx" # Optional Configuration. Default value is https://api.moesif.net tracingReporterFlushInterval = xxx; # Optional Configuration. Default value is 1000 tracingReporterBufferSize = xxx; # Optional Configuration. Default value is 10000 isTraceLoggingEnabled = xxx; # Optional Configuration. Default value is false isPayloadLoggingEnabled = xxx; # Optional Configuration. Default value is false
Publish Logs to Moesif
To publish logs, the extension leverages Fluent Bit to forward logs to an OTEL Collector, which then sends the logs to Moesif’s OpenTelemetry logs receiver endpoint:
Ballerina → Fluent Bit → OTEL Collector → Moesif
Components
docker-compose.yml- Defines the containerized setup for Fluent Bit and OTEL Collector.
fluent-bit.conf- Configures Fluent Bit to read logs from the Ballerina log file and forward them.
otelcol.yaml- Configures the OTEL Collector to process and send logs to Moesif’s logs receiver endpoint.
In the following configurations for these components, replace <moesif-application-id>
with your Moesif Application ID.
docker-compose.yml
services:
  otelcol:
    image: otel/opentelemetry-collector-contrib:0.132.0
    container_name: otelcol
    command: ["--config", "/etc/otelcol.yaml"]
    environment:
      MOESIF_APP_ID: "<moesif-application-id>"
    ports:
      - "4317:4317"
      - "4318:4318"
    volumes:
      - ./otelcol.yaml:/etc/otelcol.yaml:ro
    networks:
      - otelnet

  fluent-bit:
    image: fluent/fluent-bit:3.0
    container_name: fluent-bit
    depends_on:
      - otelcol
    ports:
      - "2020:2020"
    volumes:
      - ./fluent-bit.conf:/fluent-bit/etc/fluent-bit.conf:ro
      # Mount the local log directory into the container
      - <ballerina-log-path>:/app/logs:ro
    networks:
      - otelnet

networks:
  otelnet:
    driver: bridge
fluent-bit.conf
[SERVICE]
    Flush         1
    Log_Level     debug
    Daemon        off
    HTTP_Server   On
    HTTP_Listen   0.0.0.0
    HTTP_Port     2020

# Read logs from local Ballerina app
[INPUT]
    Name              tail
    Path              /app/logs/app.log
    Tag               ballerina.*
    Read_from_Head    true
    Skip_Long_Lines   On
    Skip_Empty_Lines  On
    Refresh_Interval  1

# Add metadata
[FILTER]
    Name         modify
    Match        ballerina.*
    Add          service.name ballerina-service
    Add          deployment.environment prod

# Convert to OTEL format and send to collector
[OUTPUT]
    Name          opentelemetry
    Match         ballerina.*
    Host          otelcol
    Port          4318
    Logs_uri      /v1/logs
    Log_response_payload True
    Tls           Off
    Tls.verify    Off

# Debug output to see what's being processed
[OUTPUT]
    Name          stdout
    Match         ballerina.*
    Format        json_lines
otelcol.yml
receivers:
  otlp:
    protocols:
      grpc:
        endpoint: "0.0.0.0:4317"
      http:
        endpoint: "0.0.0.0:4318"

processors:
  resource:
    attributes:
      - key: service.name
        value: ballerina-service
        action: upsert
      - key: deployment.environment
        value: prod
        action: upsert

  transform/severity_from_message:
    log_statements:
      - context: log
        statements:
          # Set default severity to INFO for all logs first
          - set(severity_number, 9) where body != nil
          - set(severity_text, "INFO") where body != nil

          # Try to parse JSON body, but handle parsing errors gracefully
          - set(cache["is_json"], false)
          - set(cache["is_json"], true) where body != nil and IsMatch(body, "^\\s*\\{")

          # For JSON logs, parse and extract level
          - set(cache["parsed_body"], ParseJSON(body)) where cache["is_json"] == true

          # Override with specific levels based on JSON level field
          - set(severity_number, 1) where cache["is_json"] == true and cache["parsed_body"]["level"] == "TRACE"
          - set(severity_text, "TRACE") where cache["is_json"] == true and cache["parsed_body"]["level"] == "TRACE"

          - set(severity_number, 5) where cache["is_json"] == true and cache["parsed_body"]["level"] == "DEBUG"
          - set(severity_text, "DEBUG") where cache["is_json"] == true and cache["parsed_body"]["level"] == "DEBUG"

          - set(severity_number, 9) where cache["is_json"] == true and cache["parsed_body"]["level"] == "INFO"
          - set(severity_text, "INFO") where cache["is_json"] == true and cache["parsed_body"]["level"] == "INFO"

          - set(severity_number, 13) where cache["is_json"] == true and cache["parsed_body"]["level"] == "WARN"
          - set(severity_text, "WARN") where cache["is_json"] == true and cache["parsed_body"]["level"] == "WARN"

          - set(severity_number, 17) where cache["is_json"] == true and cache["parsed_body"]["level"] == "ERROR"
          - set(severity_text, "ERROR") where cache["is_json"] == true and cache["parsed_body"]["level"] == "ERROR"

          - set(severity_number, 21) where cache["is_json"] == true and cache["parsed_body"]["level"] == "FATAL"
          - set(severity_text, "FATAL") where cache["is_json"] == true and cache["parsed_body"]["level"] == "FATAL"

  batch: {}

exporters:
  # OTLP over HTTP to Moesif
  otlphttp:
    endpoint: "https://api.moesif.net"
    logs_endpoint: "https://api.moesif.net/v1/logs"
    headers:
      X-Moesif-Application-Id: "<moesif-application-id>"
    compression: none
    timeout: 10s
    sending_queue:
      enabled: true
      num_consumers: 2
      queue_size: 512
    retry_on_failure:
      enabled: true
      initial_interval: 1s
      max_interval: 10s
      max_elapsed_time: 0s

service:
  telemetry:
    logs:
      level: debug
  pipelines:
    logs:
      receivers:  [otlp]
      processors: [resource, transform/severity_from_message, batch]
      exporters:  [otlphttp]
Setup and Execution
-
Publish the logs from your Ballerina application to a file in the specified log path:.
bal run 2> <ballerina-log-path>/app.log - Copy the component configurations from the previous section to a directory in your local file system.
. ├── docker-compose.yml ├── fluent-bit.conf └── otelcol.yaml -
Run the stack using the following command.
docker compose up
This setup establishes a clear pipeline for the logs:
- The Ballerina application writes logs to a specified file
- Fluent Bit continuously monitors this file and forwards the logs to the OTEL Collector.
- The OTEL Collector processes the logs and dispatches them to Moesif.
Visualize Observability Data
Traces and logs are published to Moesif as events. You can observe them in real time in the Live Event Log.
For example, here we observe trace and span IDs for an API event:
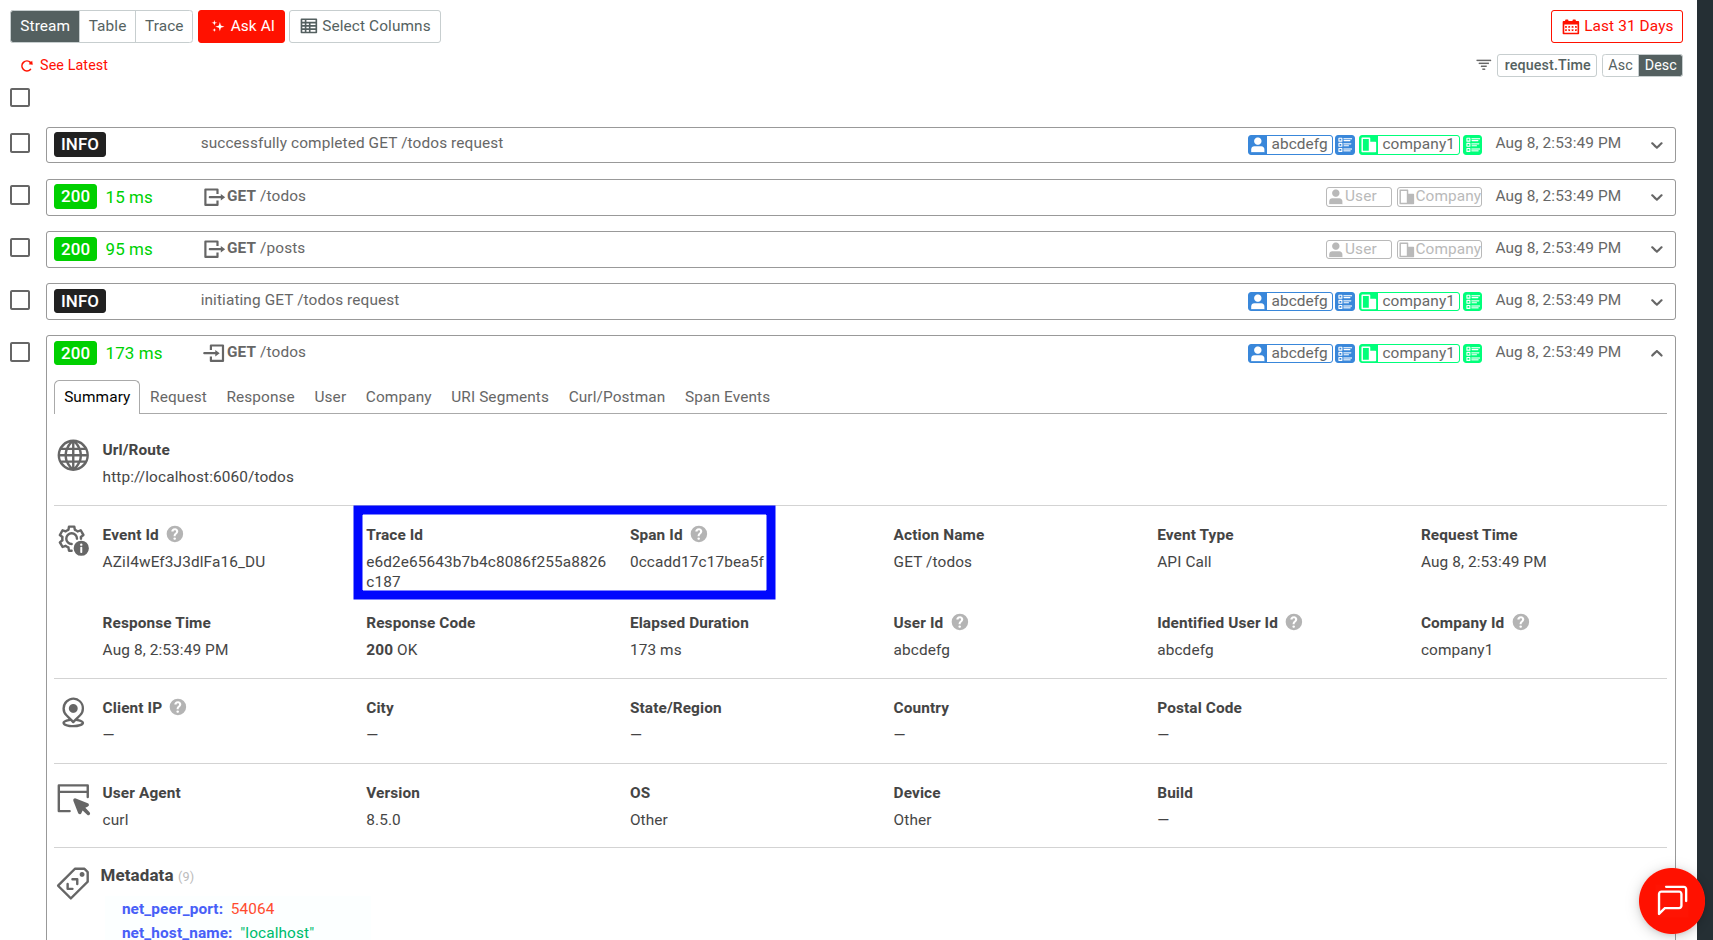
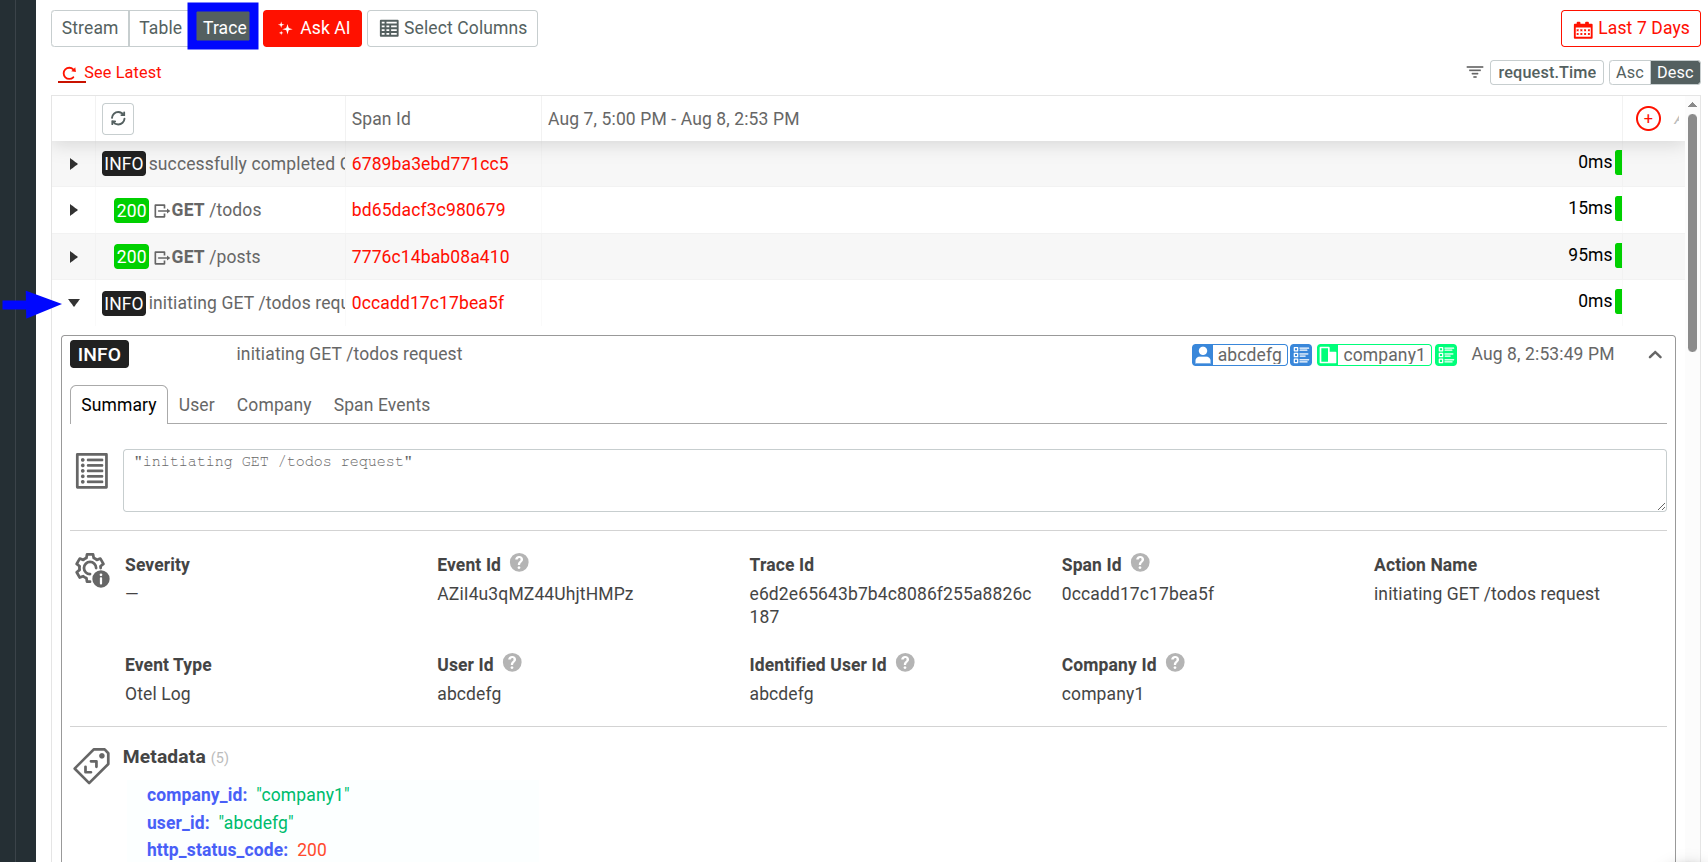
Trace and log data is also available in a separate Trace view for Live Event Log workspaces.
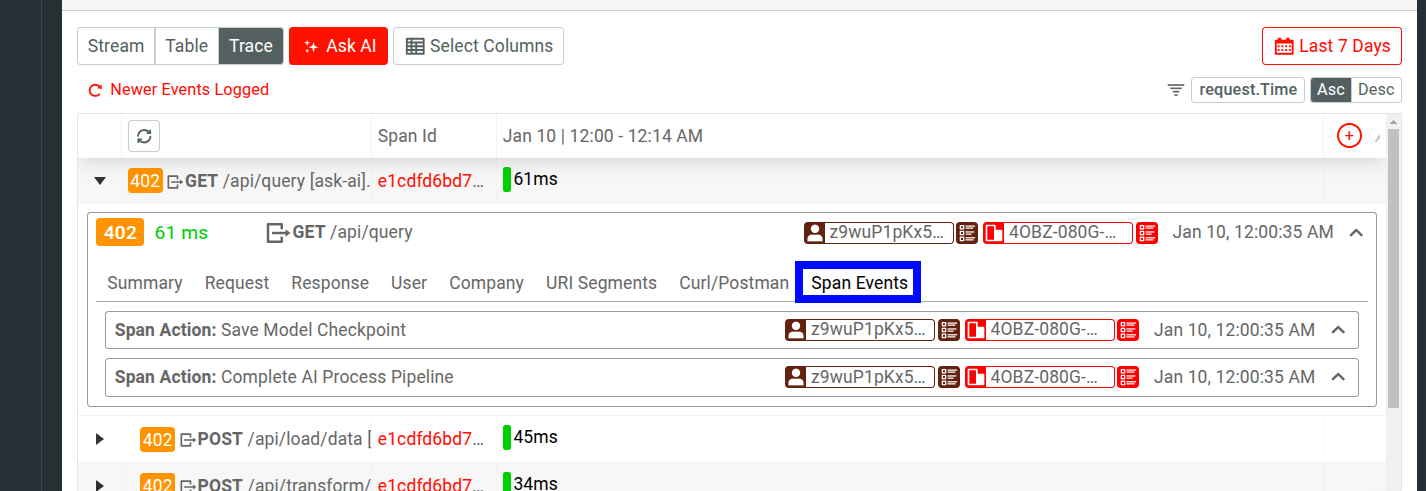
In the expanded menu for an event, you can go to Span Events to view Span Event data for the span.
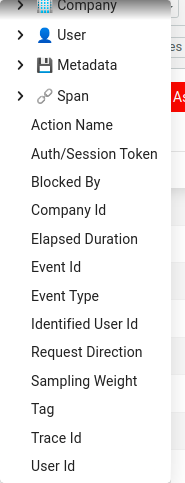
You can also use different OpenTelemetry data elements as filters like trace ID and spans.
Configuration Options
moesif:reporterBaseUrl
| Type | Default |
|---|---|
| String |
"https://api.moesif.net"
|
moesif:applicationId (Required)
| Type | Default |
|---|---|
| String | None |
moesif:samplerType
| Type | Default |
|---|---|
| String |
"const"
|
moesif:samplerParam
| Type | Default |
|---|---|
| Decimal |
1
|
moesif:tracingReporterFlushInterval
| Type | Default |
|---|---|
| Integer |
1000
|
moesif:tracingReporterBufferSize
| Type | Default |
|---|---|
| Integer |
10000
|
moesif:metricsReporterFlushInterval
| Type | Default |
|---|---|
| Integer |
15000
|
moesif:metricsReporterClientTimeout
| Type | Default |
|---|---|
| Integer |
10000
|
moesif:additionalAttributes
| Type | Default |
|---|---|
map<string>
|
{}
|
moesif:isTraceLoggingEnabled
| Type | Default |
|---|---|
| Boolean |
false
|
moesif:isPayloadLoggingEnabled
| Type | Default |
|---|---|
| Boolean |
false
|