Conversion Funnel Analysis
This document explains how to use Funnel analysis in the Moesif’s User and Company Analytics suite.
Moesif supports Funnel analysis for both Users and Companies. Unless this document states explicitly, it uses the term user to represent both Users and Companies for simplicity.
Overview
Funnel analysis allows you to understand where customers drop off as customers use your APIs and products. Funnels use a combination of steps that can include specific API calls, but also custom actions a customer performs in your UI such as signing in. This enables tracking metrics like Time to First Hello World (TTFHW) and Time to First Working App (TTFWA).
If you’re not familiar with funnel analysis, see the second chapter of API Analytics: The Ultimate Guide to Grow Your Platform Business eBook
Before You Start
Events may take up to 20 minutes to show up in the user analytics screens. If your data has not appeared, make sure you wait until Moesif has completed the instrumentation process and loaded the data.
Create a New Funnel Analysis
You can create a new Funnel analysis in two ways:
From the Create New Dialog
- Log into Moesif Portal.
- Select + Create New in the navigation menu.
- Select Funnel for Users or Companies.
From Users or Companies Screen
- Log into Moesif Portal.
- Select Users or Companies in the navigation menu.
- Select Retention from the dropdown menu.
Example Funnel
Funnels compose a series of actions that a single user or company performs. These actions can either come from the API or originate within your UI through custom actions.
For example, the following funnel has two steps:
- Users who performed a
Signed-Inaction - Users who also made at least a single API call to the
/esignature/documentsAPI endpoint.
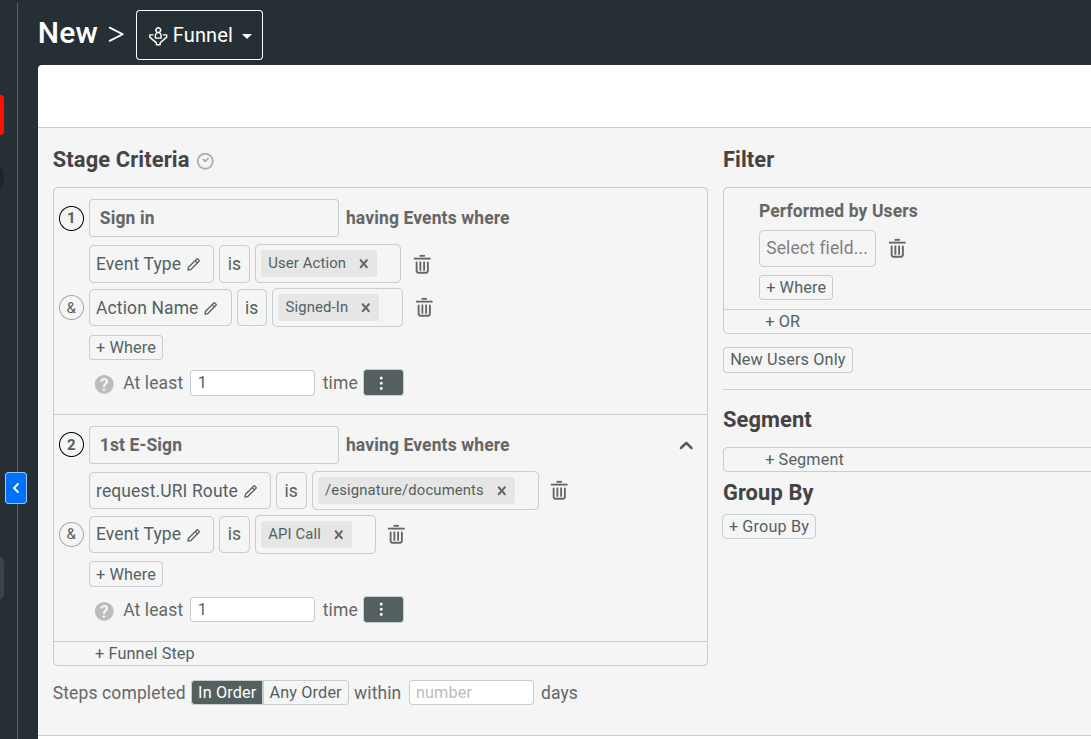
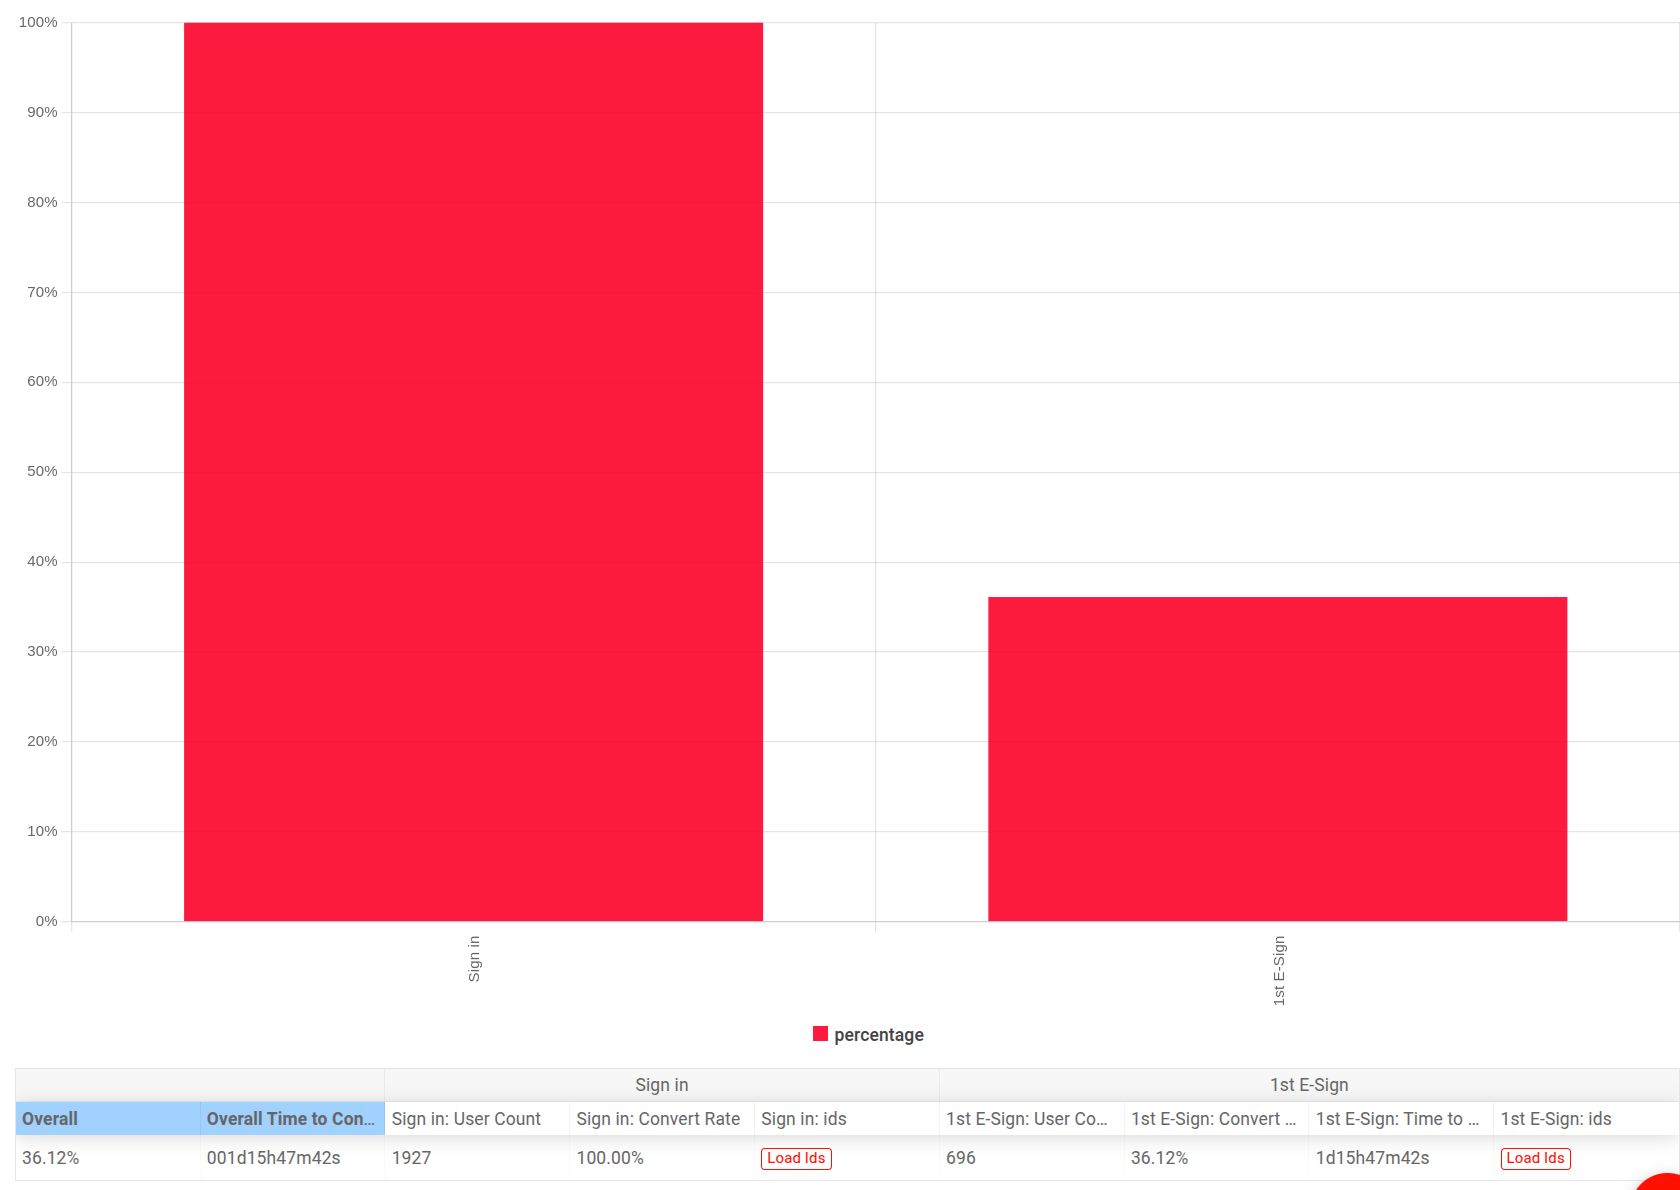
We can see that only 36.12% of users who signed in also made an API call to /esignature/documents. It took a day on average to reach the second step.
Filters
In a Funnel analysis, you must specify the step requirements to define a conversion funnel. And defining a conversion funnel requires you to use event filters. You can further refine the Funnel analysis by filtering on customer data.
The next sections discuss how to define the conversion funnel and make use of the powerful filters available to you.
For more information about the available filters in Funnel analysis, see Reference: Analytics Filters.
Step Criteria
You can build funnels with a number of steps that represent milestones a customer reaches with your API. For example, the beginning of your funnel may start on your website as a visitor signs up to use your API. However, once they created an API key, much of the magic happens on the API side rather than the web side. This means you want to track the customer journey as they make their first API call, then they make enough API calls that they receive value from your product.
Step Ordering
You can compute the conversion steps in two orders. Select the order you prefer in Steps completed.
- In Order
- The first step must occur before the second step for Moesif to consider the user as converted. Other events are allowed between the first and second step, as long as the first step occurs before the second one.
- Any Order
- Moesif doesn’t take into account the order the steps occur in. This means Moesif considers users as converted as long as they perform the steps, regardless of the order they perform them in.
Step Completion Period
You can also specify a conversion window that specifies within what time period all the steps must complete. By default, the time period remains null and Moesif doesn’t take into account how long it takes for customers to convert.You can override this such as to only show customers who covert within a window like seven days.
Event filters
Event filters enable you to filter based on the events a customer has performed. A single user or company may have performed multiple events.
You can filter by any custom actions you are tracking within your UI like users signing up, purchasing a plan, and so on. You can also formulate steps based on API call properties such as API route, request HTTP headers, or other criteria to narrow down your conversion steps.
Events can fall into one of two types:
- API Calls
- The requests hitting your servers at various API endpoints such as
GETrequests to the/itemsendpoint. - Actions
- Custom actions triggered by users within your application or UI—for example, a user signing up.
You can filter by these event types by selecting the Event Type filter.
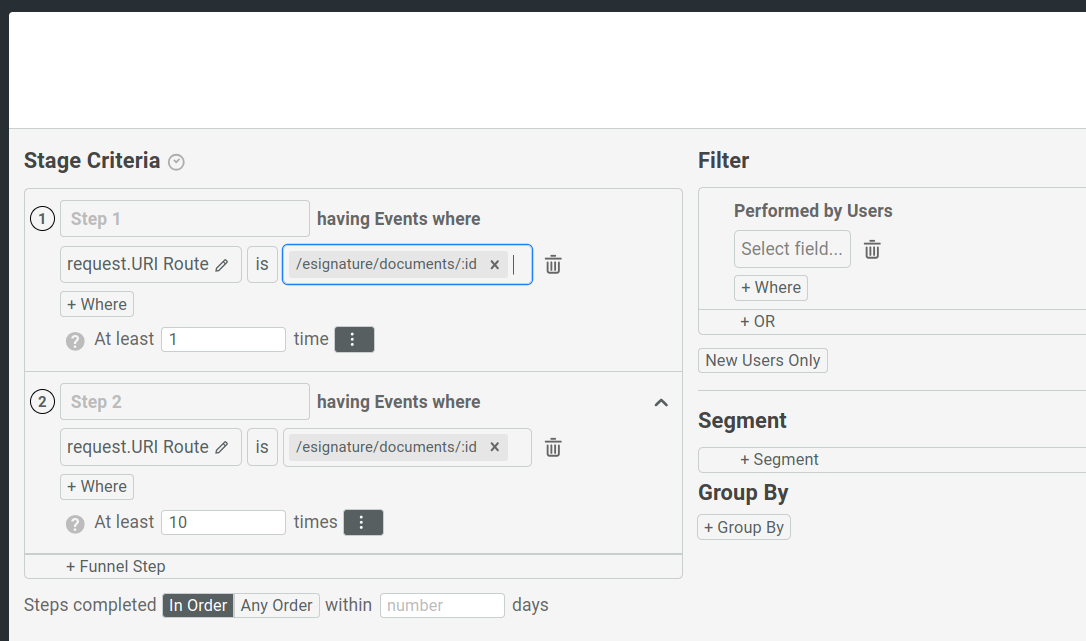
Step Frequency
You can also specify how many times a user must perform a step before you consider that user as converted. For example, you may want to understand users who made over a 100 API calls which is your cutoff to consider receiving value from the API.
This can become useful if you want to see the drop off between users who made their first API call and users who made a minimum number of API calls, implying a more complete integration.
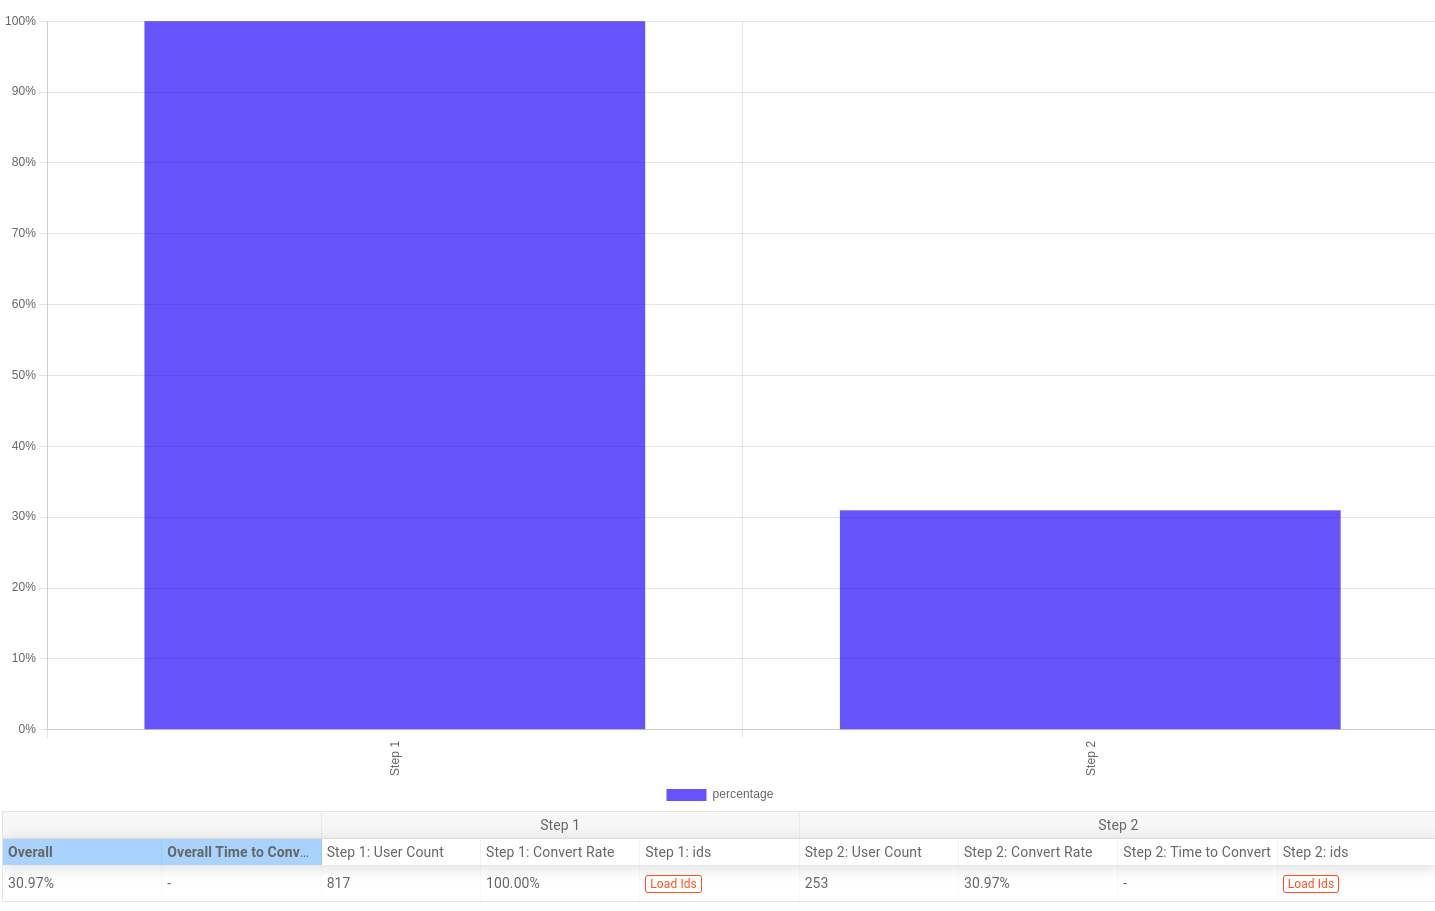
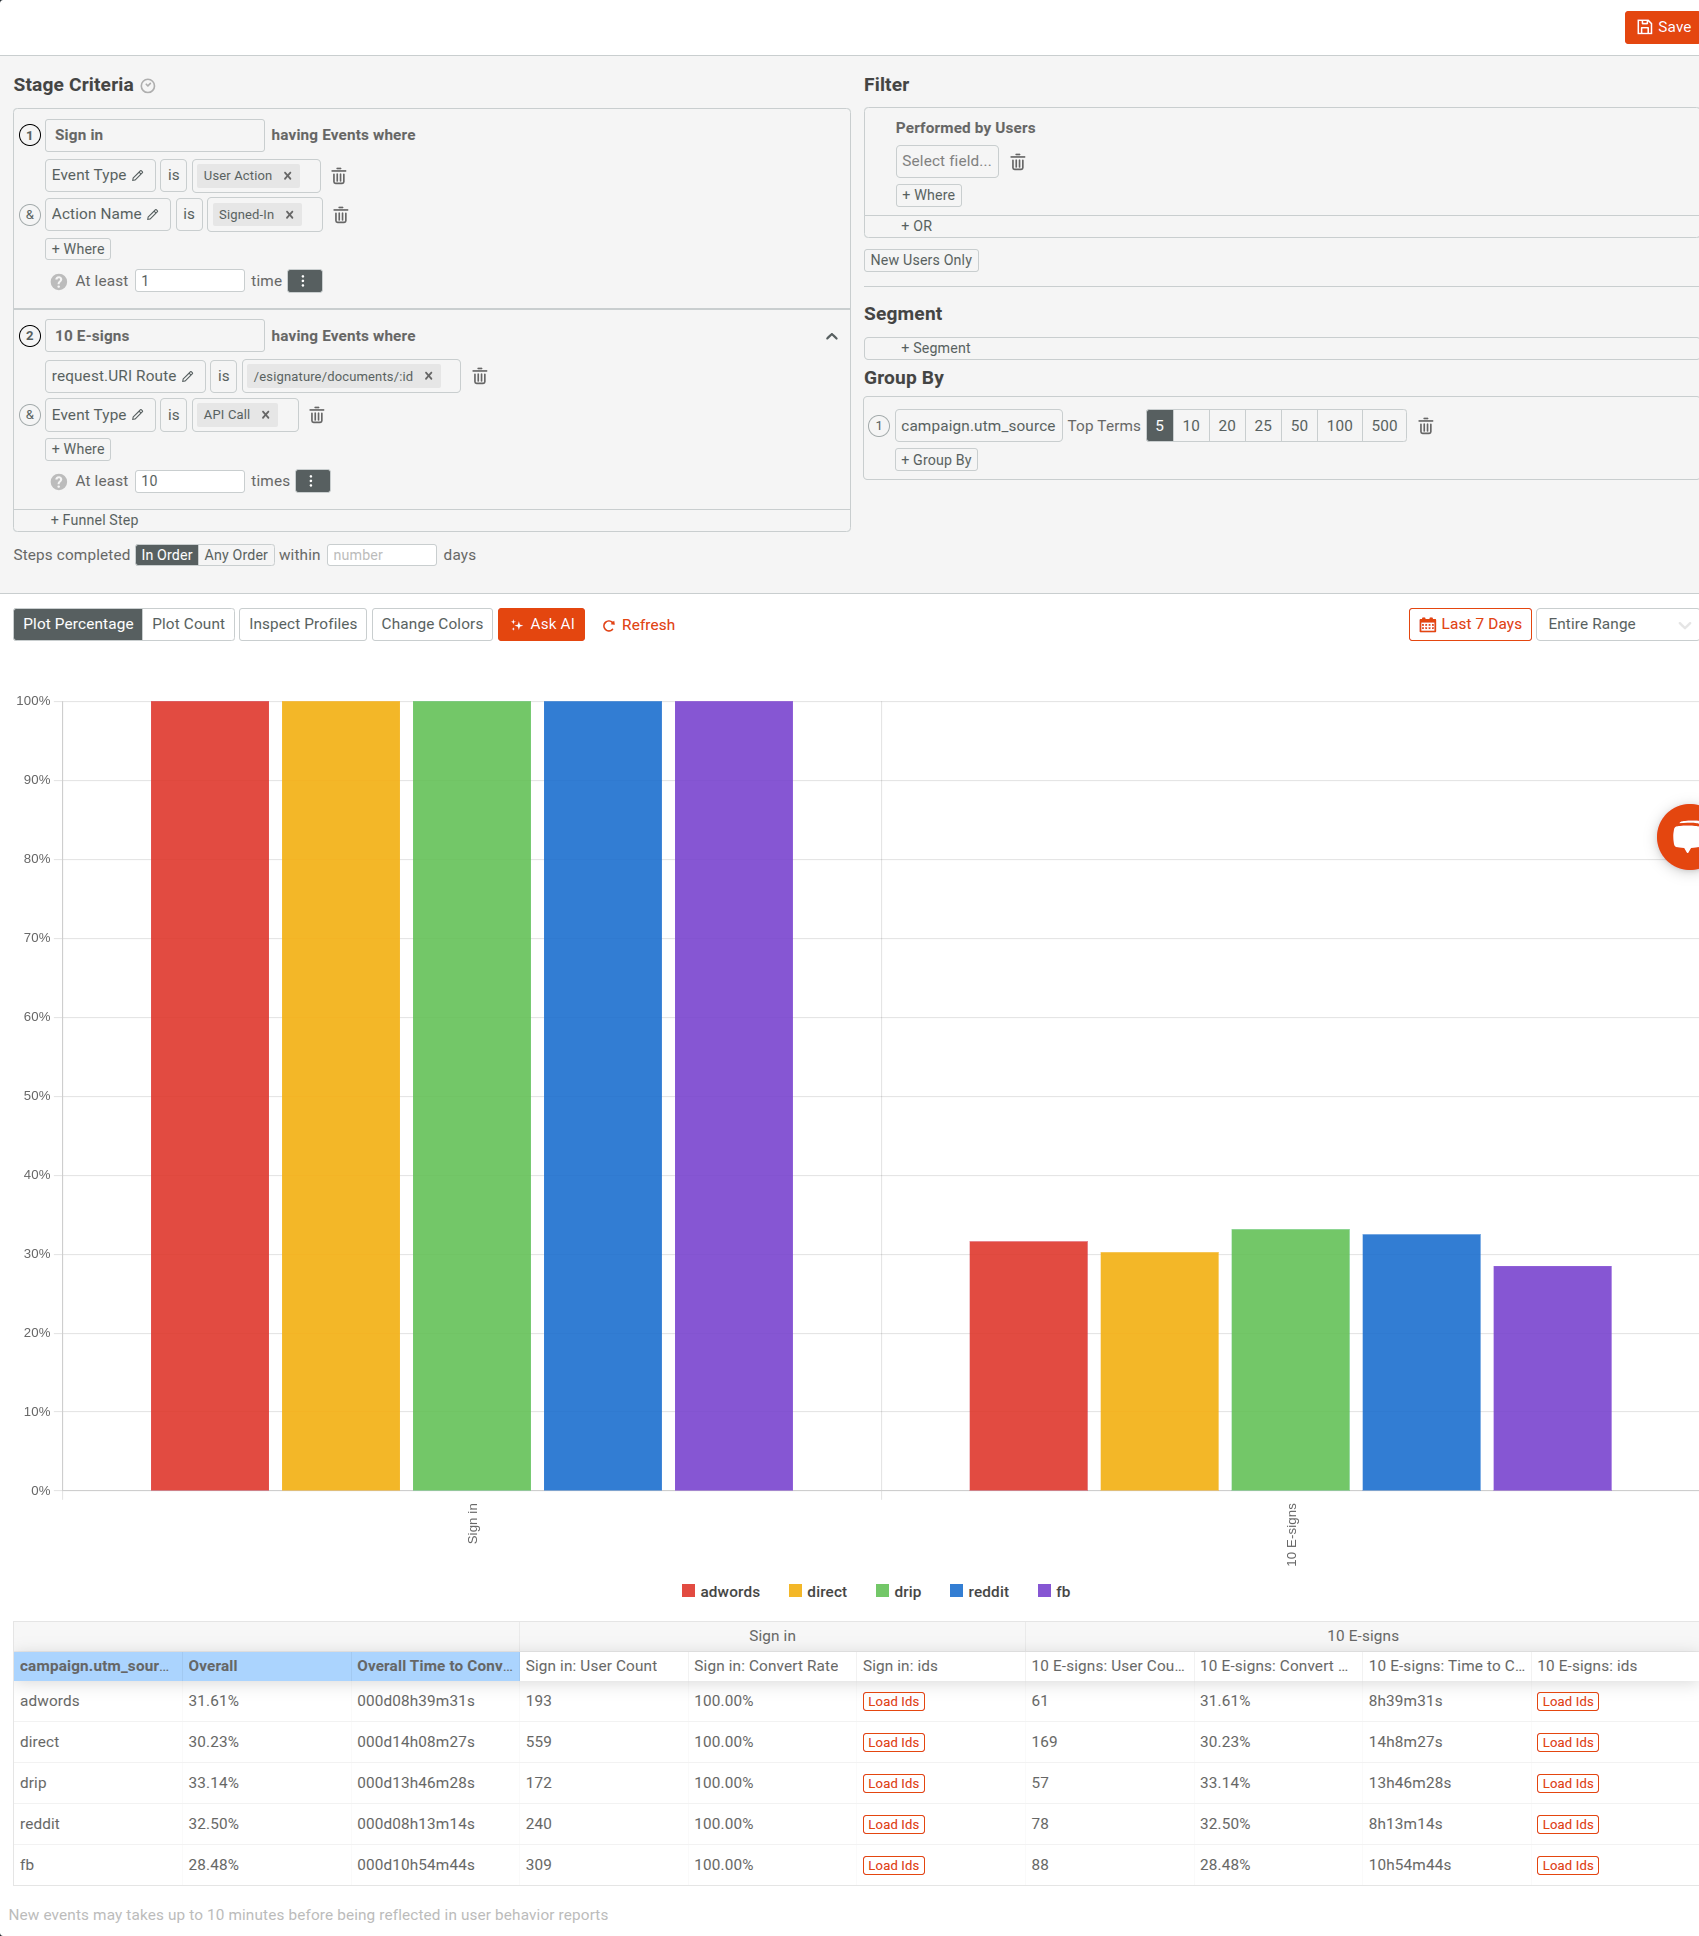
In the following chart, we see that only 30.97% of users who made at least a single call to the /esignature/documents/:id endpoint has also made more than 10 calls to that endpoint.
User criteria
You can also narrow your funnel to specific segments of users or compare across customer segments.
Group Data
You can break down funnels by user or company fields such as acquisition channels or industry to understand what converts the best.
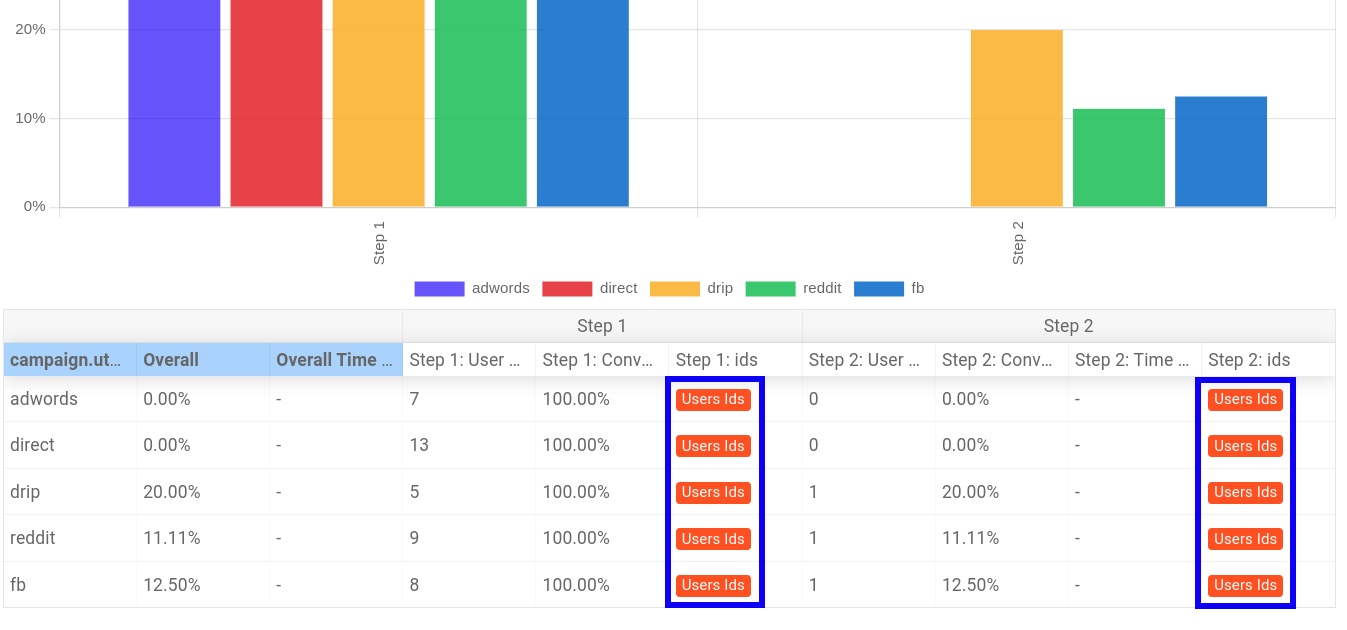
In the following example, we are grouping by UTM source. Moesif automatically tracks this property by moesif-browser-js to understand which
paid marketing channels drive the most integrated users.
Filters
If you want to narrow down your funnel analysis to a specific segment of users, you can do so with the user filters in the Filter pane.
For example, to include only new users created within the last four weeks till now who also live in the United States, define the filters this way:
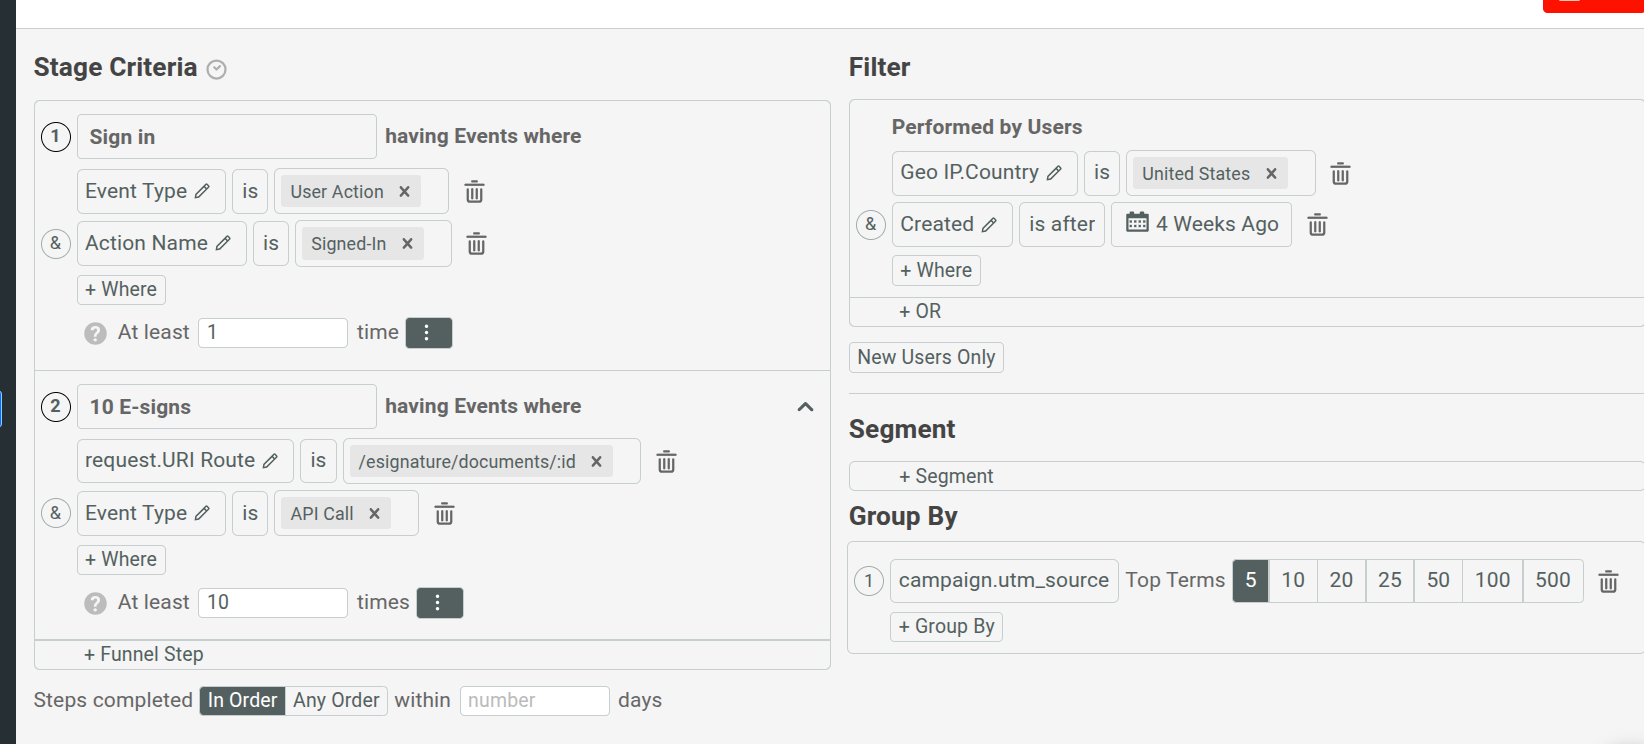
Moesif doesn’t consider users who don’t match your criteria entering the funnel.
Any fields that you save as part of user profiles remain available in funnel analysis.
Conversion Over Time
Conversion over time shows conversion rates for users who enters the funnel on a specific date. Therefore, if a user enters the funnel on November 30th, but completed the second step on December 3, that user will be counted for the day November 30.
Moesif aligns all dates to top of the calendar date. So daily means midnight to midnight, whereas monthly indicates start of the month to the end of the month.
The following graph shows the conversion rate broken down for each day for the last seven days.
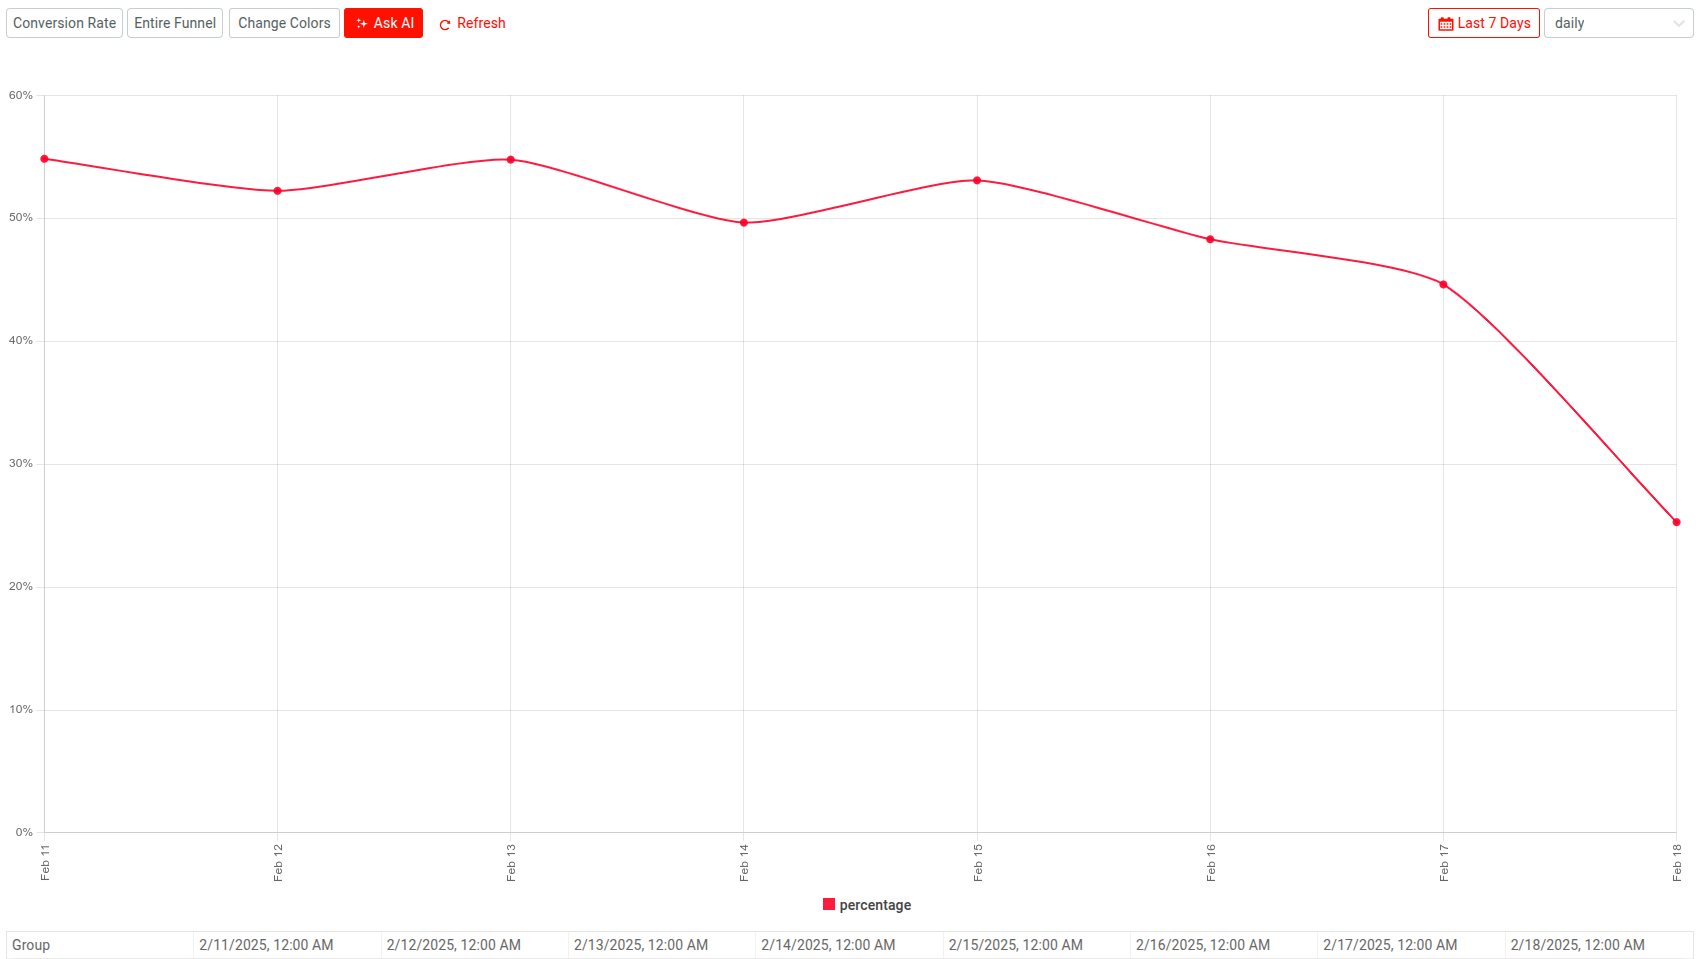
Chart Options
You have several chart options that allow you to customize how Moesif plots funnel analysis and what information appears to you.
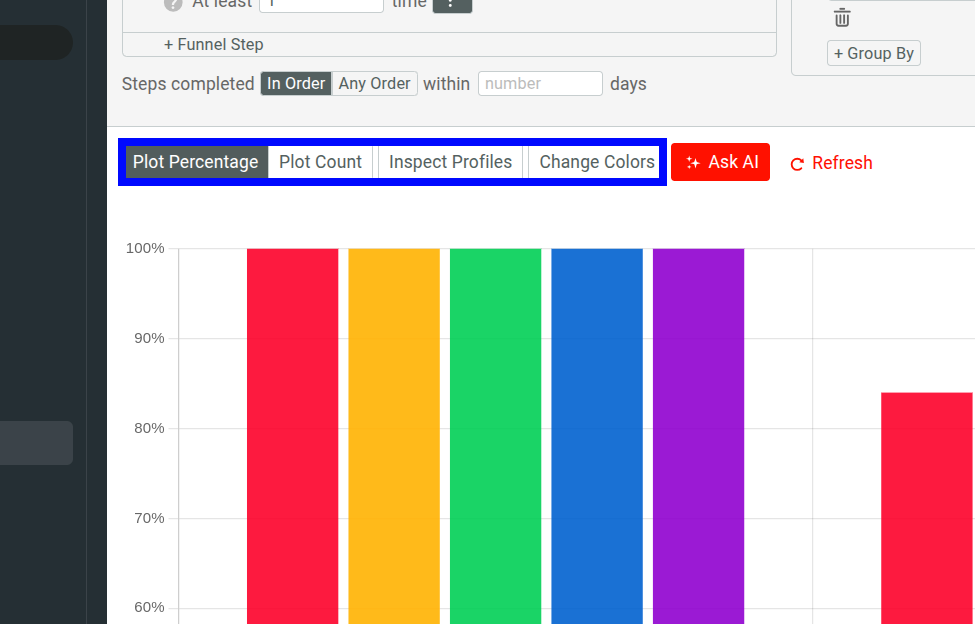
Plotting in Percentages
Select Plot Percentage to plot funnel metrics as percentages. Moesif uses this option by default when using the default entire range plot interval.
Plotting Counts
Select Plot Count to plot metric values instead of percentages when using the default entire range plot interval.
Profile Inspection
Select Inspect Profiles to include user or company IDs for each funnel step in the funnel table when using the default entire range plot interval.
Funnel Analysis Time Span
Select the time span dropdown menu to specify the period of time you want to perform funnel analysis for. You can select from one of the builtin time spans, for example, Last 7 days or Last week. If you want more precise control, use the relative date range or absolute date range options.
Funnel Analysis Time Interval
To specify the time interval for the funnel analysis plot, select an interval from the interval dropdown.
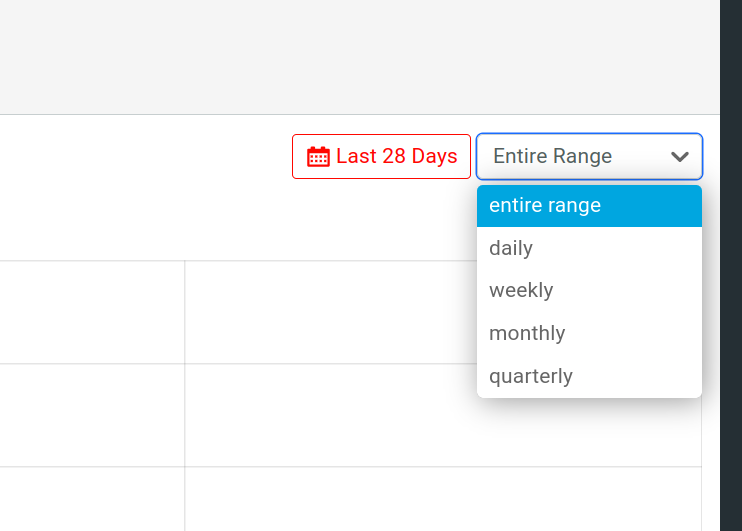
By default, Moesif plots the funnel for the entire range of the period of time you specify. If you want to break down the chart for definite time intervals and understand how conversion looks within those intervals, you have the following options:
dailyweeklymonthlyquarterly
When you specify one of these intervals, you have the following two chart options available to you:
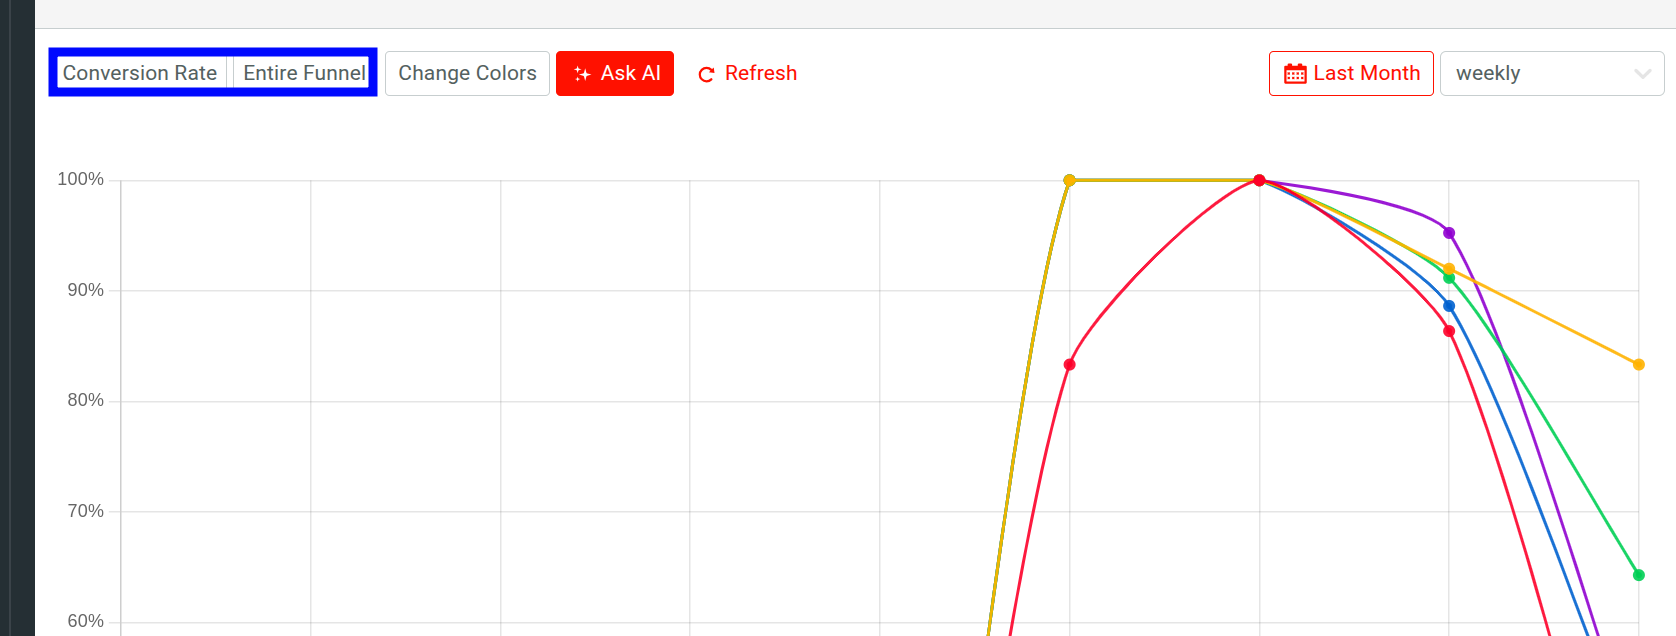
- Vertical axis data
- You can select what metric data Moesif plots on the vertical axis:
- Select Conversion Rate to plot conversions as percentages.
- Select Entity Count to plot number of unique users that convert.
- Select Time to Convert to plot the time it takes for users to convert.
- Select Percent Change of Conversion Rate to plot conversion rate changes for each time interval in percentages.
- Select Percent Change of Entity Count to plot entity count changes for each time interval in percentages
- Funnel steps
- You can choose to plot for the entire funnel, or just one of the individual steps.
AI Explain : Use AI to Get Insights About Funnel Analytics
AI Explain gives you an AI-powered conversational interface where you can ask questions and gain insights about funnel analytics data.
In a Funnel workspace, select Ask AI to open up the interface. To get started, you can choose from the sample prompts. Otherwise, type in your query and press Enter.
Save and Share
Moesif gives you several options to share a Funnel analysis workspace. Before you can share, you must first save the workspace to a dashboard.
After saving, follow the instructions in Sharing Workspaces to share your workspace.