How to Leverage Moesif Effectively for API Observability

You can make your API observability posture more powerful and beneficial by treating Moesif as an engineering implement. The platform automatically captures API traffic out-of-the-box and provides actionable analytics and visualizations. However, the degrees to which they precisely and empirically illustrate the data, depend on where and how you’ve integrated Moesif.
This article discusses the deliberate setups and best practices that we suggest you pay attention to as you integrate and utilize Moesif.

Choose Where to Integrate Moesif
Do not install Moesif too early or too late in the request lifecycle; the integration point determines what data becomes available to Moesif. Ideally, you want to capture traffic after authentication resolves but before business logic executes. As a result, Moesif can tie each event to a valid user session while still recording every error or payload mismatch that occurs in downstream logic.
For example, here’s a minimal configuration that integrates Moesif in an Express-based system:
var express = require('express');
var app = express();
var moesif = require('moesif-nodejs');

/* snip */

const moesifMiddleware = moesif({
  applicationId: 'YOUR_MOESIF_APPLICATION_ID',
  logBody: true,
  getSessionToken: (req, res) => req.headers['Authorization'],
})

// Use Moesif after authentication middleware
app.use(authMiddleware);
app.use(moesifMiddleware);

/* snip */
Another example: if you have middleware for parsing HTTP bodies, place Moesif after that as well.
The preceding example intercepts requests once user context is available but before the request enters business logic. Capturing at this level makes certain that Moesif records every inbound and outbound traffic details, including status codes, latency data, and headers.
You may have a distributed or multi-gateway environment, like WSO2 or Kong; then integrate Moesif at the edge layer where requests first reach your network. That way, you corroborate uniform coverage across APIs; it also eliminates blind spots that internal routing and microservice fan-out precipitates.
Enrich Events with Context
Raw telemetry grows into utility when you correlate it to the customers and systems driving it. With Moesif, you have different ways to corroborate identification and attribution in analytics data:
- Customer identification for users and companies
- Custom metadata
- Event-level custom metadata
- User and company metadata
The following diagram illustrates how these components relate in Moesif’s data model:
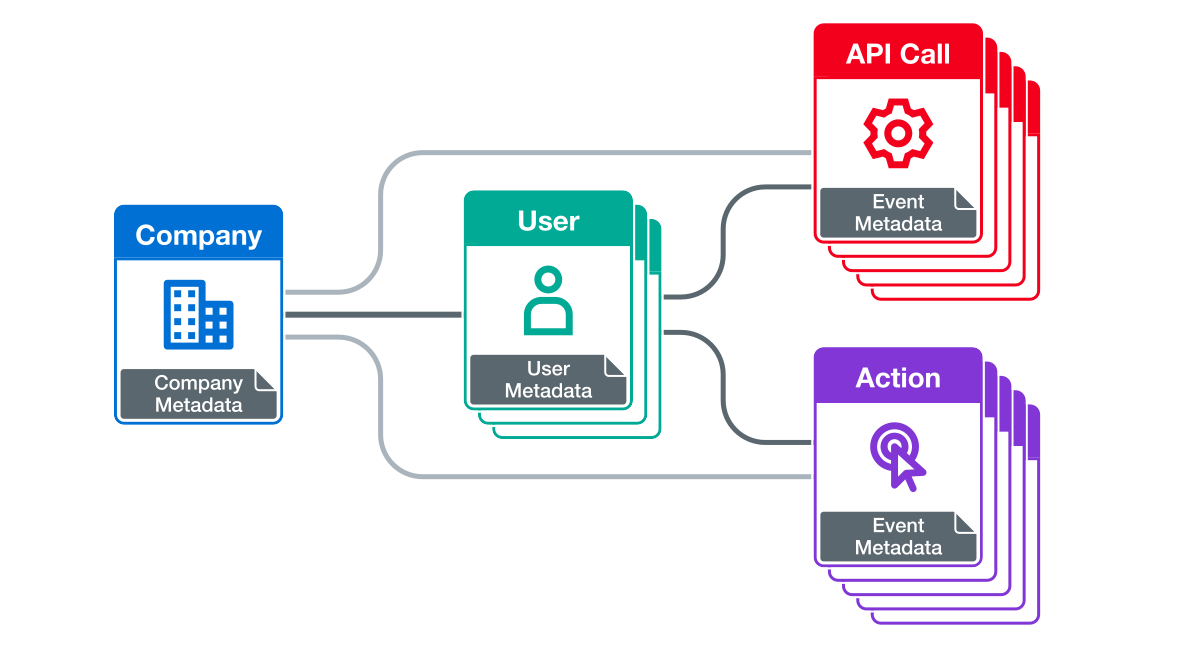
Using HTTP headers, you can inject this information at the API gateway or application layer. The custom metadata fields allow you to add identifiers like version numbers, LLM models, environment tags, and so on. From there, you define the proper filters in Moesif, and observe and utilize API calls pertinent to specific entities. API requests, no longer anonymous, become actionable observability data.
See a server integration documentation for more information on how to implement the identification and attribution layer you want for your setup.
Let’s get into more detail about enriching Moesif events with identifiers relevant to your architecture:
Identify Users and Companies
Each event can include a unique user ID, and, where applicable, a company ID. These identifiers allow fine-grained segmentation and behavioral analytics in Moesif; you can filter by account or customer in addition to endpoints and API-specific dimensions. This also sets up important components by which you can create and receive alerts.
Here’s a FastAPI example:
def identify_user(request, response):
    # Implement your custom logic which reads user id from your request context
    # For example, you can extract the claim from a JWT in the Authorization header
    return "12345"

def identify_company(request, response):
    # Implement your custom logic which reads company id from your request context
    # For example, you can extract the claim from a JWT in the Authorization header
    return "67890"

moesif_settings = {
    'APPLICATION_ID': 'Your Moesif Application Id',
    'LOG_BODY': True,
    'DEBUG': True,
    'IDENTIFY_USER': identify_user,
    'IDENTIFY_COMPANY': identify_company,
}

app = FastAPI()

app.add_middleware(MoesifMiddleware, settings=moesif_settings)
In conjunction with exhaustive API traffic data, customer identification makes possible deeper and more potent troubleshooting and debugging.
Consider some real-world issues:
- Which customers are observing increased
4xxerrors after deployment? - Has the new SDK release improved onboarding flow?
The following time series breaks down 4xx errors across companies. It also enables Percent Breakdown to easily understand what percentage of the traffic has incurred those errors:
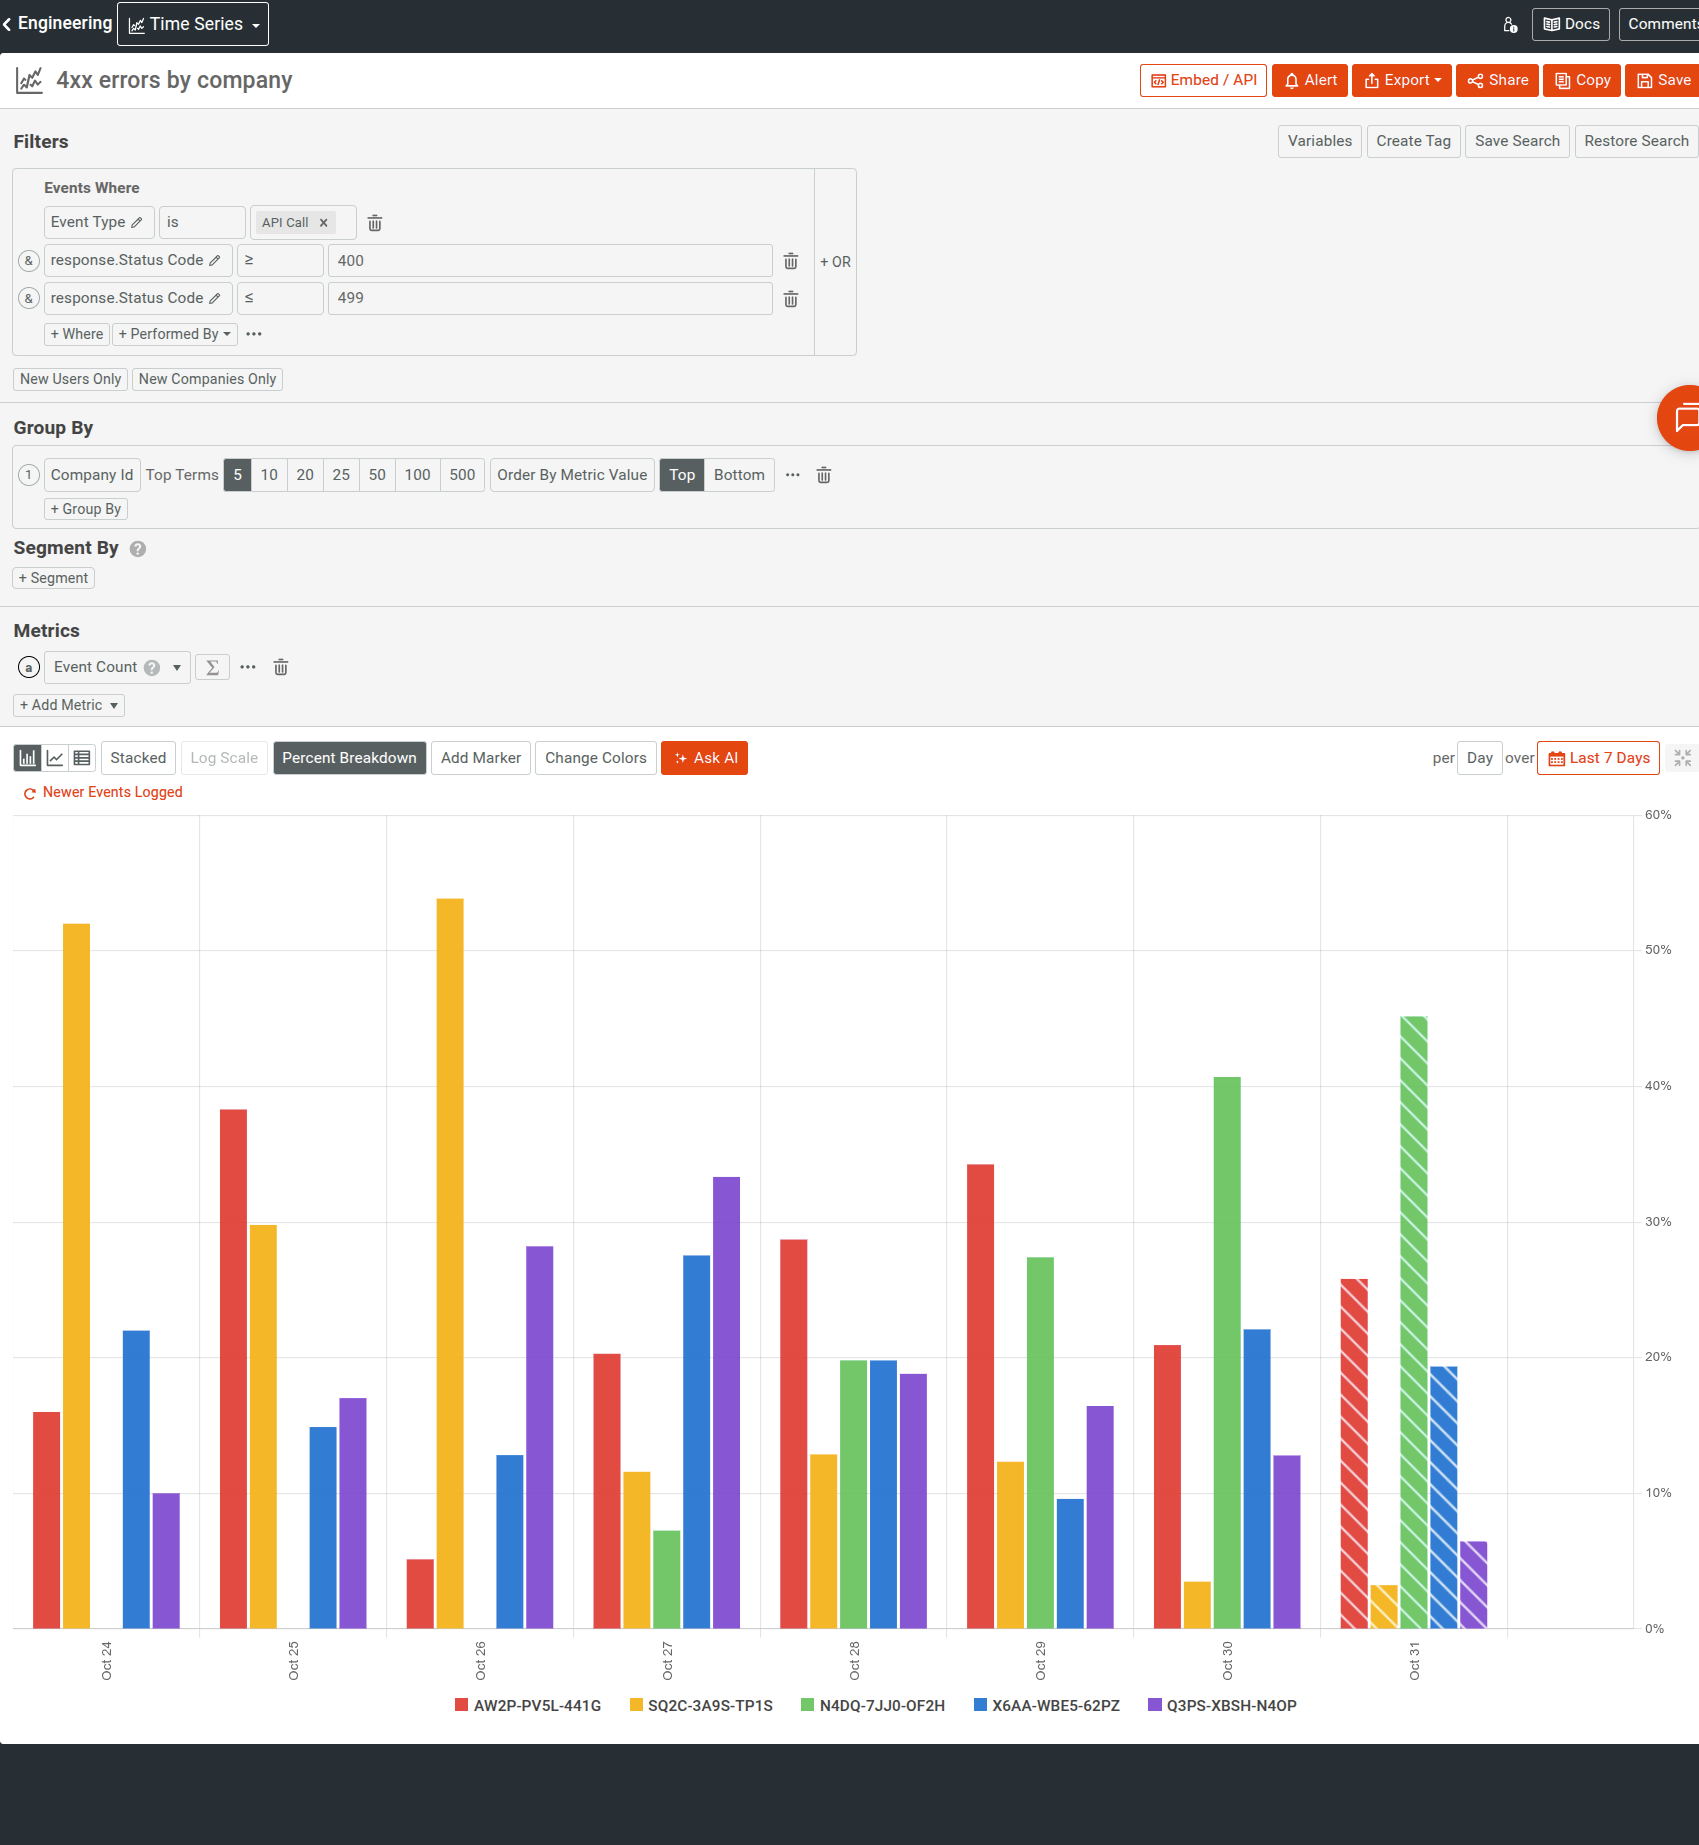
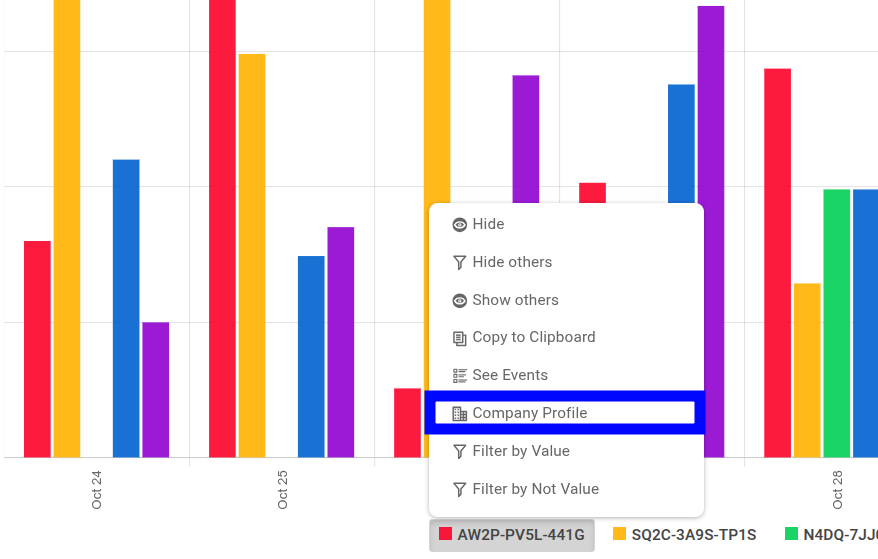
You can then interact with a company ID value to go straight to the company profile for more information about the customer.
Tag By Environment and Version
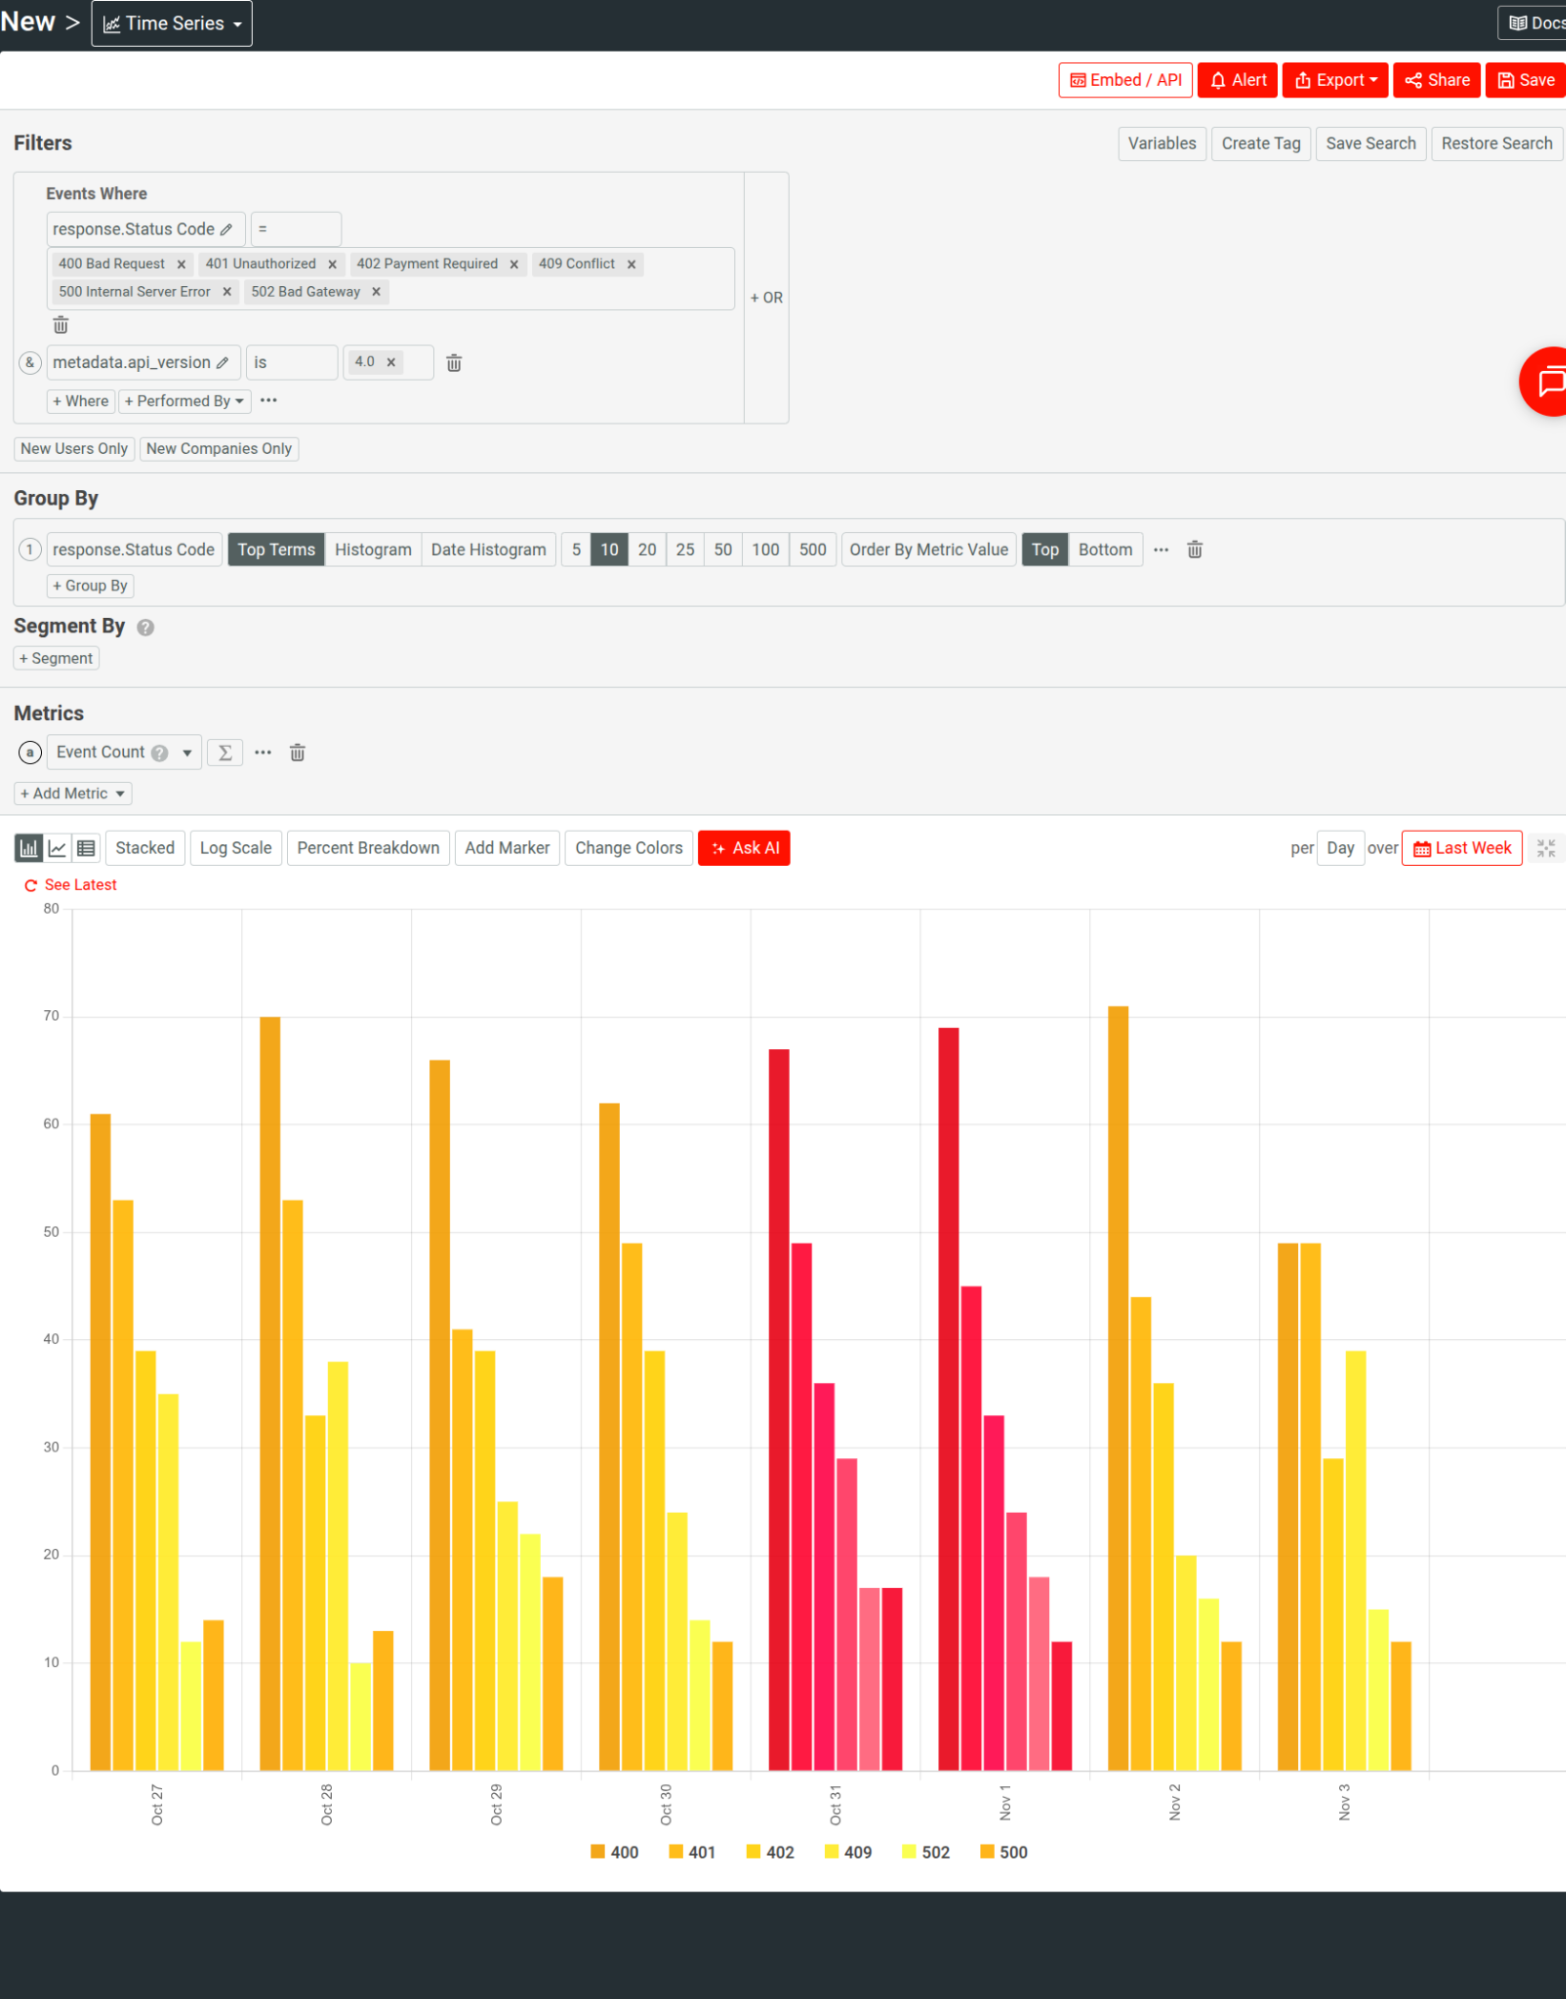
If you have multi-tenant or polyglot systems, consider tagging requests with version and environment identifiers: for example, explicit API versions and tags for staging and production environments. It also allows you to detect inconsistency in deployment states; for example, you may find that your staging behaves correctly but production exhibits higher latency and degraded performance.
These context fields also make it possible to filter or compare across versions to evaluate new releases. Engineers can intuitively visualize latency or error-rate differentials between API versions in Moesif UI, without custom queries, to validate performance before and after releases.
For example, the following time series analyzes error distributions for an API version:
Capture Custom Events
Moesif can track both incoming and outgoing HTTP requests. However, many workflows and activities happen asynchronously and in ways that never appear as HTTP requests. For example, webhook deliveries, queue processing, AI pipelines, or downstream handoffs don’t fit the criteria of an HTTP traffic component. Oversights of tracking these events leave consequential blind spots in observability.
To that end, Moesif supports custom actions. Actions are custom events or activities that occur based on user interactions or as side effects of other occurrences, for example:
- UI interactions like someone signing up or logging in
- System actions like internal retries or user-driven milestones
- Backend activities
You can log these custom actions programmatically using Moesif’s Actions API directly. You can also use event streams like AWS Firehose and Logstash.
An Action looks like this:
{
  "action_name": "Finished Data Processing Job",
  "request": {
    "time": "2025-01-28T04:45:42.914"
  },
  "company_id": "12345",
  "metadata": {
    "total_rows": 1024,
    "found_rows": 999,
    "consumed_input_tokens": 54322,
    "time_seconds": 66.3
  }
}
You can correlate these events with API usage to, for example, understand failure cascades or measure workflow reliability. If a webhook retry event precedes 5xx error responses and you observe an increase in such responses, it might point to an integration hitch. You become conscious of a potential issue before it impacts your customers and any support tickets.
In Moesif, you can filter by actions-type events and action names, For example, the following Live Event Log shows custom action events like users visiting landing page, signing-in, and so on:
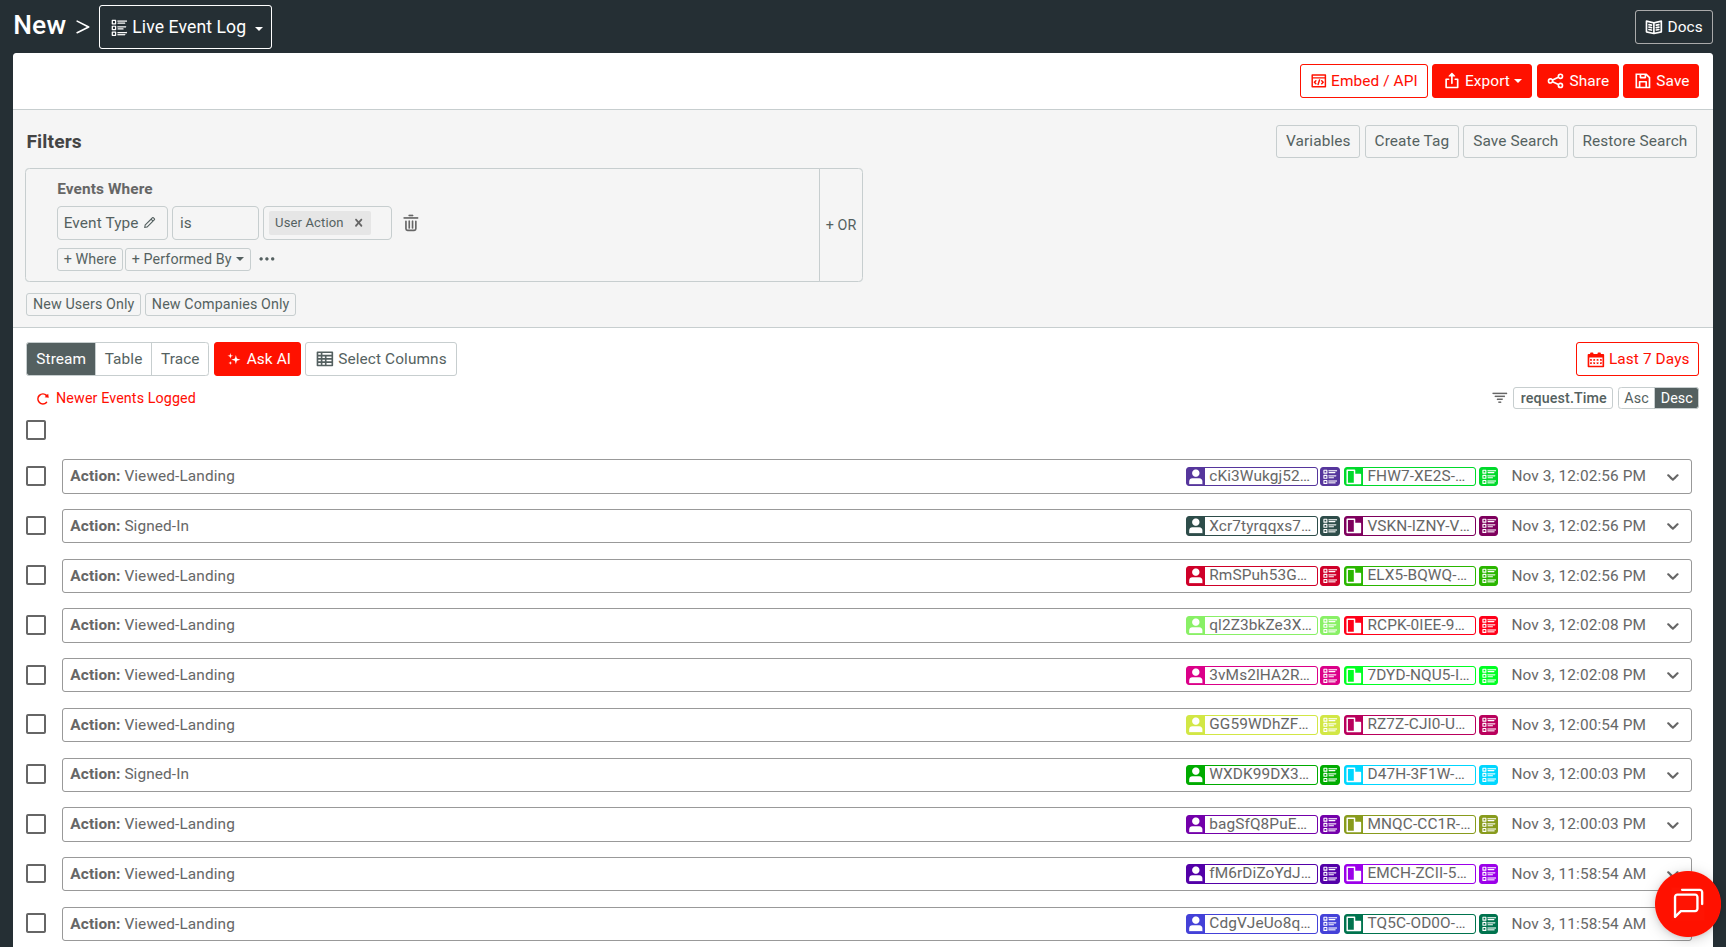
On top of that, consider if you have HTTP events that delineate a specific outcome or action; you can attach a meaningful and recognizable name for it programmatically using the action_name field.
Here’s another example that breaks data export operations across customers by filtering the relevant action’s name:
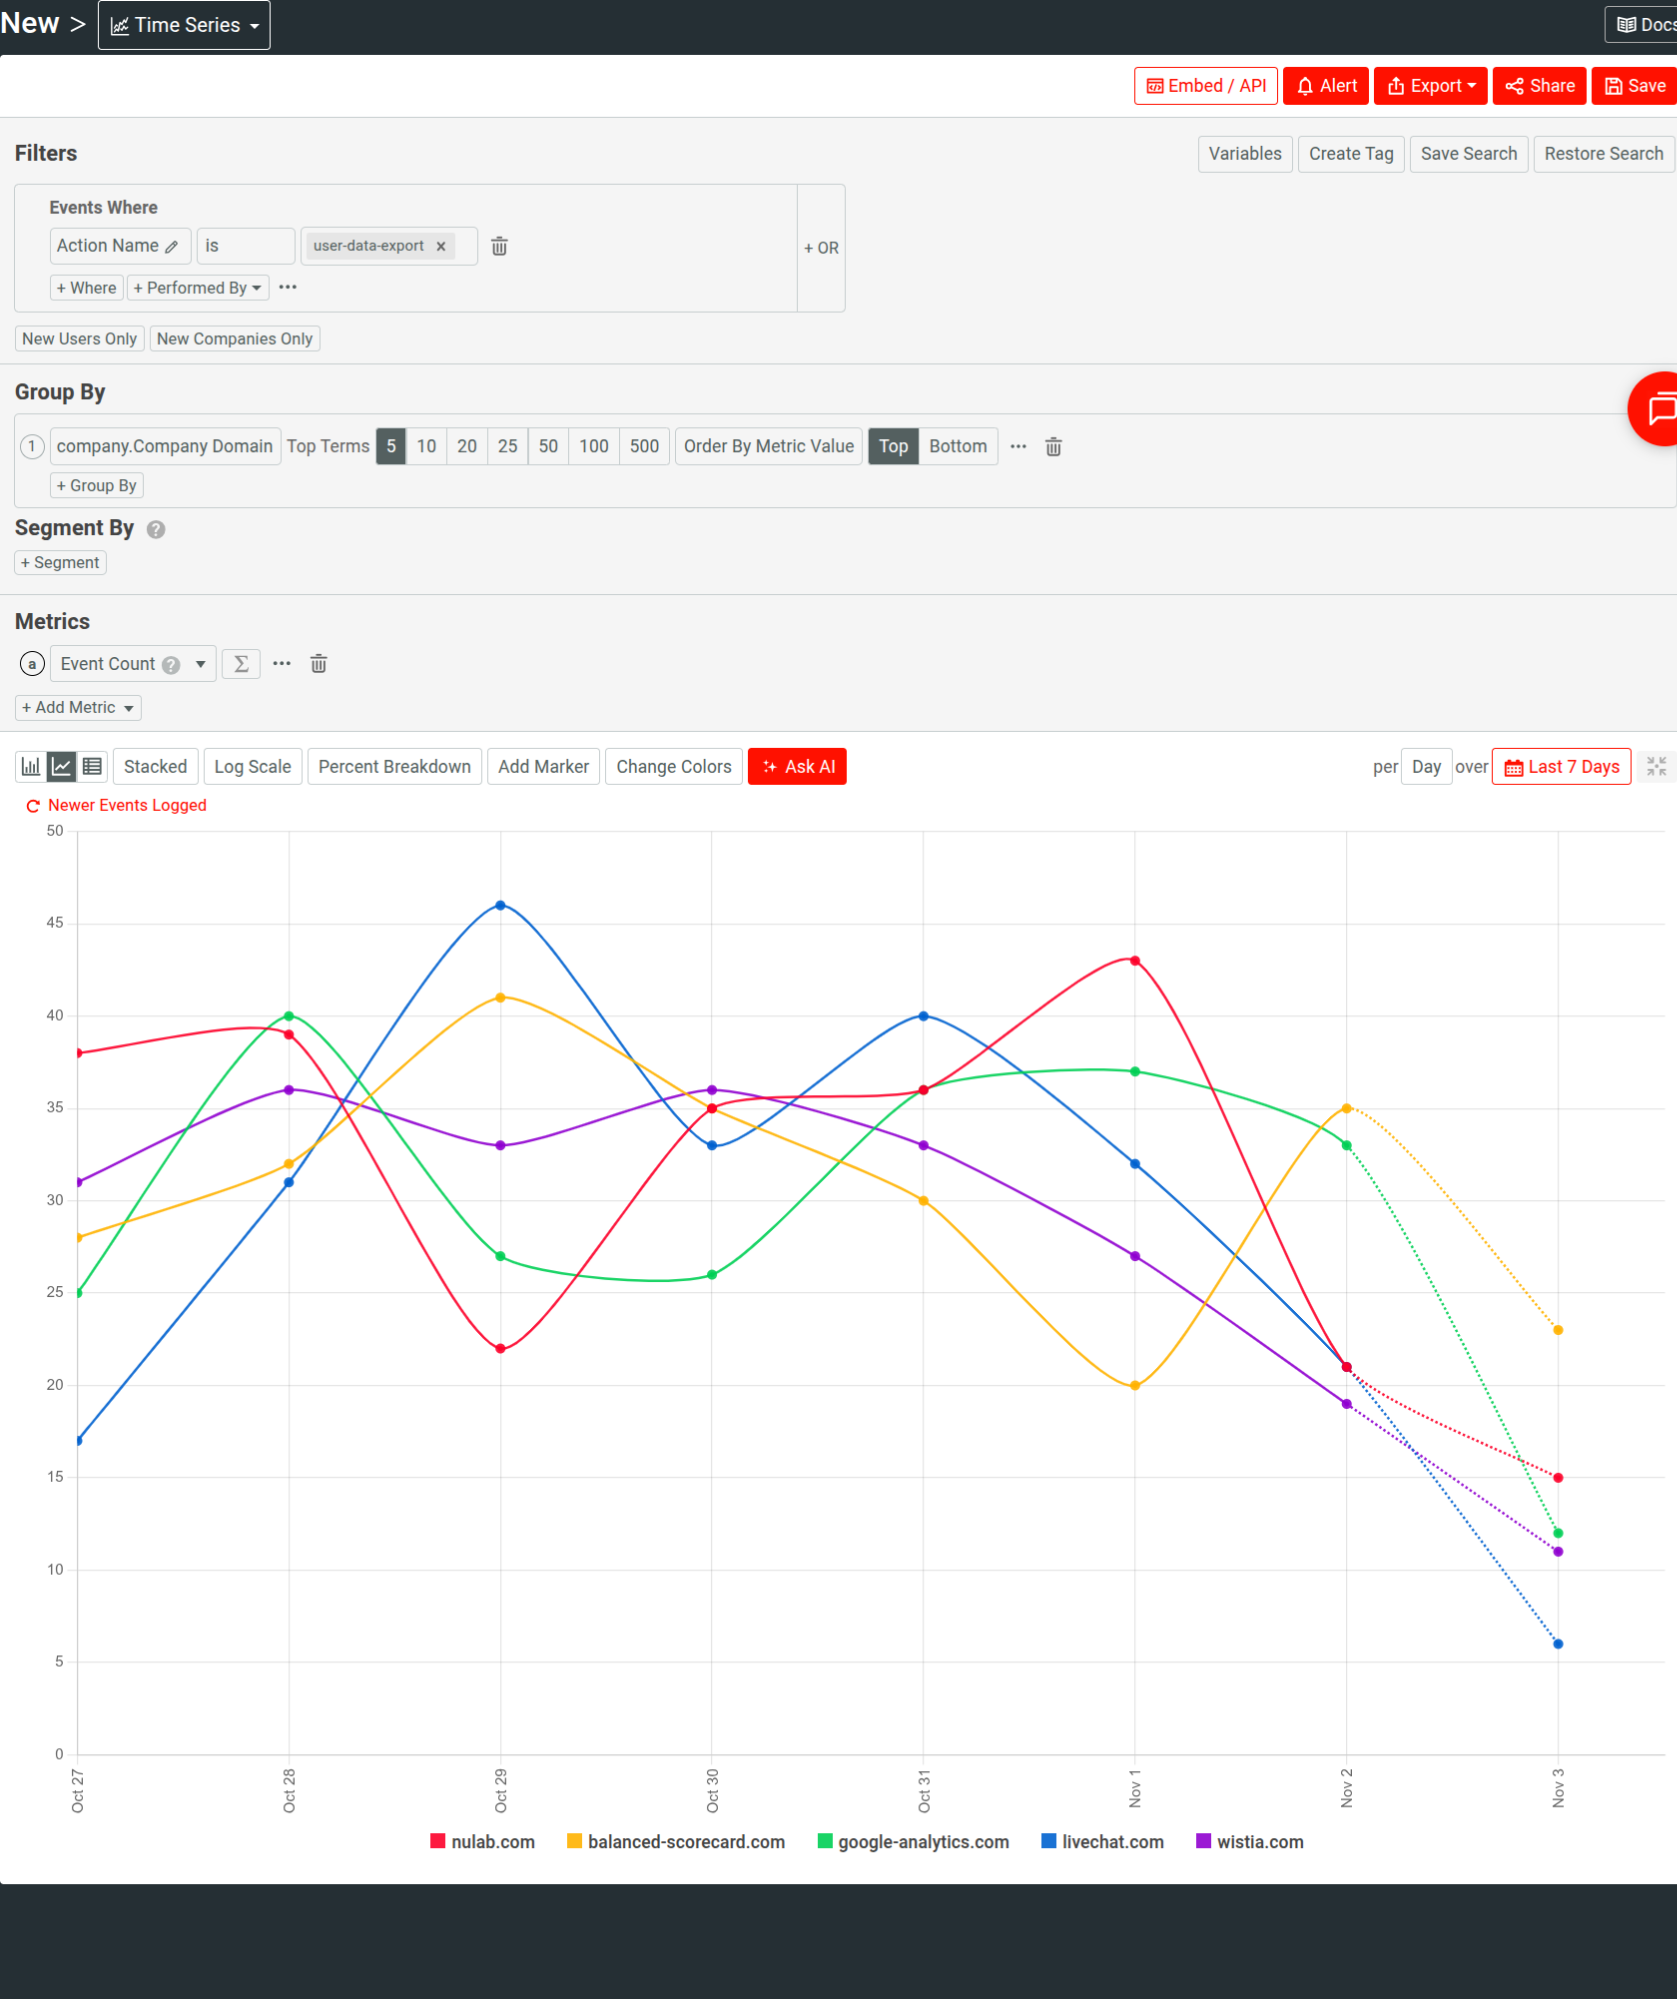
We recommend that you use custom actions selectively. Prioritize flows that delineate critical business or reliability events, from where silent or non-obvious failures can originate:
- Webhook delivery attempts and acknowledgments
- User actions that indicate successful onboarding, provisioning, or purchased plan
Integrate Moesif into Engineering Workflows
Lastly, route the insights Moesif gives you into systems your engineers already work: Slack, PagerDuty, emails, or custom internal webhooks for fine-grained automation.
Alerts in Moesif are highly customizable and can serve assorted use cases. In place of opening an analysis in Moesif reactively, your defined alert rules can automatically notify teams when specific conditions meet:
- Trigger an alert when a single account produces over 50
401 Unauthorizederrors in a small amount of time. - Send a PagerDuty incident if a critical endpoint’s
5xxerror rate exceeds a specific percentage. - Notify a Slack channel if usage for a key account drops by more than 70% over a small time window.
Moesif requires you to specify a channel to dispatch alert notifications to. You can, for example, use a Slack channel to observe transient issues, while PagerDuty supports production-impacting incident response.
For more information, see Real-Time Rolling Alerts and Calendar-Based Alerts that demonstrate how you can monitor real-time incidents and long-term anomalies and trends.
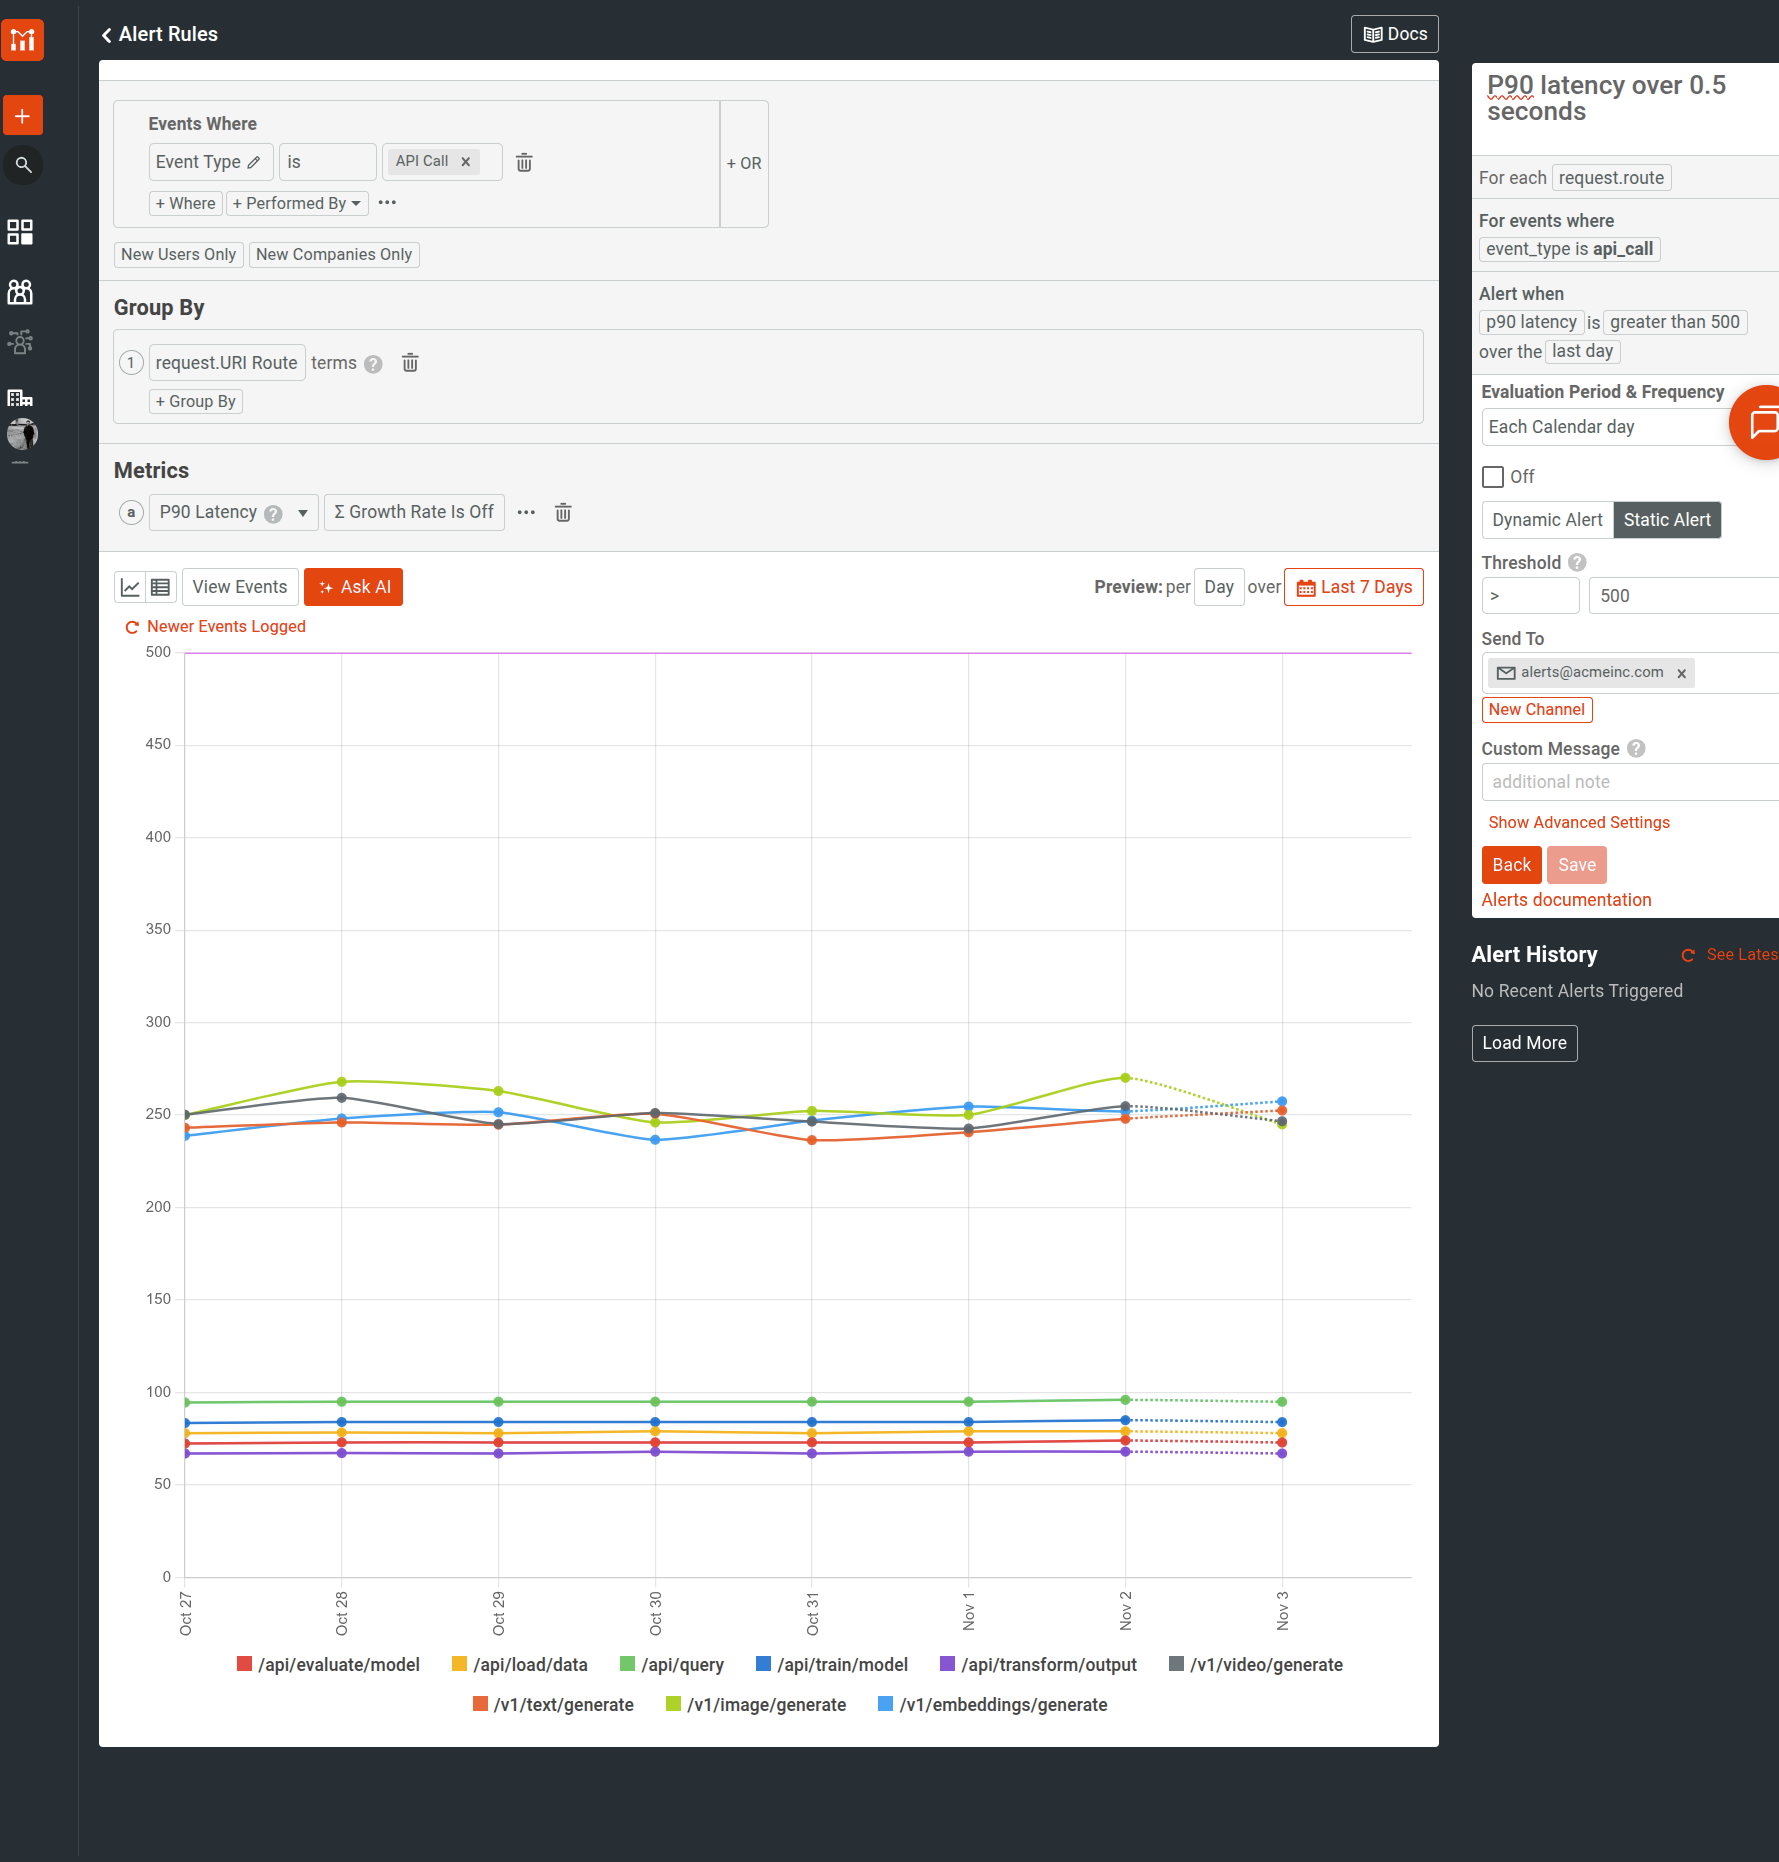
As an example, the following static alert rule monitors the P90 latency for a GenAI API. It sets a static threshold of 500 milliseconds and evaluates the latency metric each calendar month.
Embed Dashboards
Moesif supports securely embedding your analysis metrics into external workflows and third-party solutions. It can strengthen your internal observability by making it continuous, seamless, and more accessible, through familiar day-to-day tools. Real-time, flexible, and fast access to API metrics and customer behavior makes sure that you can observe them alongside system and infrastructure metrics; consequently, both technical and customer context substantiate your incident responses and initiatives.
Safeguard Privacy and Data Hygiene
Moesif provides field-level redaction through configuration options to mask sensitive resources, especially in systems handling personally identifiable information (PII) or financial data. You can therefore make sure replace or remove such resources before they leave your environment,
Here’s a Node.js sample that uses the maskContent option to remove two fields from the event model before sending to Moesif:
import _ from 'lodash';

var options = {
  maskContent: function(event) {
    const newEvent = _.omit(event, ['request.headers.Authorization', 'event.response.body.sensitive_field'])
    return newEvent;
  }
};
We also recommend that you regularly carry out audits to make sure that event payloads are lightweight and focused, and no unnecessary fields exist. Effective API observability should prioritize relevance of data over volume.
Wrapping Up
Consider how AI is taking over industries and systems becoming more distributed; more and more contracts exist among APIs, clients, and integrations. They not only serve end users, but also internal customers, and engineers that work on these systems as well. As a result, there is more room for silent failures and missed technical and business opportunities.
The efforts you put behind capturing and enriching the data through Moesif pay off every time you encounter something unanticipated. Moesif encourages thoughtful instrumentation, consistent enrichment, and the discipline to be mindful about the data you emit; explicit intent and control will give you more precise insights and thereby more utility.


