How to Monitor API Usage and Performance with the Moesif Plugin for AWS API Gateway
API gateways provide a central point to govern and control access to your APIs, enabling customers and partners to quickly create new experiences. Amazon API Gateway has native support for a variety of compute resources like AWS Lambda or Amazon Elastic Compute Cloud (Amazon EC2).
API Observability
API observability can provide your business and engineering teams with deep insights into how your APIs are used, including key API metrics that help monitor and analyze performance. API observability is leveraged by a variety of teams including:
- Product teams to understand API usage and business value
- Engineering teams to monitor and troubleshoot API issues
- Security teams to detect and protect from API threats
Moesif API Analytics is an API observability solution that you can leverage to better understand API usage. There is a native integration with Amazon API Gateway which makes deployment just a matter of a few clicks and does not require any code change or restarts. As the gateway to the rest of your infrastructure, API gateways are also the natural place to provide API observability to your various business and engineering teams.

Understanding APIs and API Performance
What is an API? - Application Programming Interfaces Explained
An API, or Application Programming Interface, is a set of defined rules that enable different software systems to communicate with each other. It acts as a bridge, allowing various applications to exchange data and functionality seamlessly. In essence, APIs define how requests and responses should be structured, enabling different systems to interact efficiently.
APIs are integral to modern software development, facilitating communication between disparate systems. They are widely used across various industries, including finance, healthcare, and e-commerce, to enable interoperability and data exchange. By providing a standardized way for applications to interact, APIs help streamline processes and enhance the functionality of software systems.
Solution overview and use cases
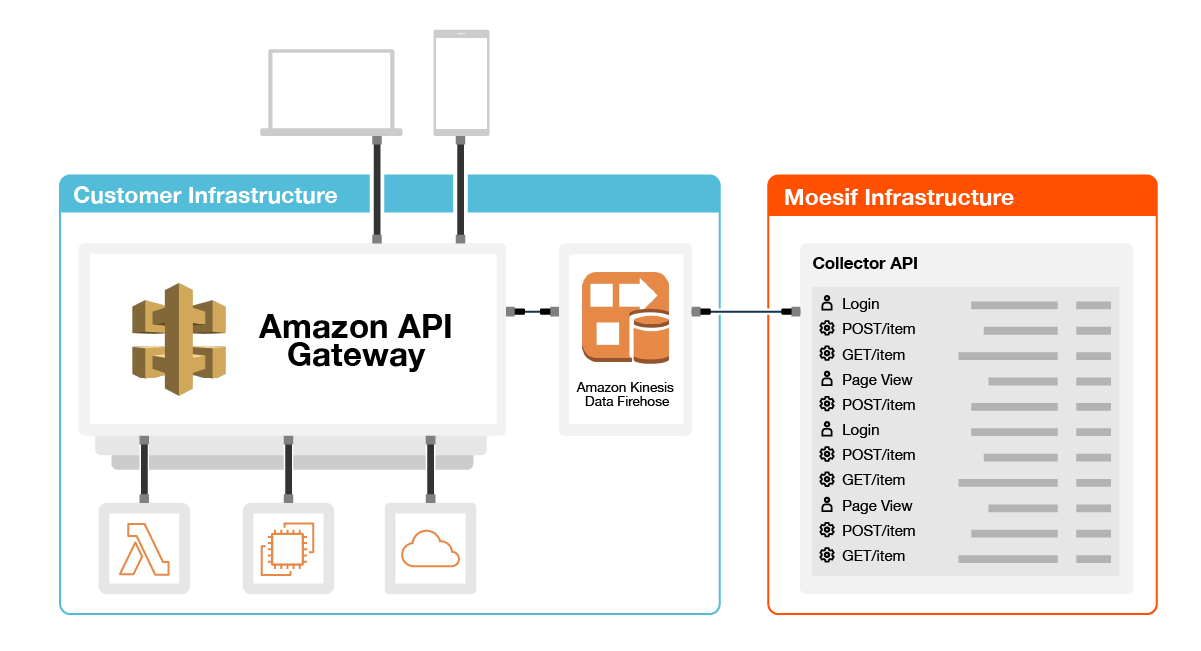
Moesif can add API analytics to your APIs hosted behind AWS API Gateway. This can help you optimize your API through detailed performance analysis. It works by forwarding structured API access logs from your Amazon API Gateway instance to Moesif via an Amazon Kinesis Data Firehose. Deployment of the solution can be done in a few clicks using the included CloudFormation template and doesn’t require any downtime. Once done, you can achieve a few objectives:
Understanding customer API usage
A key objective for API analytics is understanding who is using your APIs and how they use them. By default, Moesif ties your API calls back to a user identifier through parsing the request context with $context.authorizer.principalId or $context.identity.cognitoIdentityId so you can understand user behavior.
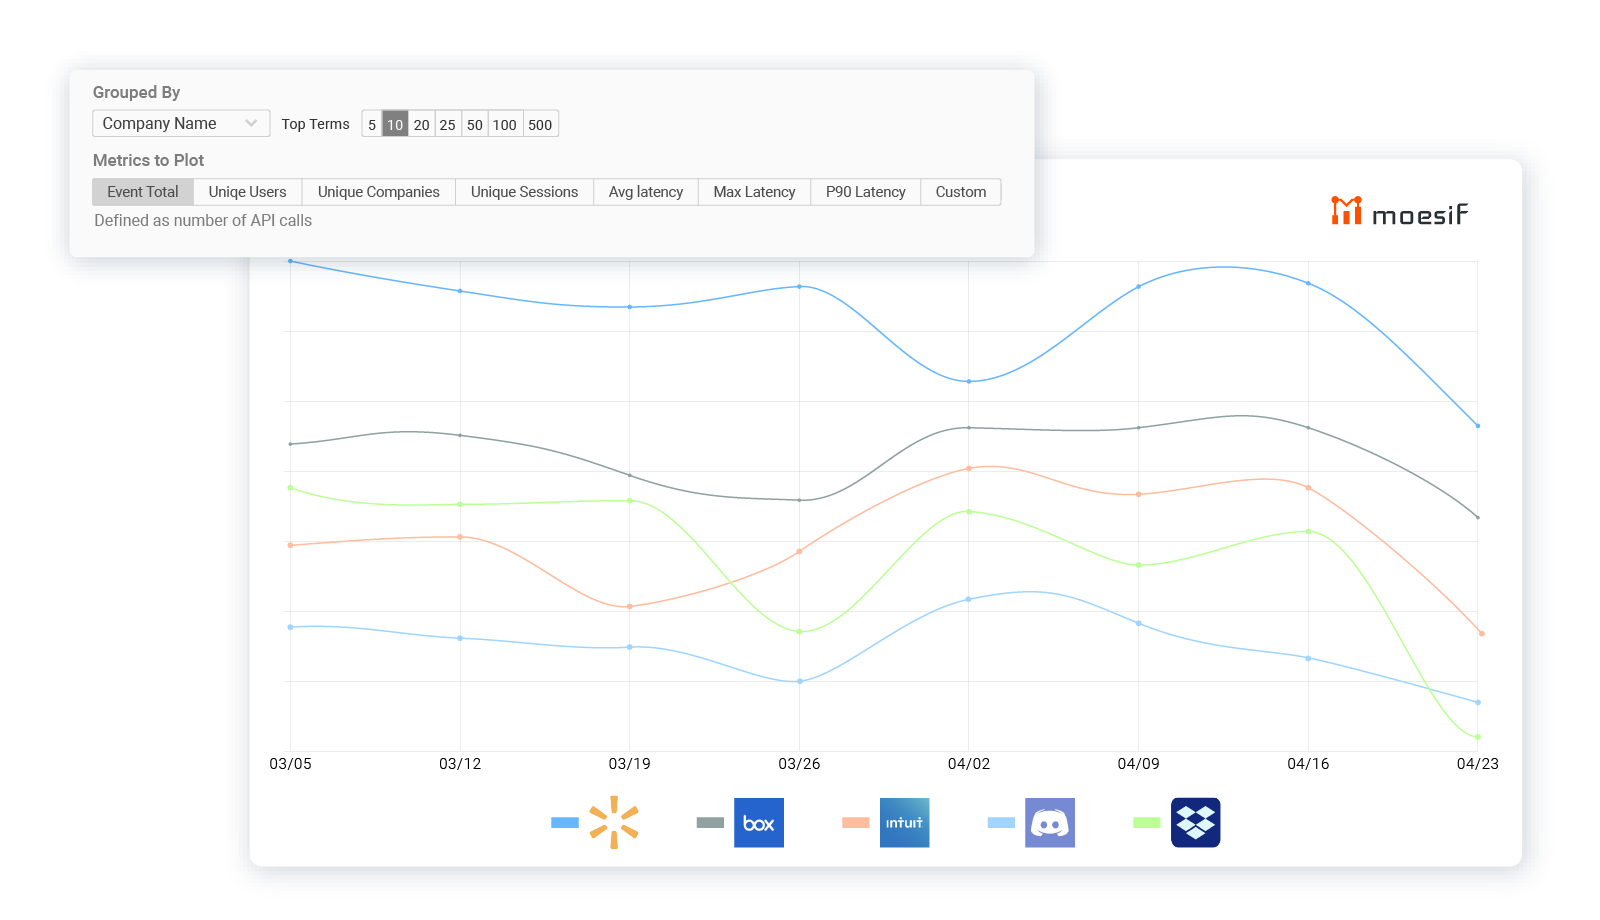
A critical report is understanding which customers are using your APIs the most. APIs logs traditionally don’t include customer demographic information, but an API analytics system like Moesif can automatically join with other data sets containing customer attributes like user email or company domain. Users can be tracked with client integrations like moesif-browser-js or Segment using the same user id. Then we can bring up a usage report showing API traffic by company.
Troubleshoot API performance issues
With high-cardinality, high-dimension API observability, you can slice and dice your API logs by any number of fields including HTTP headers or response time. This makes it easy to quickly troubleshoot API errors without manual log search. A core engineering metric for APIs is latency percentiles such as the 90th percentile. The best practice is to look at 90th percentile latency over the average. This practice helps uncover large variations in your latency that can be masked by low averages. Your API users are looking for consistently low latency not the lowest average as spikes can wreak havoc in their own services.
To do this, go to Events -> Time series and Select the P90 Latency Metric. It’s a good idea to also understand this broken down by route or service. To do so, add a group by “Request URI.” Moesif will automatically consolidate routes such that /items/1 and /items/2 will show up as /items/:id in the UI:

Find API security threats
As you expose more APIs to the internet used by customers, partners, and single page apps, your security risk goes up. Traditional mechanisms like browser fingerprinting and captchas don’t work so you need to leverage advanced user behavior analytics to find suspicious users.
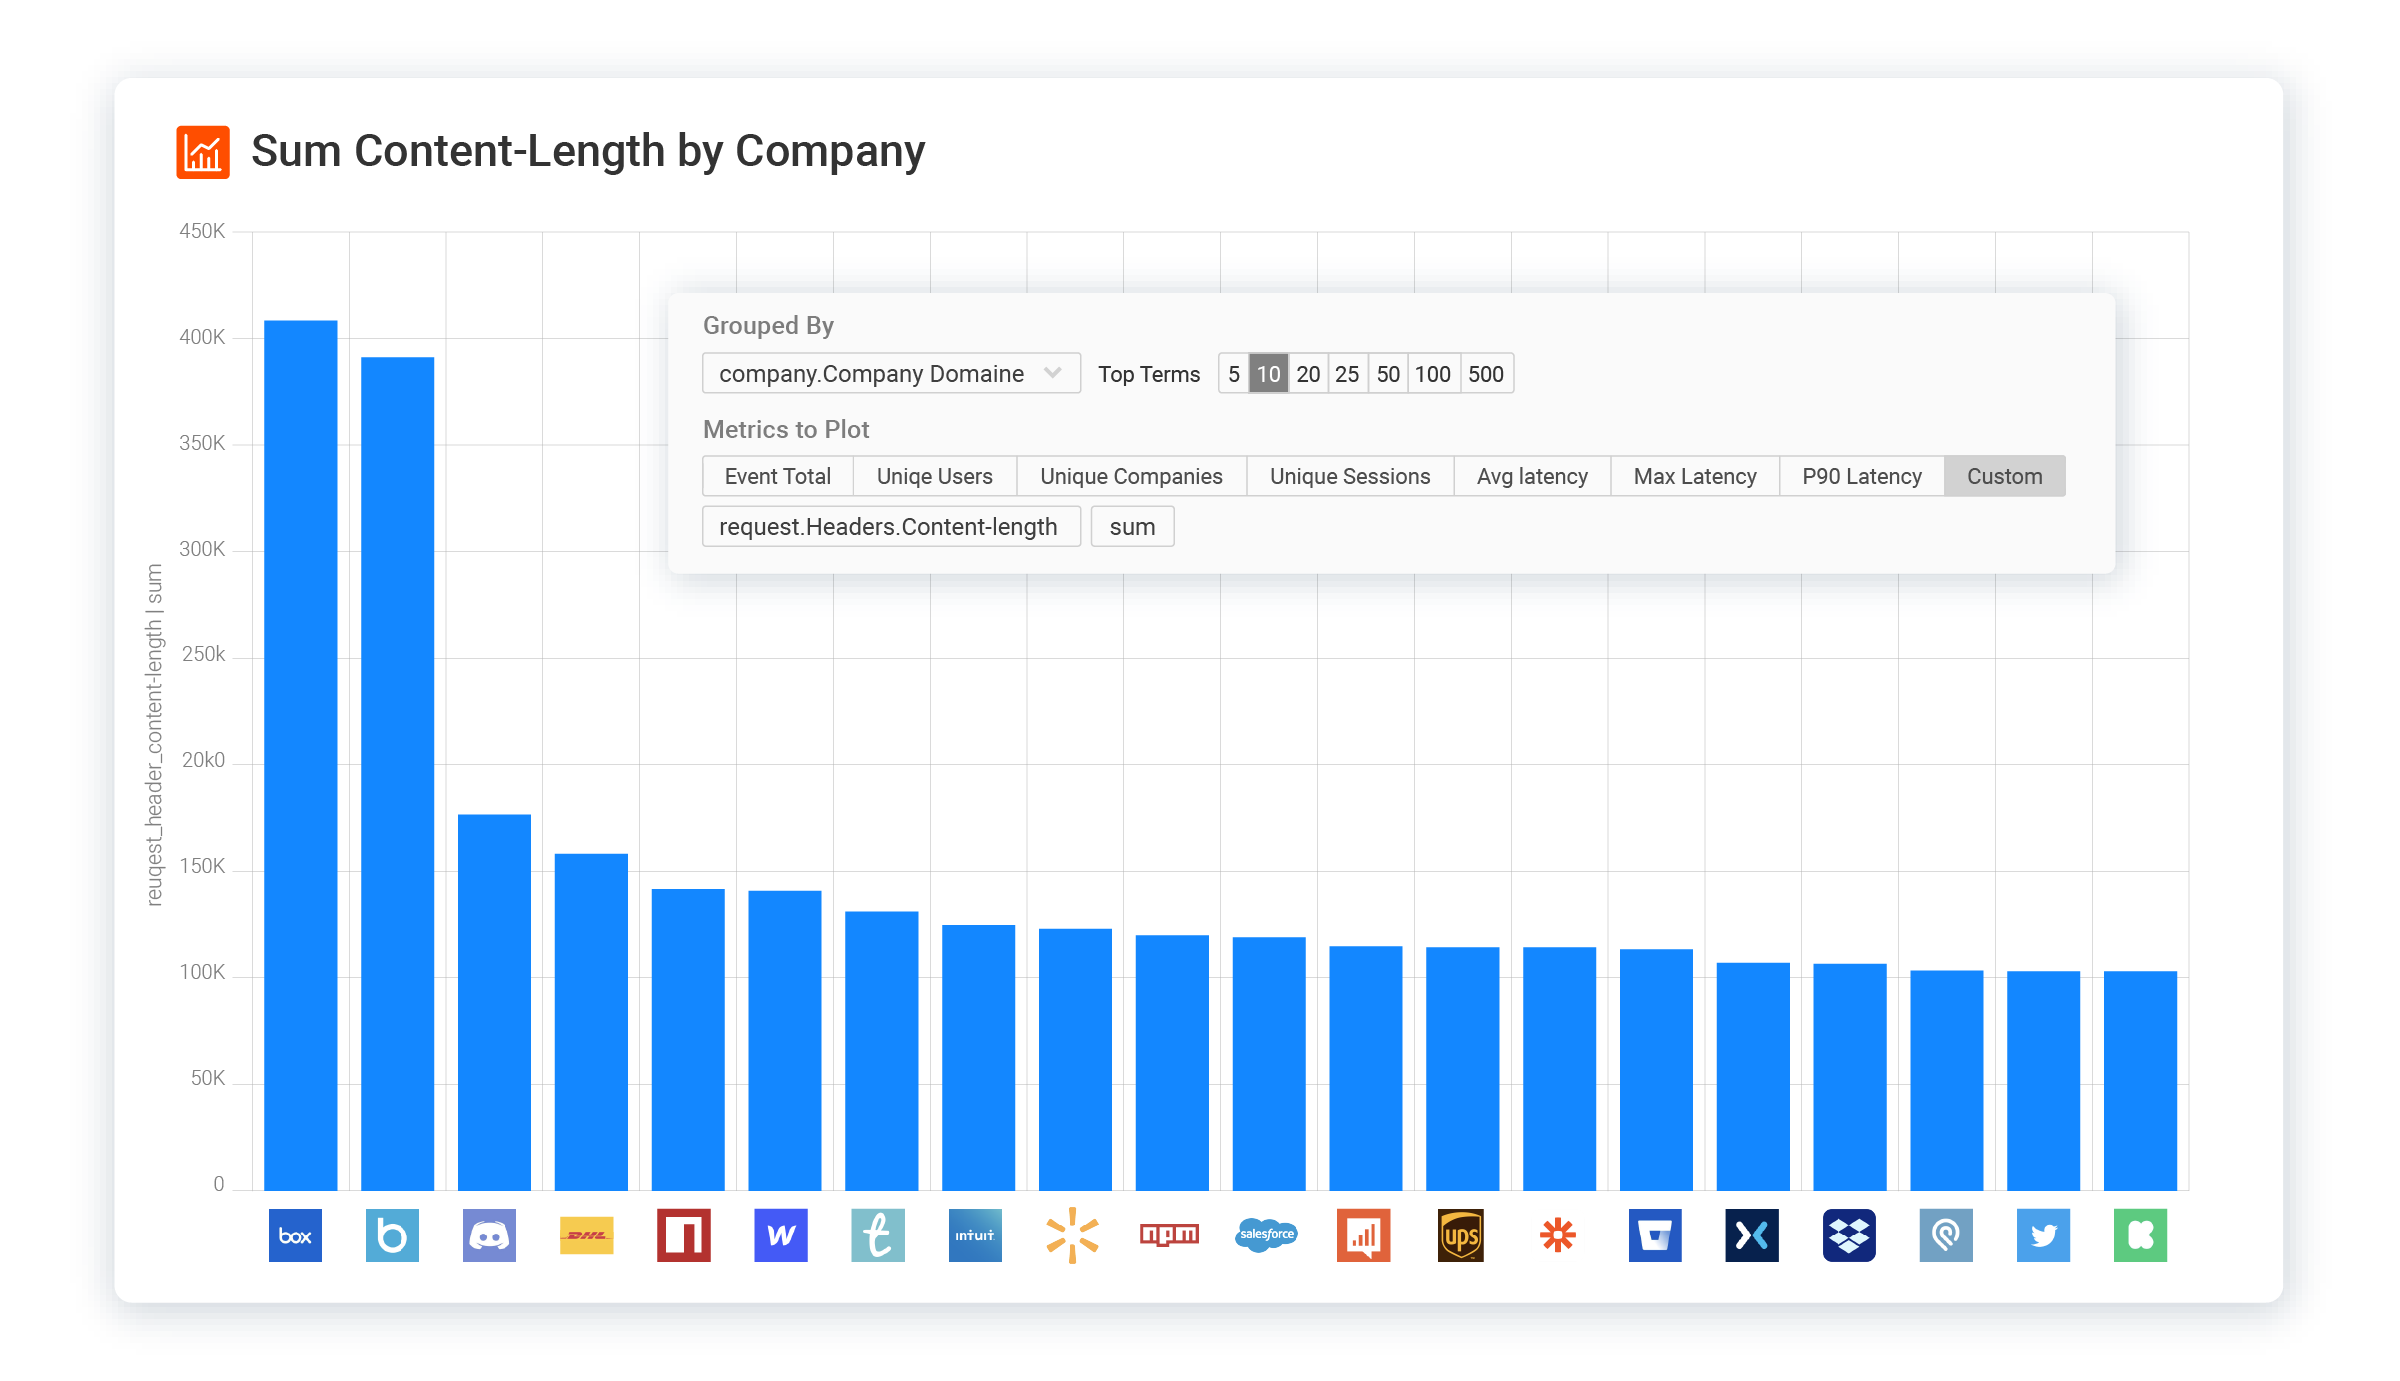
A common API security threat is not limiting access to your proprietary data. A hacker can then download all this data via a pagination attack. A method to detect customers abusing your API this way is to look at the amount of data downloaded per customer. To create this metric, add a summation of response.headers.Content-Length and then group it by customer name:
How to set up
The integration works by adding an Amazon Kinesis Data Firehose which receives API Access logs from your Amazon API Gateway and sends them to Moesif. There are two types of logs from API Gateway logs: API Access Logs and CloudWatch Execution Logs. While execution logs are unstructured but human readable, API access logs are structured and more machine-parsable. In addition, the logs contain the user identity which makes them perfect for user behavior analytics tools like Moesif.
1. Launch CloudFormation Stack
Use the Amazon Web Services CloudFormation template from Moesif to automatically create a Kinesis Data Firehose and configure it to send API access logs to Moesif. To get started, click the launch stack button below.

This will open the Quick create stack within the AWS Console. You will need to enter your real Moesif Application Id under the Parameters section. Your Application Id can be found by signing into your Moesif account which can be done on AWS Marketplace.
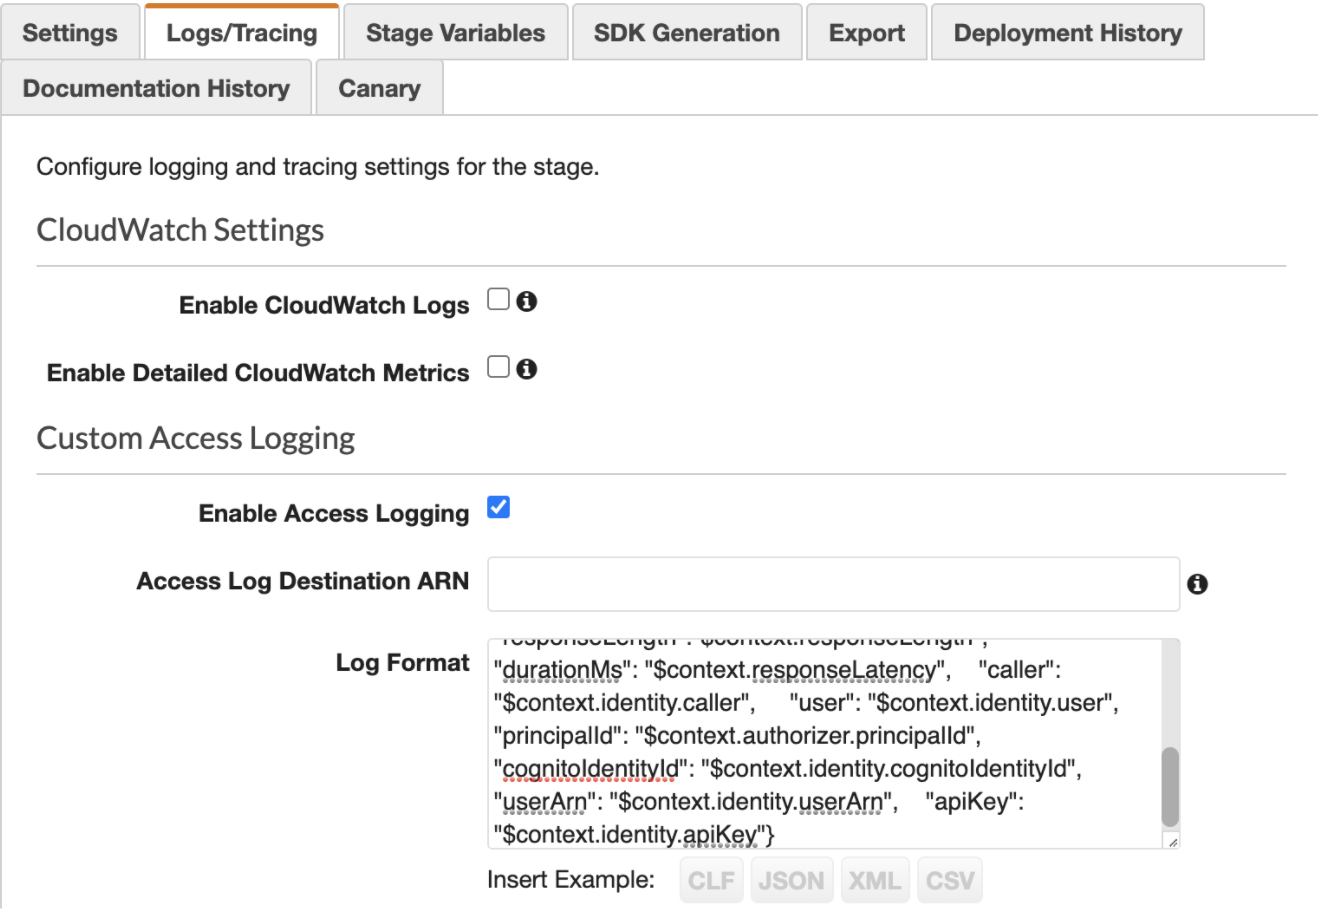
2. Enable API Gateway access logging
You will need to enable API Access Logs in Amazon API Gateway and send it to the Kinesis Data Firehose from Step 1.
- Go to your AWS API Gateway instance within the AWS Console.
- Select Stages on the left menu and then select the Logs/Tracing tab
- Toggle on Enable Access Logging.
- Add your Firehose ARN from Step 1 under Access Log Destination ARN.
3. Add the JSON log format
Now that you enabled access logs, you need to add the below JSON log format so the output is compatible with Moesif. Moesif will safely ignore any extra keys.
{   "apiId": "$context.apiId",
    "requestId": "$context.requestId",
    "requestTime": "$context.requestTime",
    "protocol": "$context.protocol",
    "httpMethod": "$context.httpMethod",
    "resourcePath": "$context.resourcePath",
    "requestHostHeader": "$context.domainName",
    "requestUserAgentHeader": "$context.identity.userAgent",
    "ip": "$context.identity.sourceIp",
    "status": "$context.status",
    "responseLength":"$context.responseLength",
    "durationMs": "$context.responseLatency",
    "caller": "$context.identity.caller",
    "user": "$context.identity.user",
    "principalId": "$context.authorizer.principalId",
    "cognitoIdentityId": "$context.identity.cognitoIdentityId",
    "userArn": "$context.identity.userArn",
    "apiKey": "$context.identity.apiKey"
}
4. Success!
With the API Gateway integration done, you should see your API logs show up in Moesif. Make a few calls against your API Gateway domain and see them show up in Moesif’s event log in real-time. You should see the status code, URL, and other HTTP parameters captured like the below screenshot:

API Call Monitoring and Analytics
Tracking and Analyzing API Calls
API call monitoring and analytics are pivotal for gaining a comprehensive understanding of how your APIs are utilized, identifying performance bottlenecks, and optimizing overall API performance. By meticulously tracking and analyzing API calls, you can uncover valuable insights into usage patterns, pinpoint areas for improvement, and enhance the user experience.
API call monitoring involves real-time tracking of API requests, responses, and errors. Utilizing robust API monitoring tools, you can gather detailed analytics and insights into various aspects of API performance. These tools enable you to track essential API metrics such as response time, throughput, error rate, and latency.
Analyzing API calls allows you to identify trends and patterns in API usage. For instance, you can determine peak usage times, the most frequently accessed API endpoints, and common error messages. This information is invaluable for optimizing API performance, bolstering API security, and ultimately delivering a superior user experience. By leveraging these insights, you can ensure that your APIs are running efficiently and meeting the needs of your users.
API Performance Optimization
Improving API Performance
Enhancing API performance is crucial for delivering a smooth and efficient user experience. Several strategies can be employed to optimize API performance, including reducing the number of API calls, minimizing data transfer, and implementing caching and load balancing.
Optimization techniques such as reducing the number of API calls can significantly improve performance. By consolidating multiple requests into a single call, you can reduce the overhead and latency associated with multiple requests. Additionally, minimizing the amount of data transferred in each call can further enhance performance by reducing the load on the network and backend services.
Caching is another powerful technique for improving API performance. By storing frequently accessed data in a cache, you can reduce the need for repeated API calls, thereby decreasing latency and improving response times. Load balancing, on the other hand, helps distribute API traffic across multiple servers, ensuring that no single server becomes a bottleneck. This not only improves performance but also enhances the reliability and scalability of your API.
Advanced User Behavior Analytics
You can leverage your integration beyond just looking at API calls in isolation and stitch your entire customer journey together. This approach makes it easier to see things like funnel reports on “Time to First Hello World” and “Time to Value.”
Track user actions in your UI such as “Signed In” or “Viewed Docs” and start tracking user actions in your UI like “Signed In” or “Viewed Docs”. This makes it easier to slice and dice API usage by customer traffics. In order to do so, add the moesif-browser-js to your UI and call the track method:
moesif.track('Clicked Sign Up', {
  button_label: 'Get Started',
  sign_up_method: 'Google SSO'
});
Once done, the first thing you should do is generate a funnel report. In the below report, we created a funnel analysis composing of three steps.
- The first step is a customer signing into your web application (a user action).
- The second step is a single payment transaction via the API. Thus moving from step 1 to step 2 shows the conversion rate of sign ups to the first API call.
- The third step is over 100 payment transactions. For this example, we consider this the “aha” moment demonstrating customer value. Moving from step 2 to step 3 shows the drop off of customers who made API calls who actually got to see real value.

API Usage and Customer Insights
Understanding Top Customers and API Usage Patterns
Gaining a deep understanding of API usage patterns and customer behavior is crucial for driving business growth and enhancing the user experience. By analyzing API usage data, you can uncover insights into your top customers, their usage patterns, and key customer demographics.
API analytics tools provide detailed insights into how your APIs are being used. By examining this data, you can identify your top customers, the most frequently accessed API endpoints, and common error messages. This information helps you understand which aspects of your API are most valuable to your users and where there may be opportunities for improvement.
Additionally, customer insights can be derived by analyzing demographic data such as location, industry, and company size. This information allows you to tailor your API development and deployment strategies to better meet the needs of your top customers, thereby improving the overall user experience. By understanding who your customers are and how they use your APIs, you can make more informed decisions that drive business growth and customer satisfaction.
API Metrics and Reporting
API Metrics for DevOps and Business Growth
Tracking API metrics and generating comprehensive reports are essential for measuring API performance and driving business growth. By monitoring key API metrics, you can gain valuable insights into performance, identify bottlenecks, and optimize your APIs for better efficiency.
API metrics can be tracked using advanced API monitoring tools that provide detailed analytics and insights. Key metrics to monitor include response time, throughput, error rate, latency, and overall API traffic. These metrics offer a clear picture of how your APIs are performing and where improvements may be needed.
API reporting involves generating detailed reports on these metrics to provide a comprehensive view of API performance. These reports can help identify trends and patterns, allowing you to make informed decisions about API development, deployment, and optimization. By leveraging these insights, you can ensure that your APIs are running smoothly, meeting user expectations, and contributing to business growth.
API Security and Authentication
Securing API Keys and Authentication
Securing API keys and authentication mechanisms is paramount to prevent unauthorized access to your APIs. API keys are used to authenticate and authorize API requests, but they can be vulnerable to theft and misuse if not properly secured. To protect your API keys, it is essential to use encryption and secure storage.
Authentication tokens provide an additional layer of security by validating each API request. These tokens can be generated using various algorithms and should be securely stored and transmitted. It is crucial to keep API keys and authentication tokens confidential and not share them with unauthorized parties. Implementing robust security measures ensures that your APIs remain protected from unauthorized access and potential threats.
Conclusion
Having the right API observability solution can provide your team with the right visibility to make informed decisions. While you can roll your own API gateway, data processing pipeline, and a data warehouse, this can create a massive time sink for your engineering team. Using fully managed services like Amazon API Gateway and Moesif API Analytics can help you scale without being held back by high maintenance costs or outdated data infrastructure. To get started, you can sign up for a free Moesif account right on AWS Marketplace.


Related Articles

API Strategy
Leveraging AI For a Better API Strategy
Learn how to leverage AI to build and fortify your API strategy. Improve design, governance, documentation, and align APIs with business outcomes.
API Strategy
The 5 Best Mixpanel Alternatives of 2025
Learn about the best Mixpanel alternatives to determine the right analytics solution for your use case.

API Development
How to Leverage Moesif Effectively for API Observability
Effectively leverage Moesif for API observability through best practices for integration, event enrichment, custom actions, and engineering workflow integrat...
API Strategy
How to Build an Internal Chargeback Model for Your API and AI Usage Using Moesif
Use Moesif to implement internal chargebacks and enable precise API and AI cost attribution for better transparency and resource optimization.
