User and Company Lookup
This document explains how to use Lookup analysis in the Moesif’s User and Company Analytics suite.
Moesif supports Lookup analysis for both Users and Companies. Unless this document states explicitly, it uses the term user to represent both Users and Companies for simplicity.
Overview
The Lookup analysis allows you to look up individual customers, like a CRM (customer relationship management) system. You can filter by any user properties like email or company domain. Since Moesif is a user behavior analytics platform, you can also filter based on events that a user or company performs. This incluces API calls and custom actions.
Before You Start
Events may take up to 20 minutes to show up in the user analytics screens. If your data has not appeared, make sure you wait until Moesif has completed the instrumentation process and loaded the data.
Create a New Lookup Analysis
You can create a new Lookup analysis in two ways:
From the Create New Dialog
- Log into Moesif Portal.
- Select + Create New in the navigation menu.
- Select Lookup for Users or Companies.
From Users or Companies Screen
- Log into Moesif Portal.
- Select Users or Companies in the navigation menu.
- Select Retention from the dropdown menu.
Example Query
With the Lookup analysis, you can filter users or companies based on properties of a user or company. You can also filter based on events that they have performed within your product. You can add a filter for user or company properties, events properties, or both.
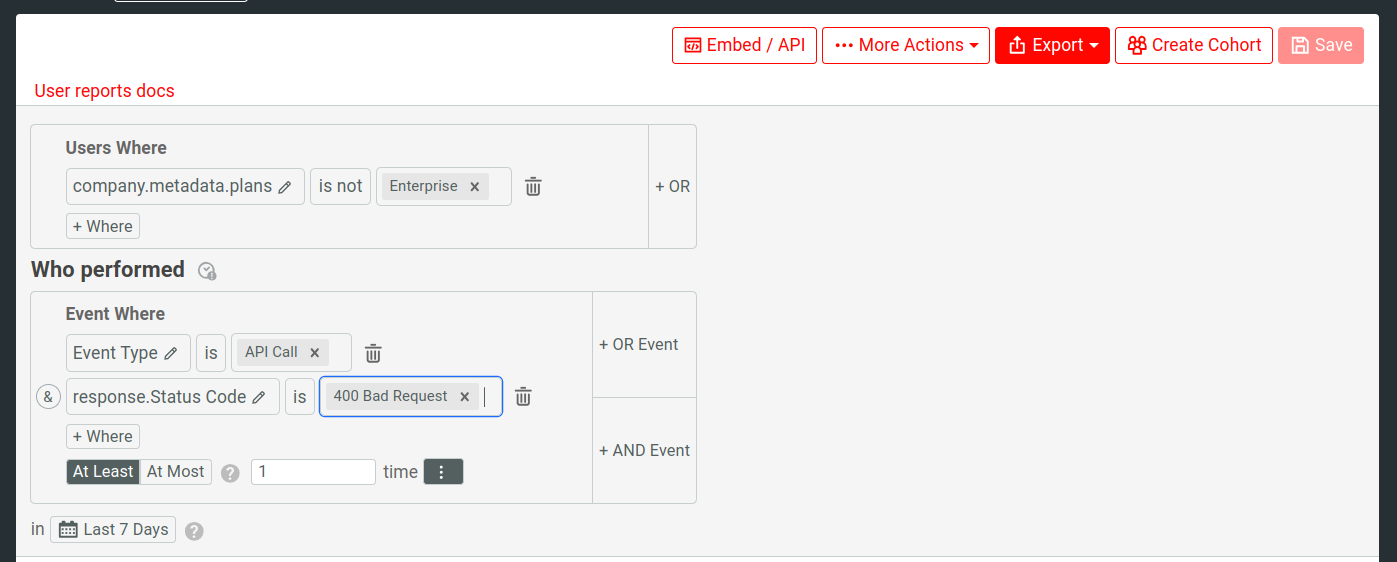
For example, to see all self-service users running into 400 Bad Request error response, you can add two filters:
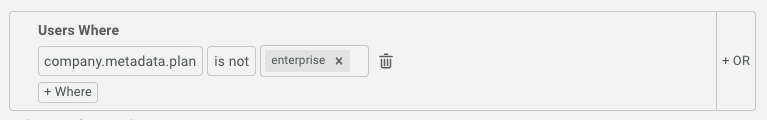
- Users that are not on an enterprise plan. This indicates a custom user property.
- Users who’ve made at least one API call in last seven days, getting a
400 Bad Requesterror response.
Filters
You can refine a Lookup table using filters.
For more information about the available filters in Lookup, see Reference: Analytics Filters.
The following sections discuss some common recipes and examples to demonstrate how to use the filters.
Filtering by User and Company Properties
User or company filters enable you to filter based on customer properties such as email, name, and time of creation. Customer properties are stateful. This means that customer properties can receive updates. Updates can come from yourself
to add customer demographic information or Moesif with information like Last Seen Time.
You can also find your custom user metadata and company metadata here.
You can chain multiple filters together by selecting Where and OR.
Filter by Event Properties
Event filters enable you to filter based on the events a customer has performed. A single user or company may have performed multiple events.
Since events represent something that occurs at a single instance in time, you need to specify the time range—for example, Last 24 hours.
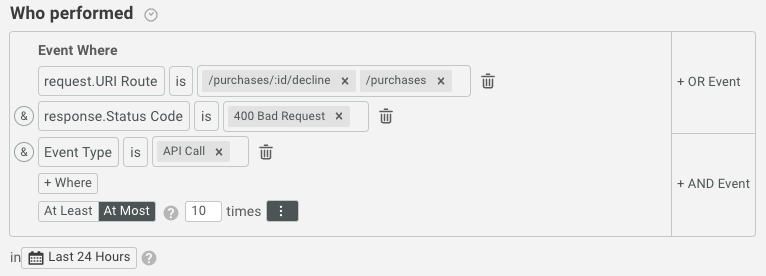
Let’s say we want to look up users with the following criteria:
- At least 10 API calls in the last 24 hours.
- AND the response is
400 Bad Requesterror response. - AND
/purchases/:id/declineOR/purchasesas the route of the API calls.
The query looks like the following:
Event Types
Events can fall into one of two types:
- API Calls
- The requests hitting your servers at various API endpoints such as
GETrequests to the/itemsendpoint. - Actions
- Custom actions triggered by users within your application or UI—for example, a user signing up.
You can filter by these event types by selecting the Event Type filter.
Creating Event Filters
You can think about combining event filters in two ways:
- Customers who performs an event matching both X AND Y, in a single event.
- Customers who performs an event matching X AND an event matching Y. This means multiple events.
Filters within the same group (Moesif outlines the group in a box in the UI) matches against the same event. Separate groups match against separate events.
1. Customers Who Perform an Event Matching Both X AND Y
To find a single event that matches multiple criteria, make sure to keep the properties in the same group. Remember that Moesif outlines the group in a box in the UI.
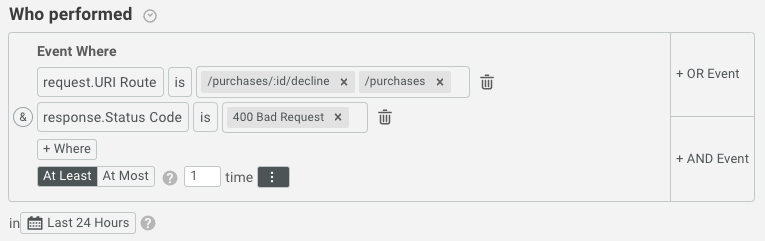
For example, you may want to display all users who made an API call that returned 400 Bad Request error response AND the route of that API call was either /purchases/:id/decline OR /purchases. This means matching multiple properties of the same event. Therefore, the query looks like this:
2. Customers Who Perform Event Matching X AND an Event Matching Y
If you want to match across independent events a user performs, add multiple OR or AND condition boxes. Each filter box then contains the filters for each individual event criteria.
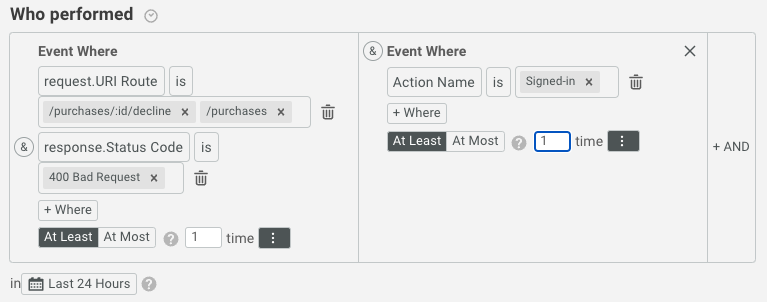
For example, you may want to match against both an API Call and an Action. Let’s say you want to show all users who fall into the following criteria:
- Made API calls to either
/purchases/:id/declineOR/purchases_URI route that returned200 OKresponses. - AND performed a custom action where
Action NameisSigned-In.
The query for this looks like the following:
Event numeric aggregations
Besides equality, event fields also support aggregations such as average, max, or distinct. For example, you can create a cohort of users who accessed your API with over 10 distinct IP Addresses per hour anytime over the last 7 days. This can be done like so:
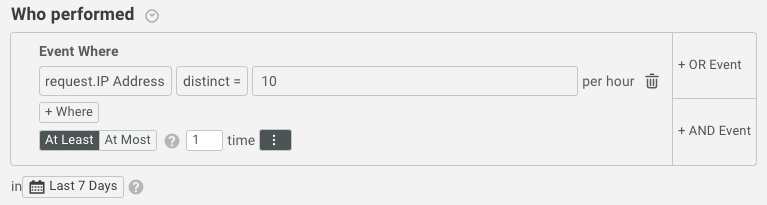
Table Actions
You can perform a variety of actions to a Lookup table.
Select Fields to Display
To display more data fields in a Lookup table, select Select Columns and specify the fields. For example, you can select Request.Geo IP.Country as your custom field. Now in the default Lookup view for each user or company, the country where the request originates from appears.
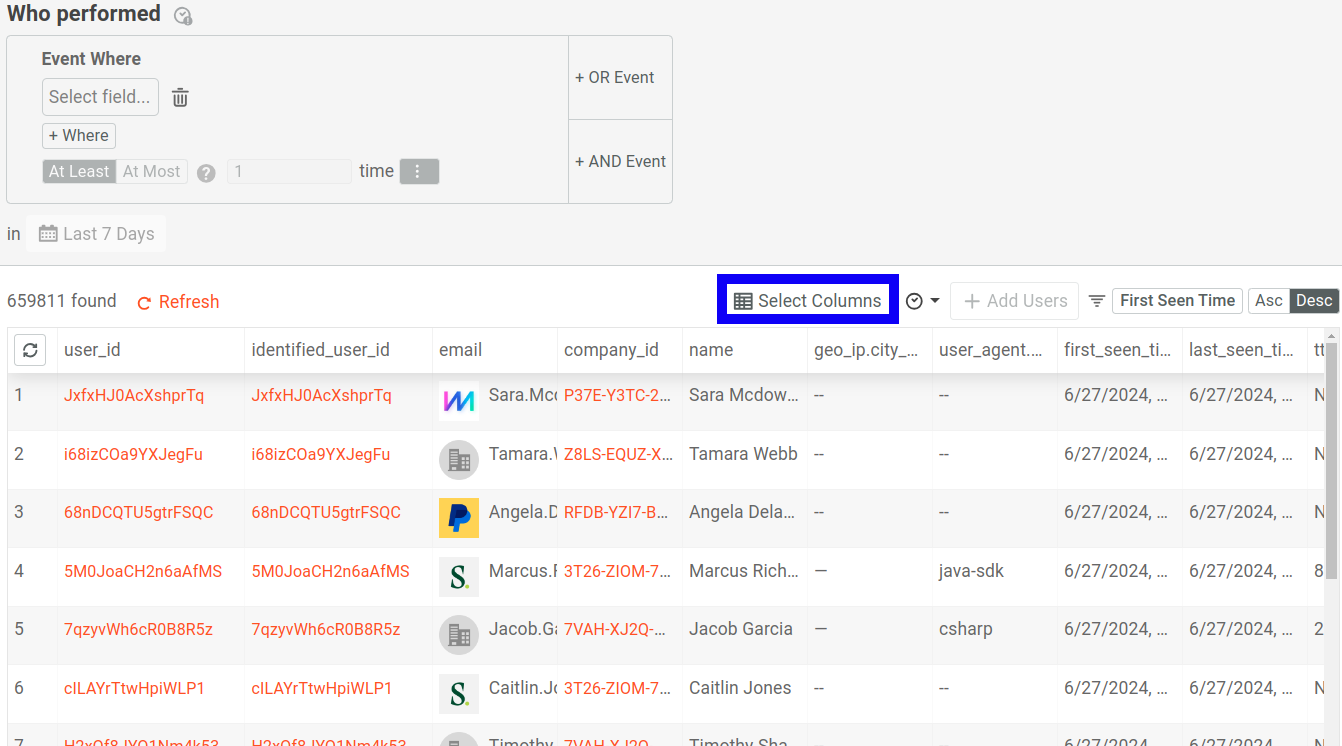
Any columns you add to the table also appears in a bulk export.
Custom Column
You can also add a custom column containing calculated data from the table by selecting Add equation.
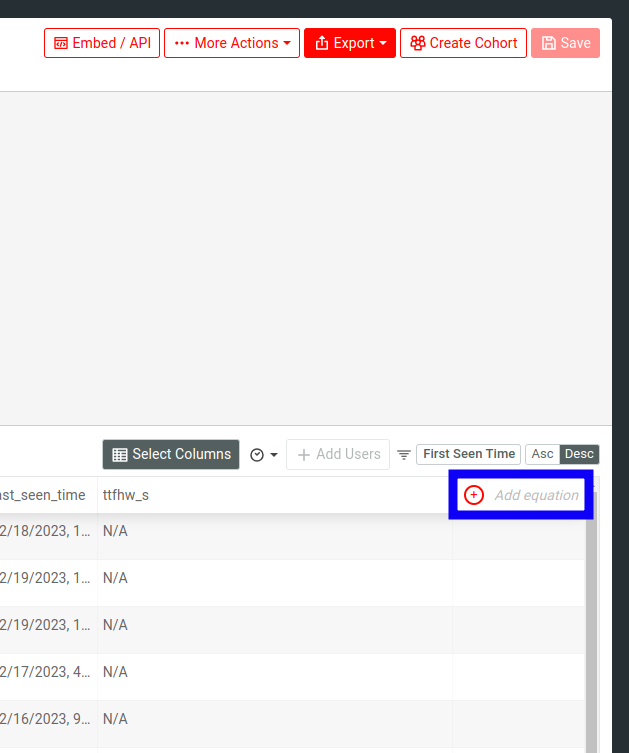
A modal then appears where you need to enter the details of your custom column formula.
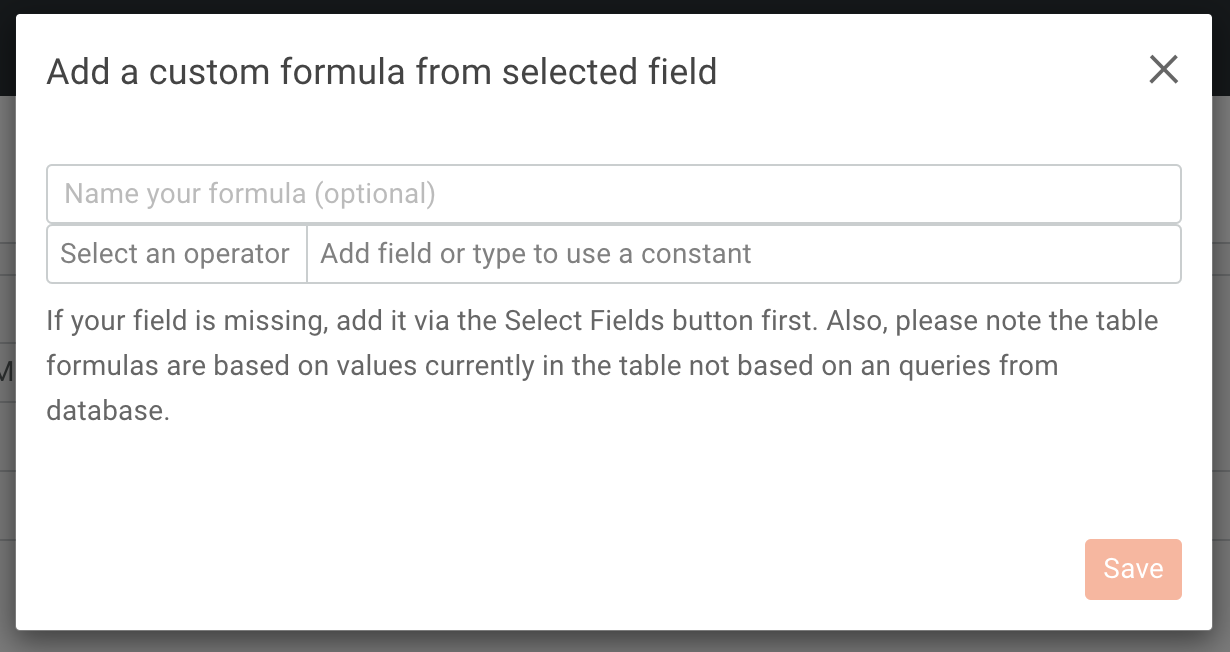
The formula details include the following:
- An optional name for your formula.
- An operator that for the calculation method.
- Fields or constant values as operands.
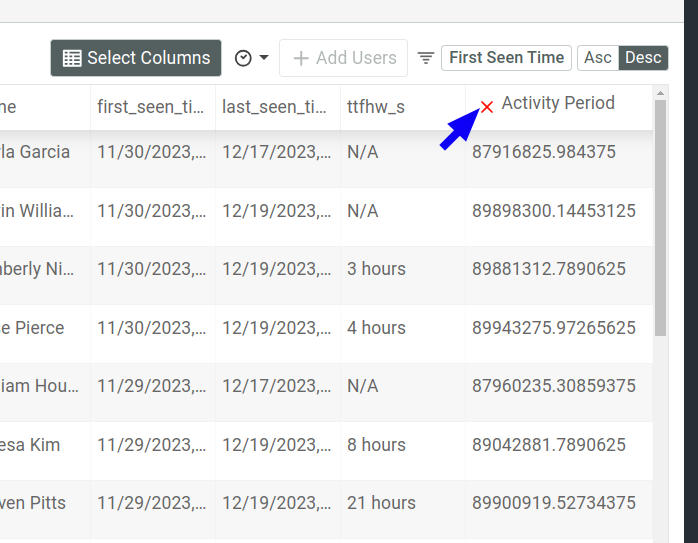
For example, the following formula calculates the difference between the first and the last seen times for customers. This data now appears in the column Activity Period in the Lookup table.
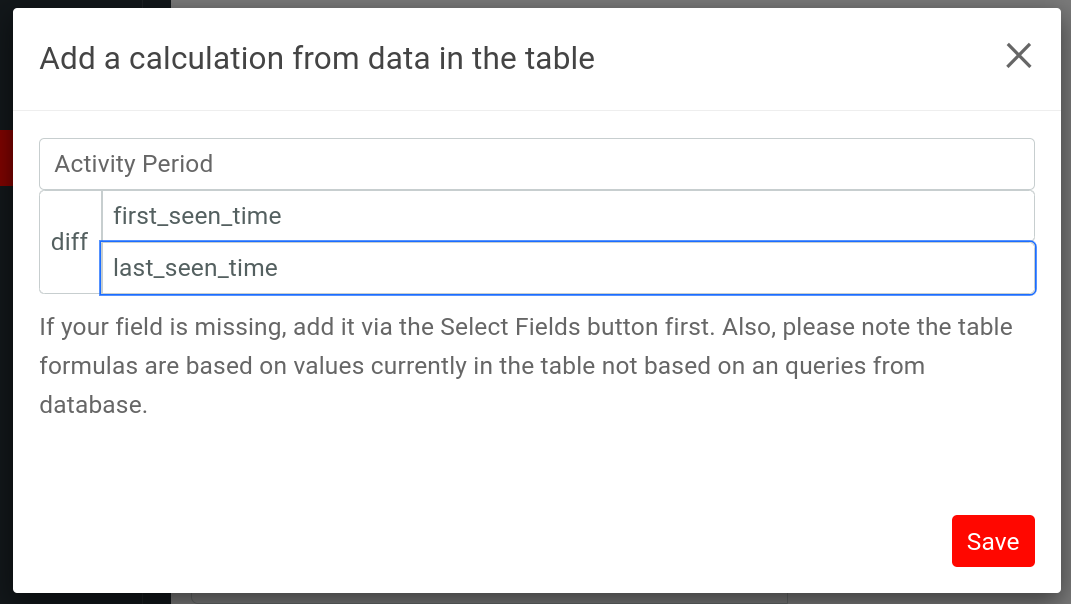
If your field is missing, add it via the Select Fields button first. Also, please note the table formulas are based on values currently in the table not based on an queries from database.
Deleting a Custom Column
To delete a custom column, select X in the column header.
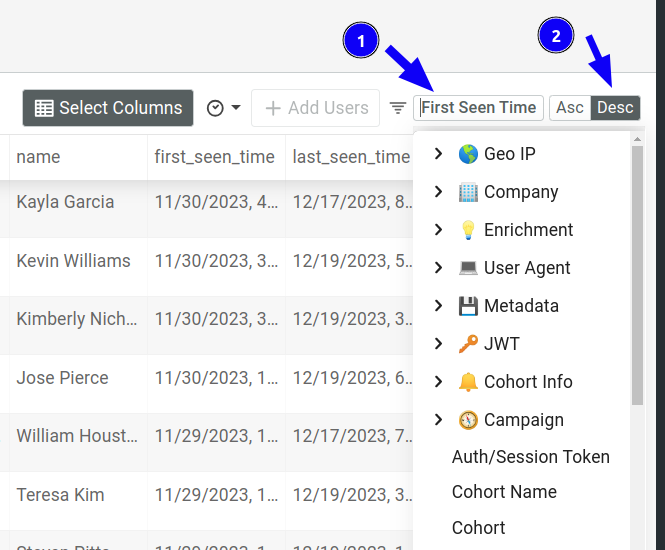
Sorting the Results
- Select the field you want to sort on.
- Select the sort direction, ascending or descending.
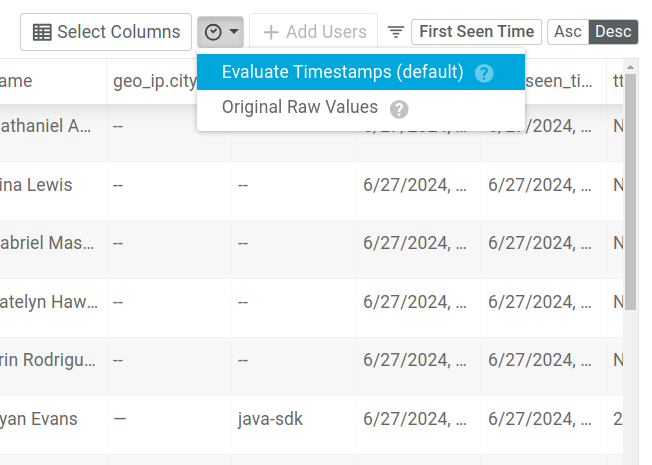
Timestamp Values
In a Lookup table, Moesif parses the timestamps into human-readable format in your timezone. To display the raw timestamp values in ISO 8601 format instead, select Original Raw Values.
Adding New Users or Companies
You can also add new users or companies from the Lookup table screen.
To add new users or companies, select + Add Users or + Add Companies. Select the method of import and then follow the instructions on the page. For example, you can use CSV files to import user or company data.
Creating a User and Company Notification
For each user or company, you can create an alert to trigger whenever a customer meets the desired condition. To create a notification, follow these steps:
- Apply the filters you want for the alert condition.
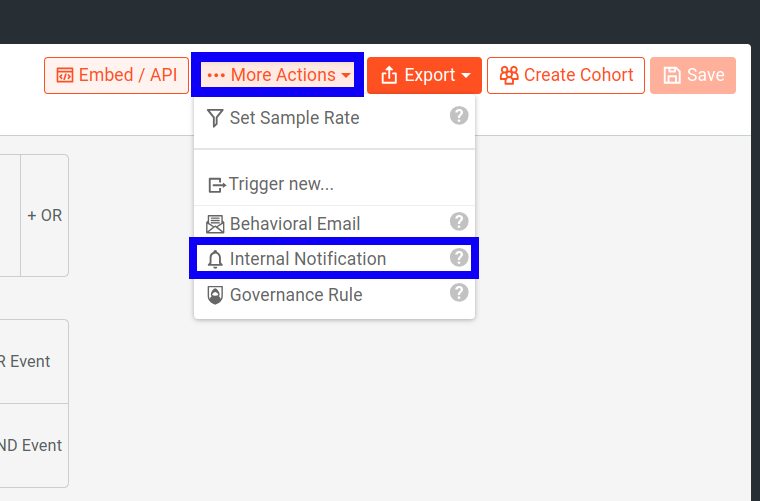
- Select More Actions and then select Internal Notification.
![Selecting the 'Internal Notification' button in a Lookup table]()
- Next, you must create a cohort that defines the alert criteria based on the filters you’ve defined. In the dialog that appears, enter the cohort name and then select Save and Continue.
- In the next dialog, select the notification channel where you want to send the alert notification to. If you use a webhook, copy the sample payload if you need to.
- Select Save.
Create Cohort
Saved cohorts define groups of users based on their properties and events they’ve performed. For example, a cohort that defines users who are exceeding rate limits in the last 24 hours. Think of cohorts like a saved list of users that matches some criteria and one that Moesif continuously updates in automatically.
To save a cohort based on your filters, follow these steps:
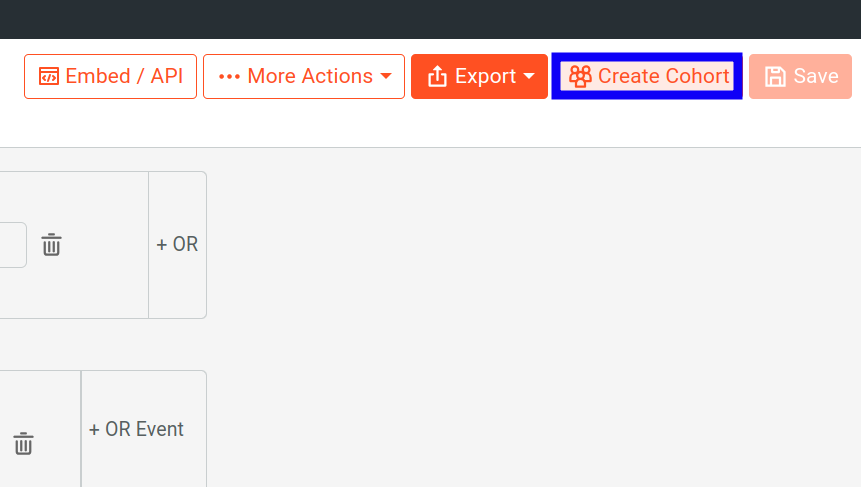
- Select Create Cohort.
!['Create Cohort' button in Lookup analysis]()
- Enter the cohort name.
- Select Create Cohort.
After creating a cohort, you can target the cohort with Moesif’s automation features like triggering behavioral emails and dynamically sampling customers.
Creating a Sample Rate for a Cohort
To set a sample rate from the User Lookup screen, follow these steps:
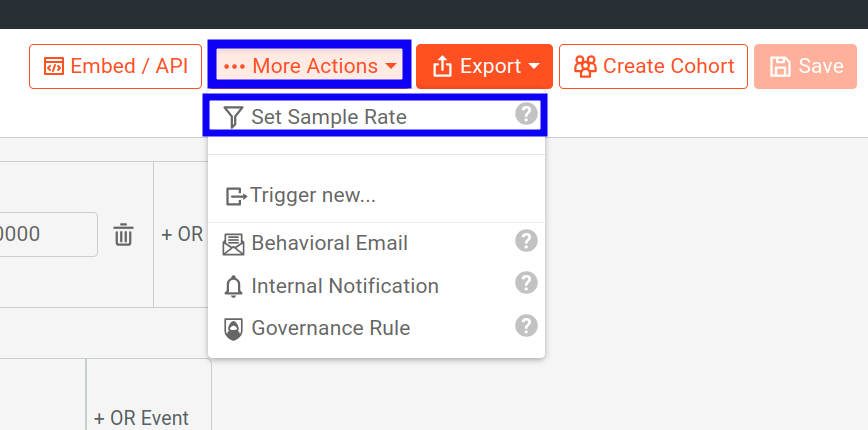
- Select More Actions and then select Set Sample Rate.
![example]()
- In the dialog that appears, create a cohort for the sample rate.
- In the Add User Sampling Rule dialog, set the Sample Rate and Priority for the sampling rule.
- Select Save.
For more information, see Dynamic Sampling.
Save and Share
Moesif gives you several options to share a Lookup workspace. Before you can share, you must first save the workspace to a dashboard.
After saving, follow the instructions in Sharing Workspaces to share your workspace.