Introducing Moesif Basic Insights for WSO2 API Manager (APIM) and Bijira
One of the principals of Moesif’s efforts has been making API analytics more accessible and easier to use for everyone. We have helped enterprises of different sizes and use cases grow and succeed with their API and AI products through data-backed insights. With Moesif, teams of assorted expertise feel empowered to gain deeper understanding of their product, customers, and the overarching market; consequently, every stakeholder can contribute to shared business goals through more effective teamworks.
As the next step towards realizing that vision, we are launching Moesif Basic Insights—a limited version of Moesif available to all WSO2 API Manager and Bijira customers.

What is Moesif Basic Insights?
Moesif Basic Insights is a free, lightweight version of the Moesif platform. It is included as part of a valid WSO2 subscription to the following WSO2 products:
- WSO2 API Manager
- Bijira
You can access Moesif Basic Insights for Bijira in the standalone web app at https://moesif.com/moesif-basic. If you’re using WSO2 API Manager, you can access it from the left sidebar.
Why We Have Built Moesif Basic Insights for WSO2
An API ecosystem built with WSO2 API Manager or Bijira possesses APIs, apps, and customers that generate millions of data points. Now WSO2 customers can effectively leverage that data through Moesif. Moesif Basic Insights provides a frictionless and integrated API analytics experience that comes included with your WSO2 API Manager and Bijira plan, requiring no complex setup or instrumentation.
What You Can Achieve: Available Features
Moesif Basic Insights resembles the WSO2 analytics architecture and organizes all the features into these components:
- Inbound Analytics: Analytics for requests and data between the user and API Proxy
- Outbound Analytics: Analytics for requests and data between the API Proxy and the backend service
- AI Analytics: Outbound analytics purpose-built for AI APIs
- Alerting: Alert history and creation of new alert rules
The following sections go over the features and analytics available in these components in WSO2 API Manager and Bijira across your APIs and applications.
Analytics Overview
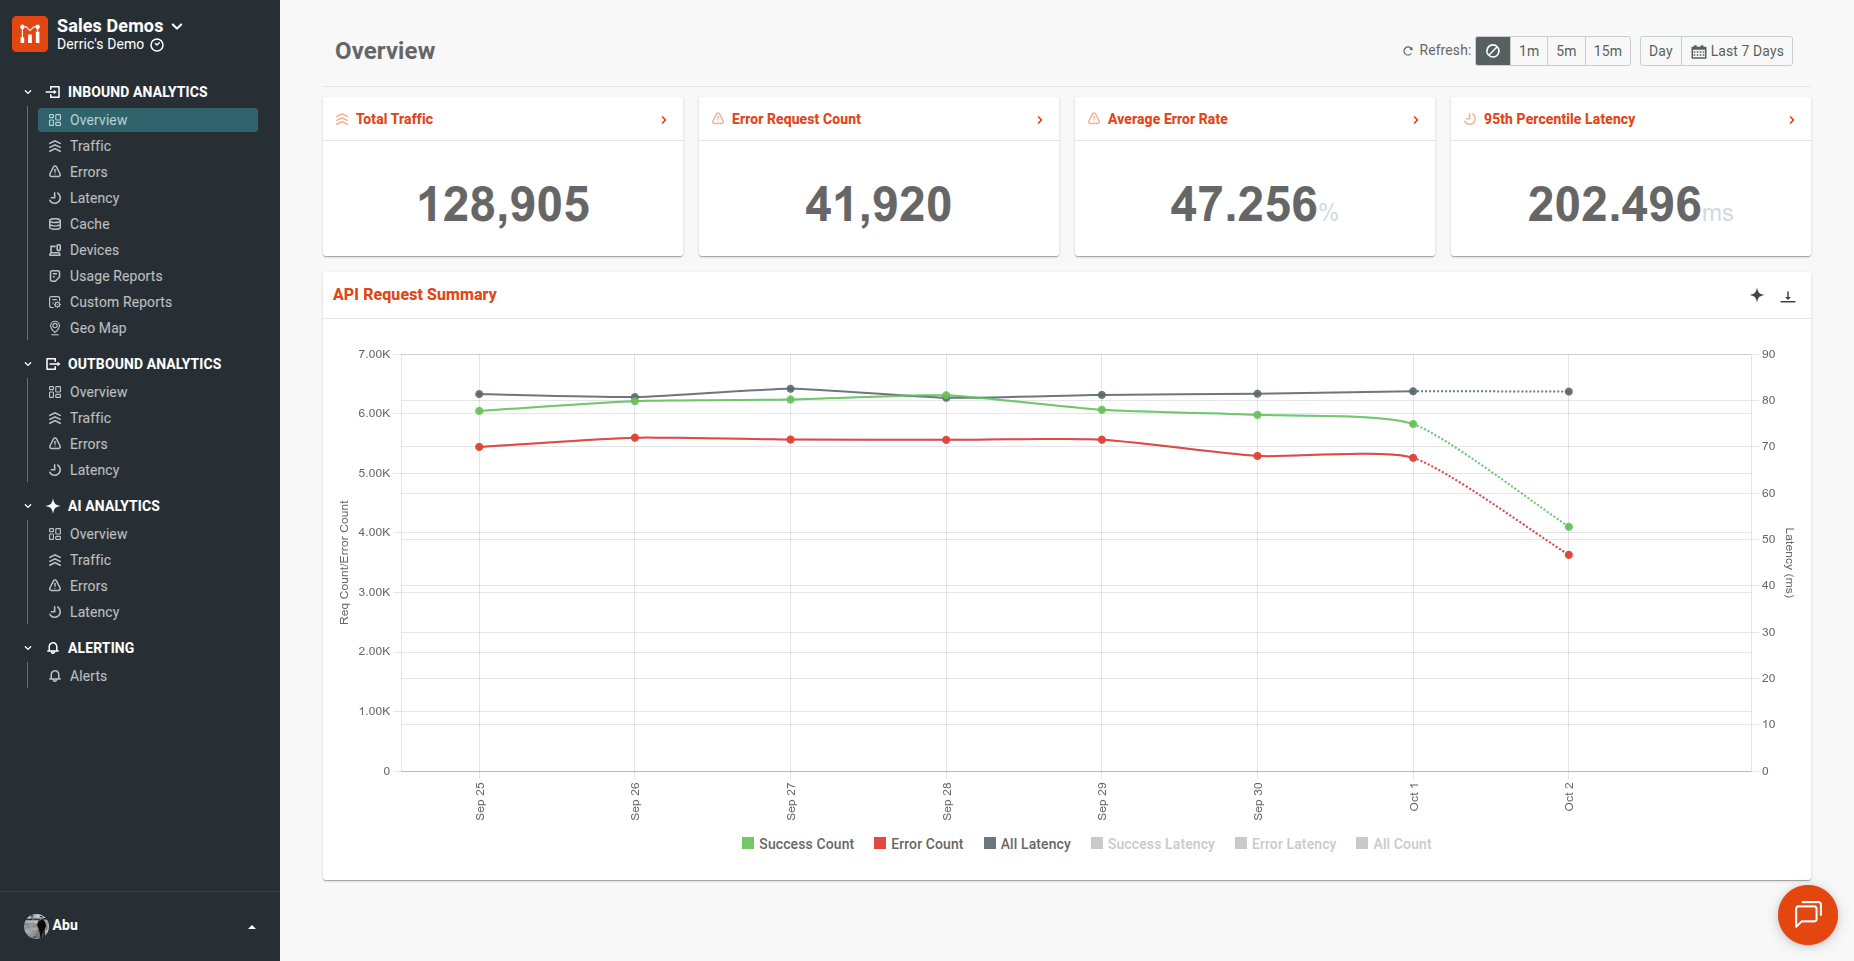
The Overview panel in Inbound Analytics, Outbound Analytics, and AI Analytics contains a rundown of your API’s usage across different criteria:
Inbound and Outbound Analytics
- Total traffic
- Error request count
- Average error rate
- 95th percentile latency
- Time series visualization of request count and error count ratio with latency
AI Analytics
- Total traffic
- Error request count
- Average error rate
- 95th percentile latency
- Token usage statistics:
- Total token
- Prompt token
- Completion token
- Time series visualization of request count and error count ratio with latency
Understanding API Traffic
The Traffic panel contains API traffic statistics:
Inbound Analytics
- API usage over time
- API usage by Application
- API usage by Target, where Target is the the target endpoint for an API proxy
- API resource usage summary
Outbound Analytics
- Target usage over time
- Application usage over time
- Target usage summary
AI Analytics
- Vendor usage over time
- Application usage over time
- Token usage distribution across total, prompt, and completion tokens usage
- Token usage over time, classifiable by total, prompt, and completion token types
- Summary of average token usage by vendor
- Vendor usage summary
These metrics provide insights like:
- APIs and applications driving the most traffic
- Peak usage hours
- Most popular API resources, AI features, and vendors
Identifying and Troubleshooting API Errors
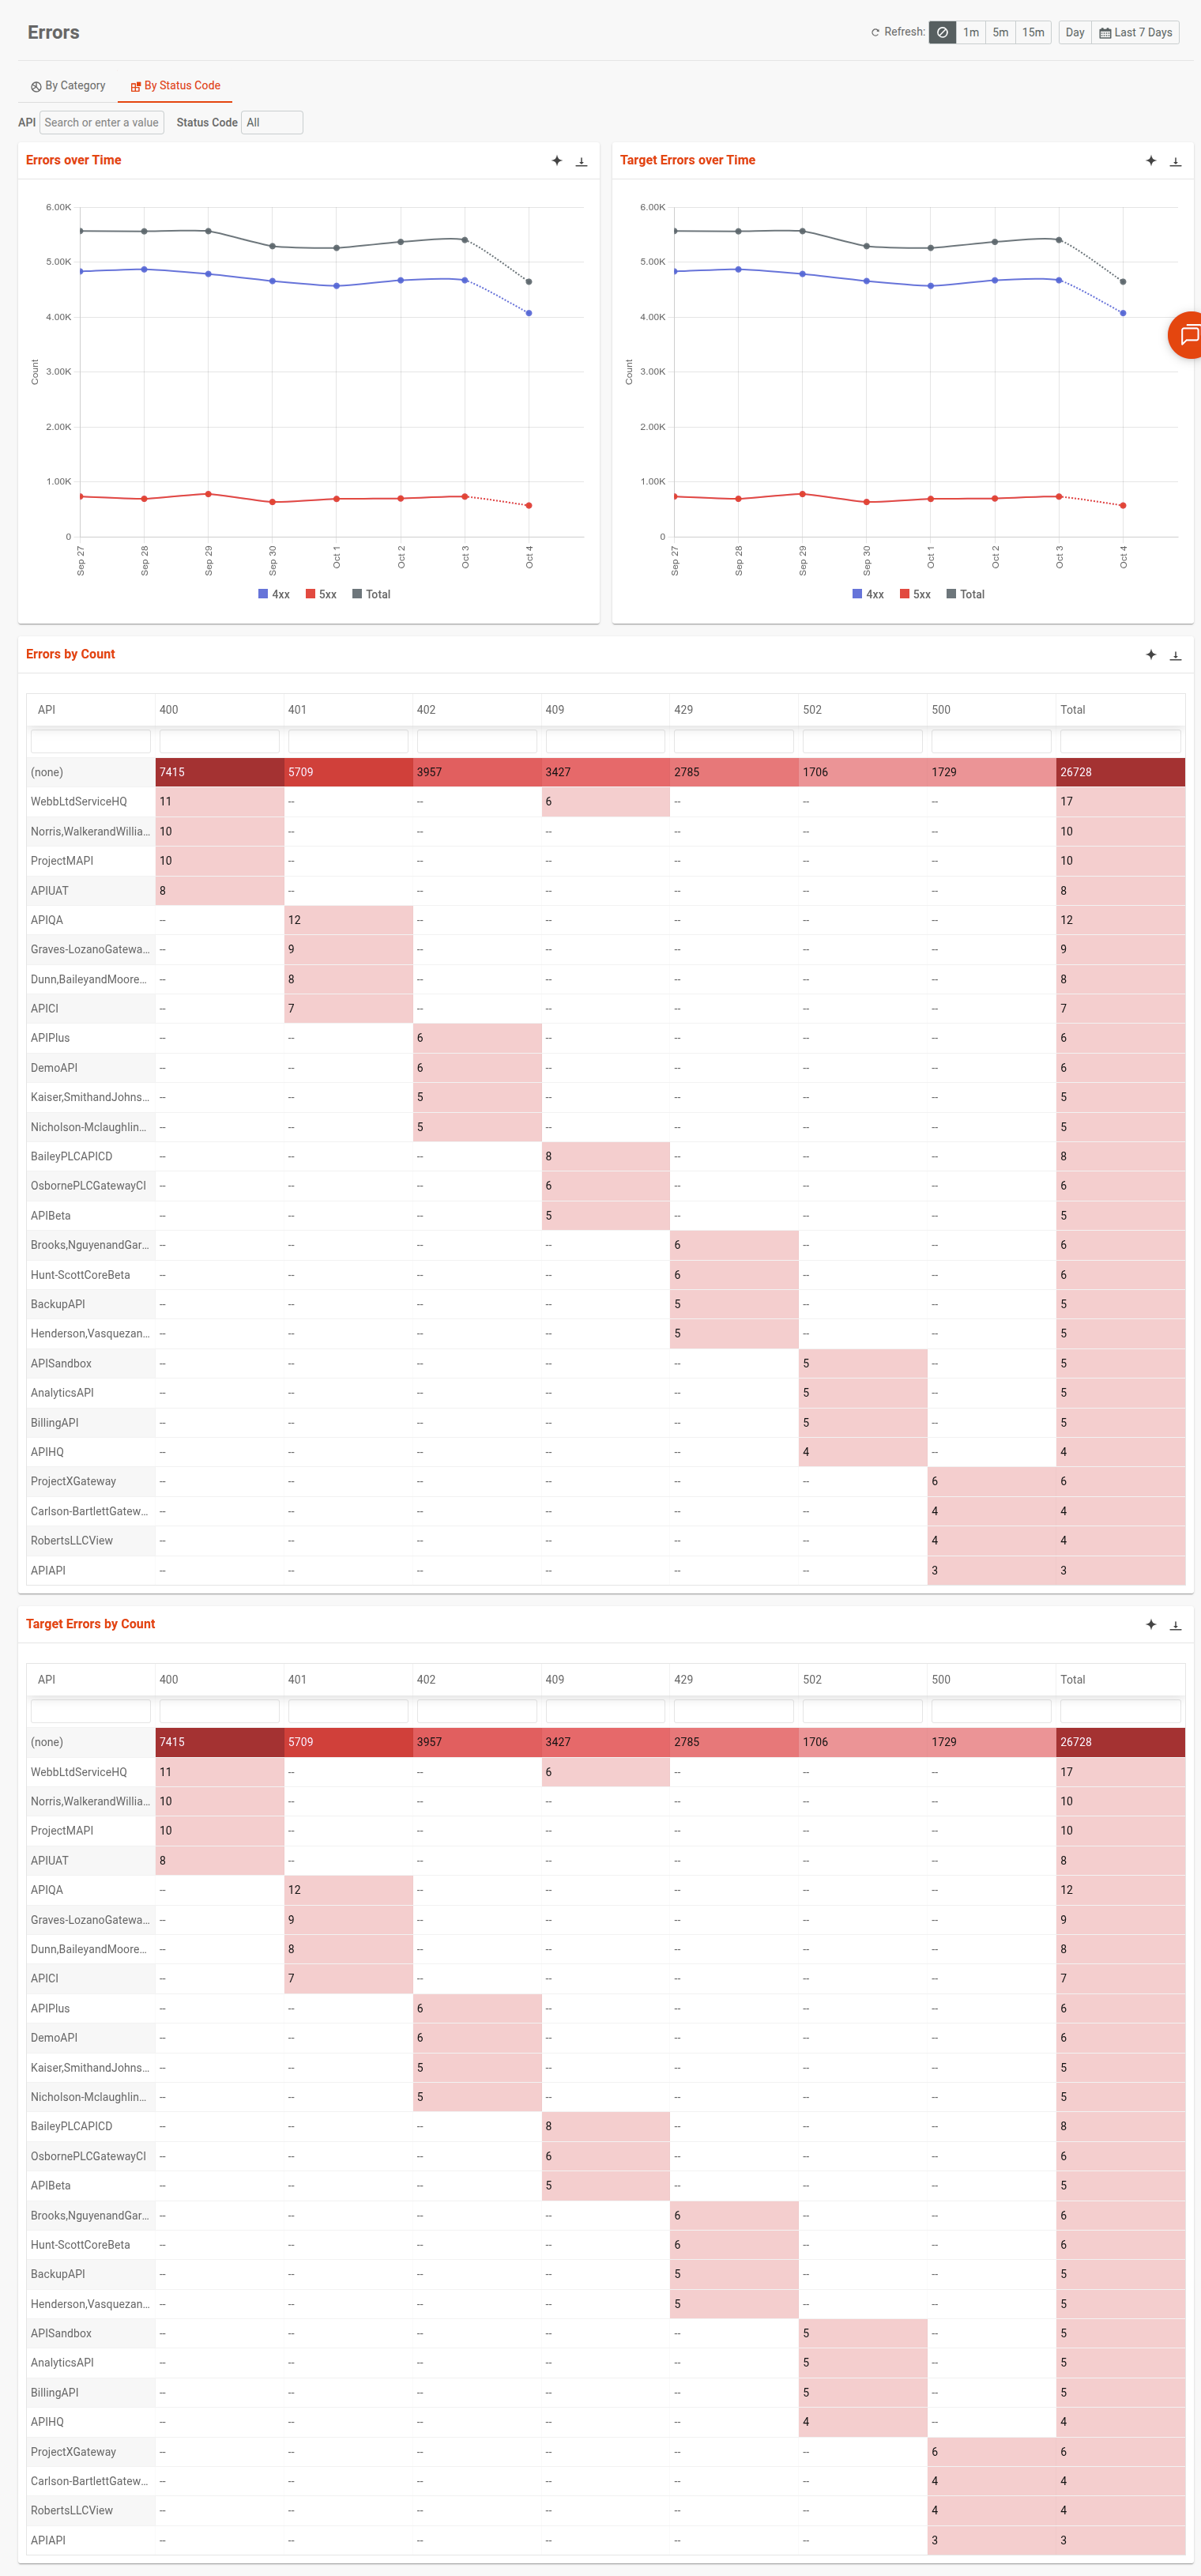
The Errors panel in Inbound, Outbound, and AI analytics shows API error statistics across existing APIs. It gives you an immediate, high-level observation of your API’s health. You can break errors down and visualize them by API, categories such as authentication and throttling, and status code.
The following Inbound Analytics illustrates errors by status codes :
Identifying and Investigating Performance Bottlenecks
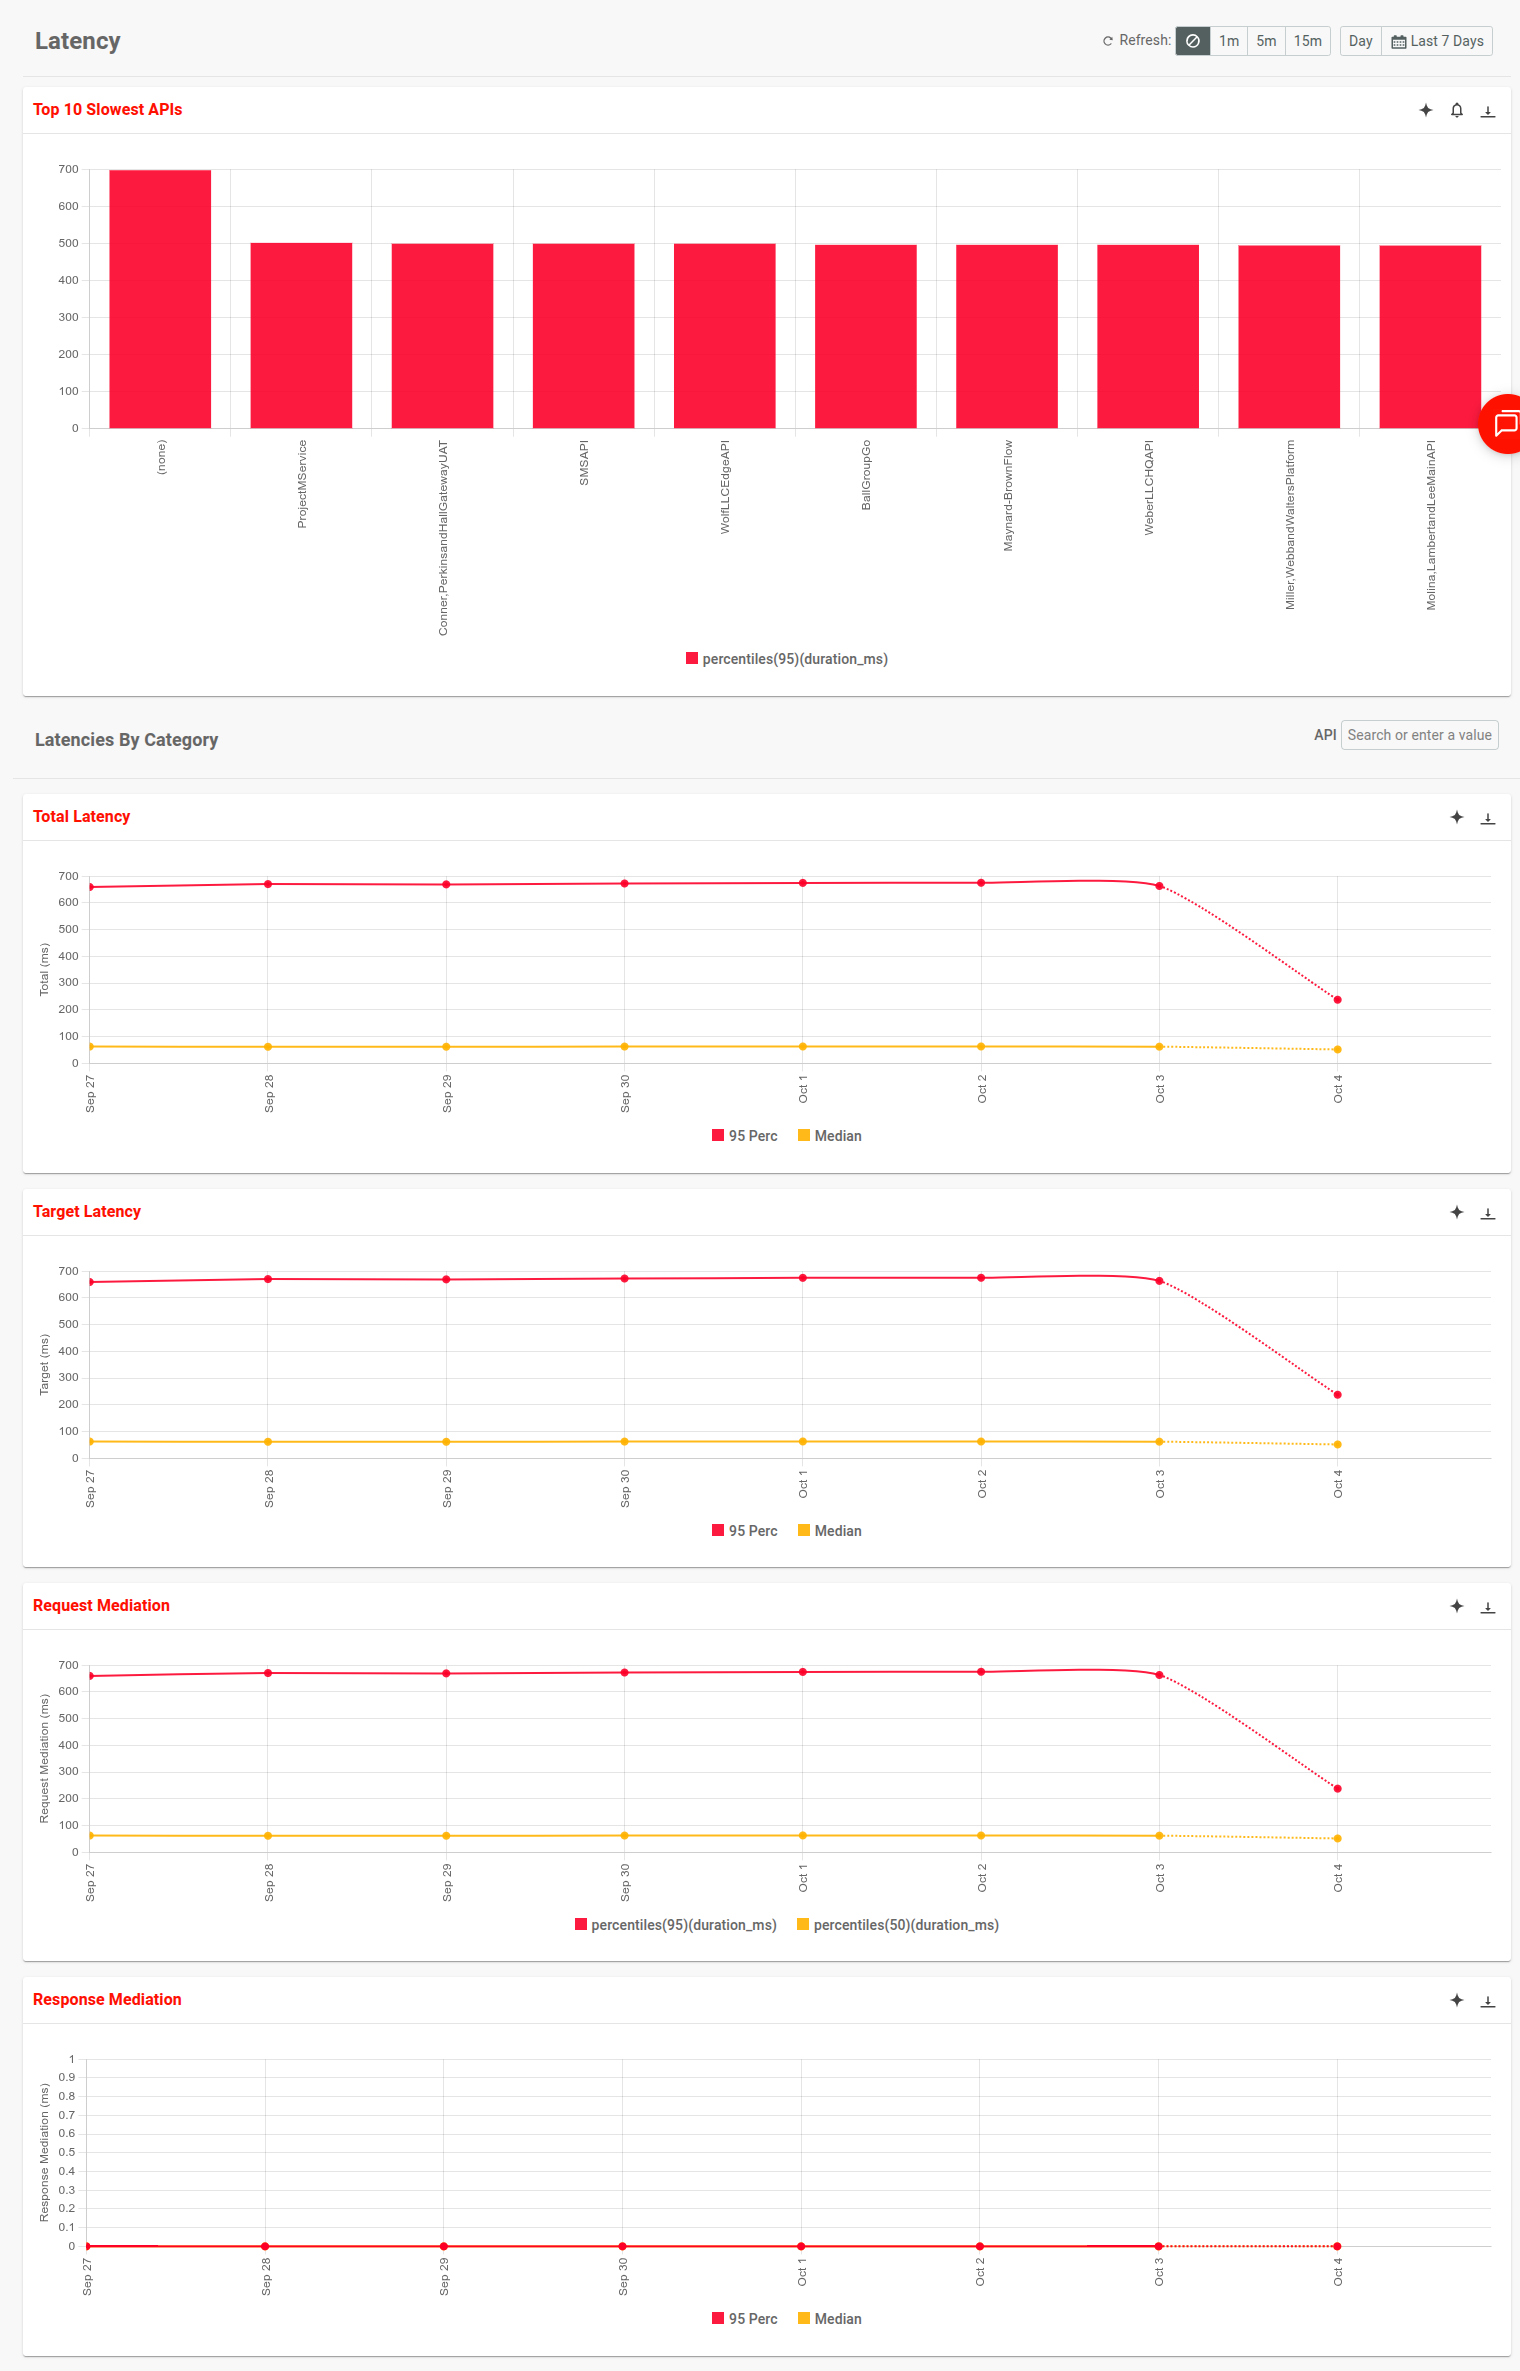
The Latency panel in Inbound, Outbound, and AI analytics contains insights about your API’s performance by calculating 95th percentile latencies. It allows you to identify services that are performing poorly and provides breakdown of latency in different criteria.
Here’s an example of various latency statistics in Inbound Analytics:
Identifying Top Platforms and Devices
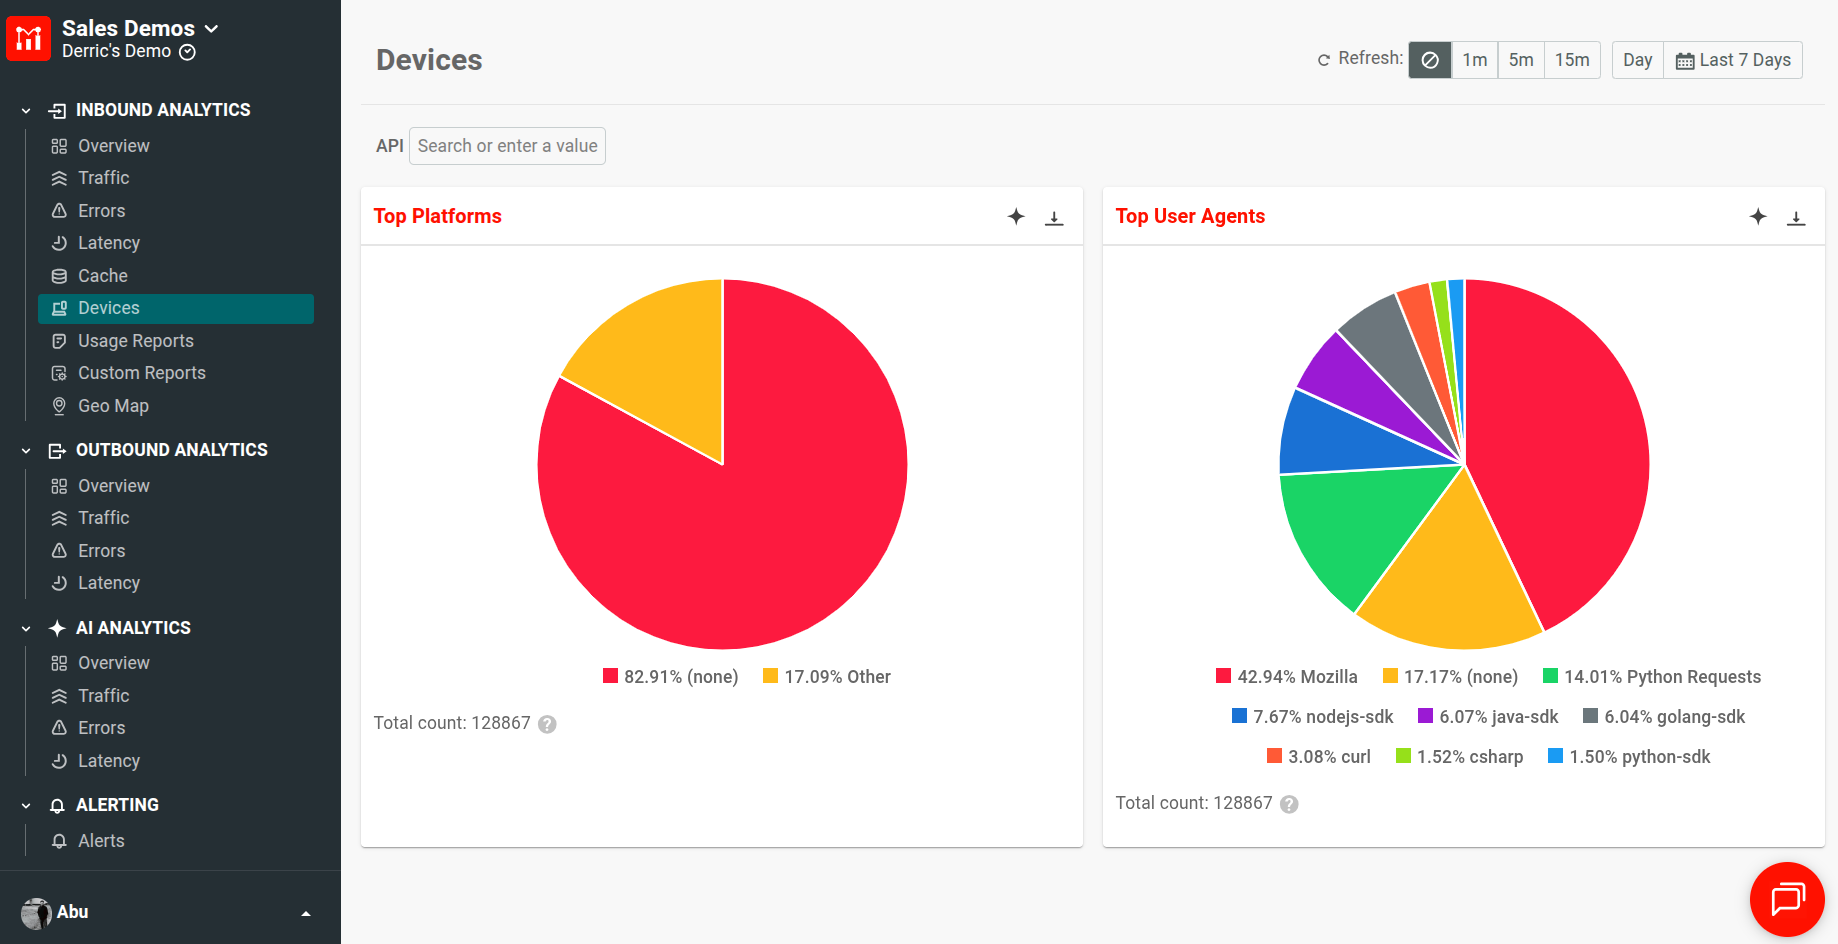
The Devices panel in Inbound Analytics illustrates the top platforms and user agents so you can keep abreast of the technology your customers use. It helps you make informed product decisions, like whether to build new SDKs or developer tools.
Alerts
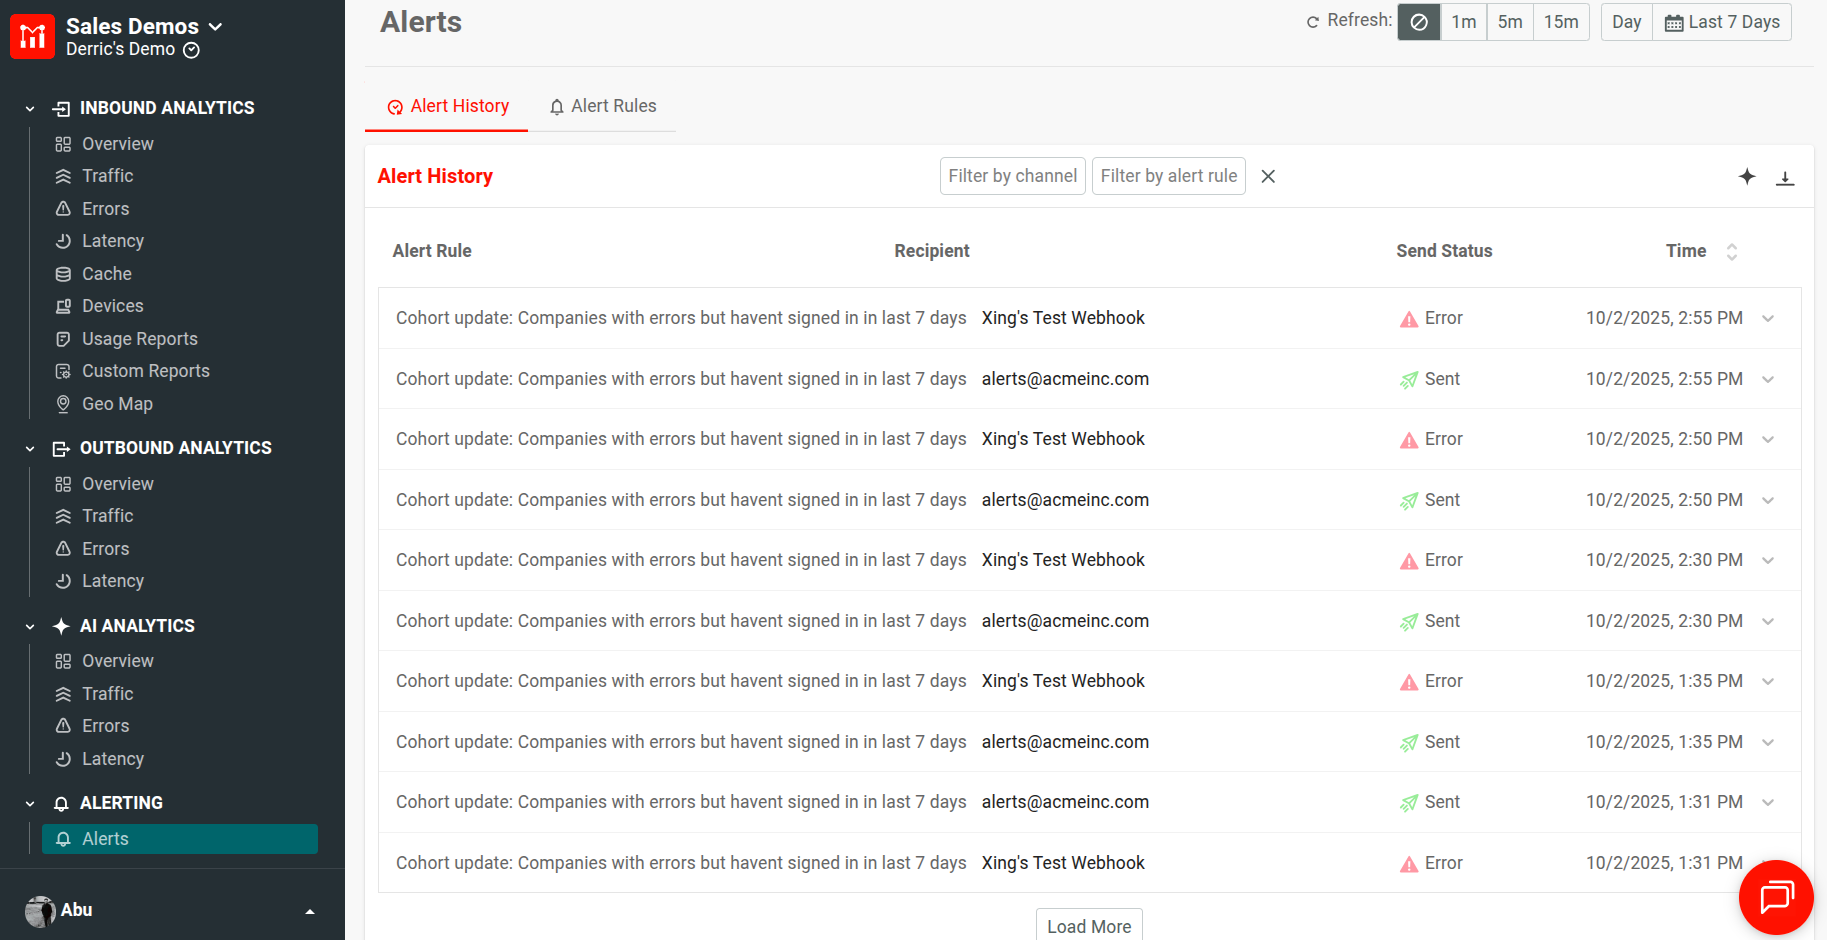
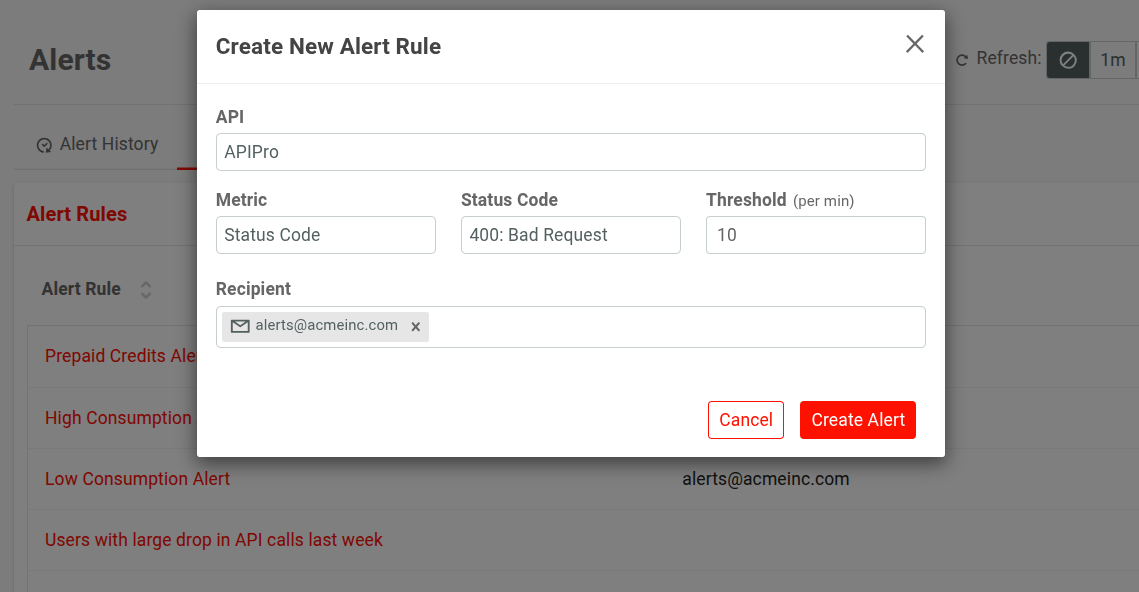
Alerts help you stay ahead of issues and proactively take measures for better customer experiences. The Alerts panel in Alerting shows details about existing alert rules as well as the history of triggered alerts. The preserved history helps track incident patterns over time.
You can also create and configure new alerts in the Alert Rules tab.
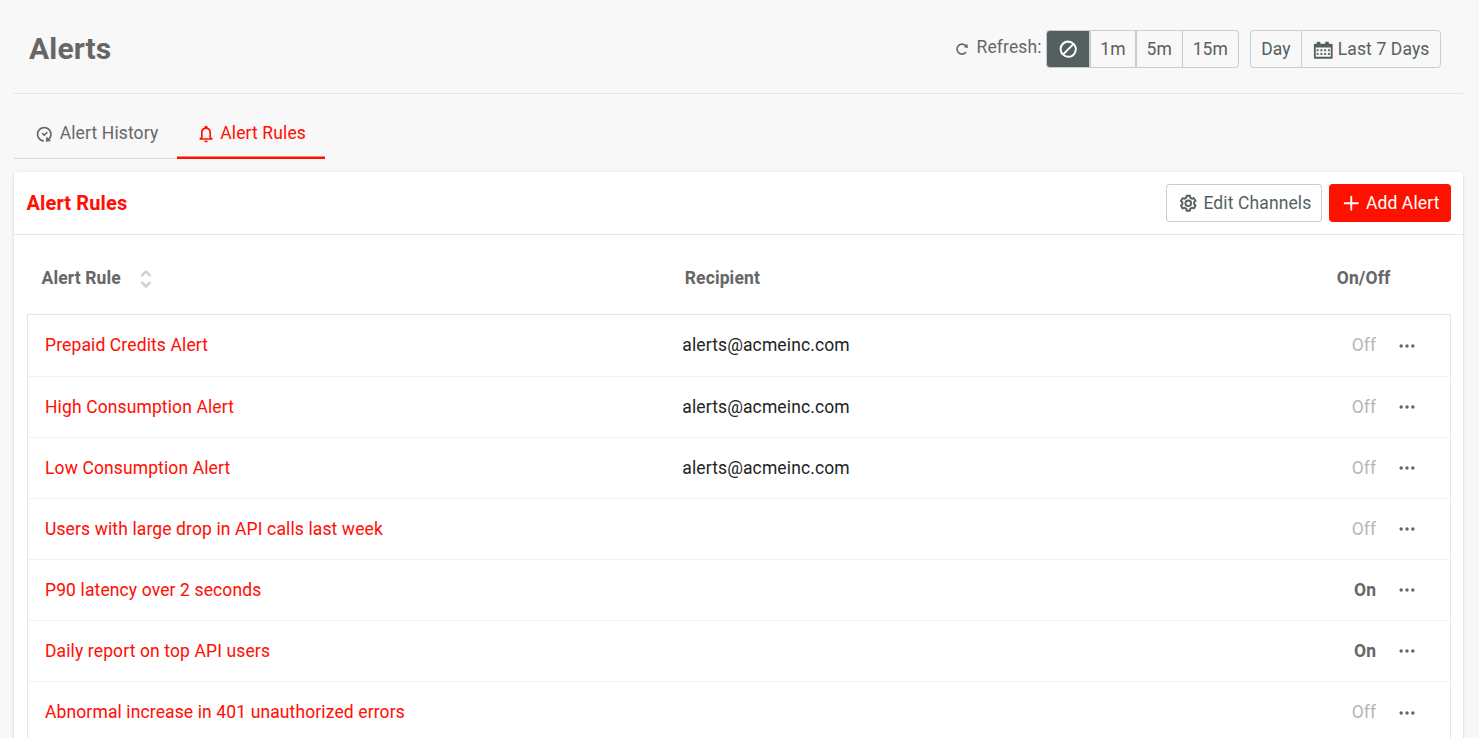
Alerts notify automatically when API exceeds a specified threshold of a metric; for example, too many 400 Bad Request errors. You can also specify where alert notifications should be dispatched to.
Usage Reports
To help demonstrate the value and health of your API program and keep everyone informed, the Usage Reports panel allows you to download usage reports:
- The Monthly Reports tab allows you to download monthly reports.
- In the Report Generator tab, you can specify the following criteria to generate and download reports:
- The API
- The applications or API consumers
- The time period.

The Custom Reports panel allows further customization for generating reports where you can define the categories and metrics to plot. For example, the following custom report breaks down backend latency across applications:

Usage reports frees teams from the inconvenience of manually creating reports or spreadsheets, making communication easier among stakeholders and justifying future investments.
Geographic Heatmaps
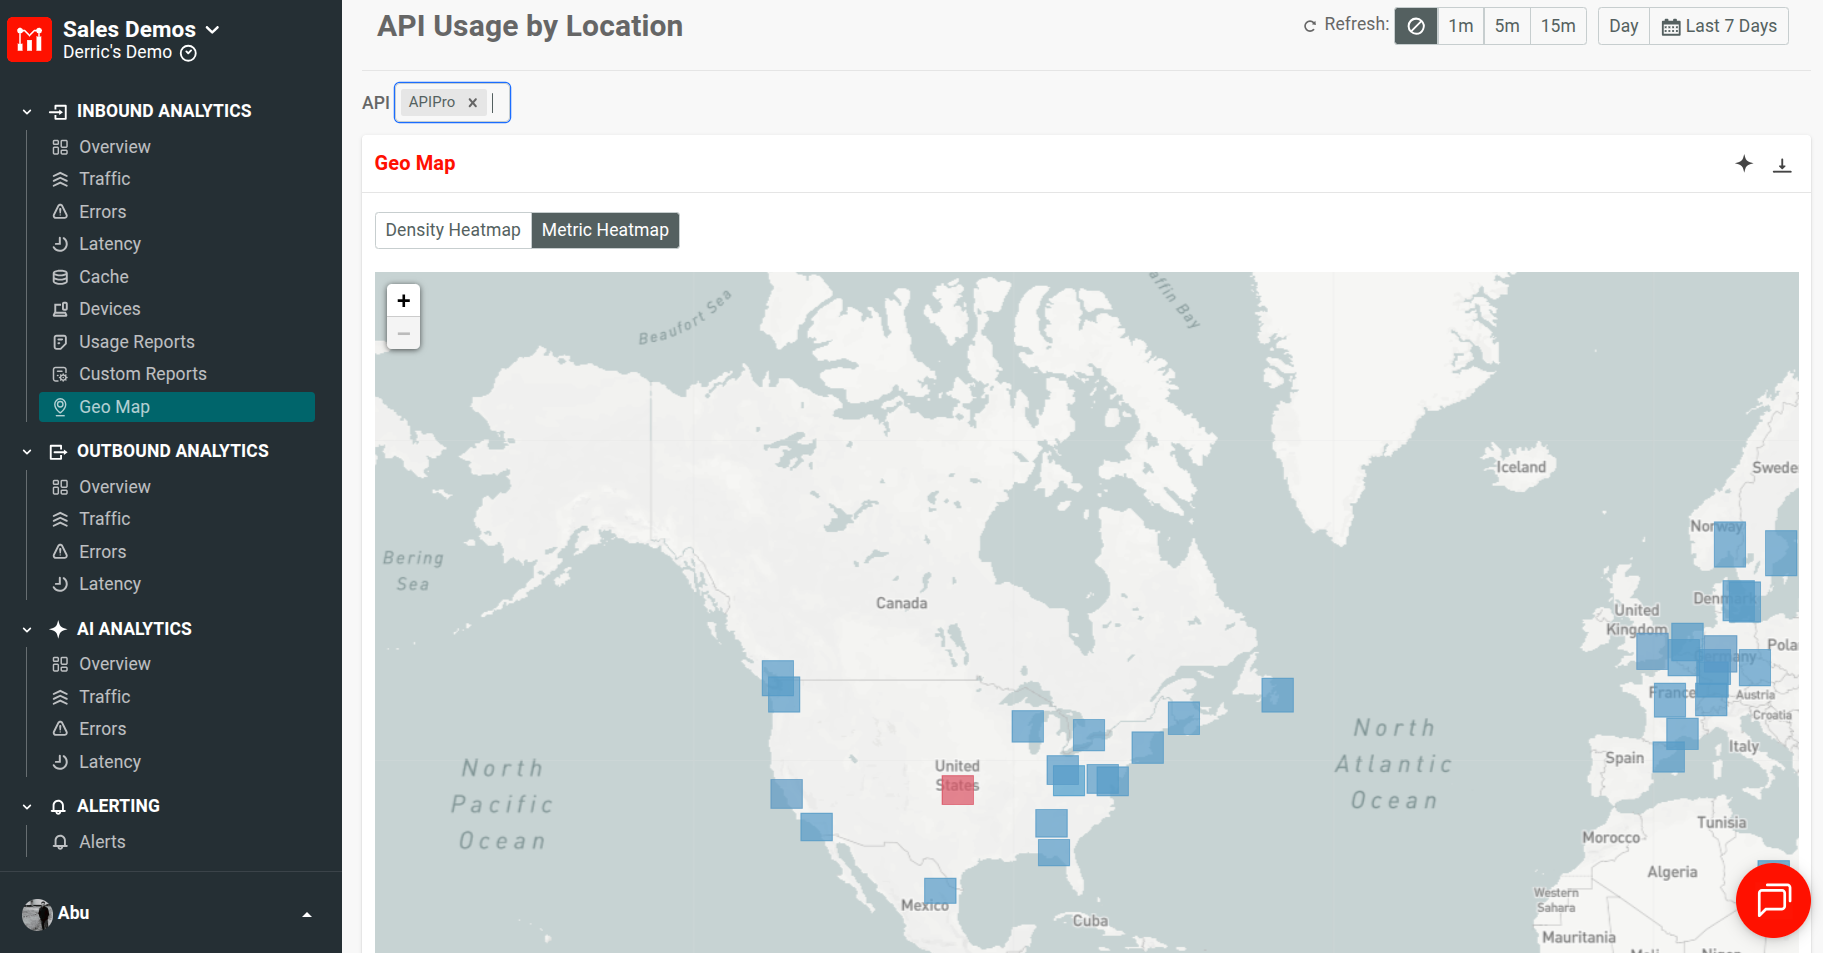
Geographic heatmaps can supplement insights into your product, customers, and how both correlate when geographic location plays an important role in your product and analytics requirements. Using the Geo Map panel in Inbound Analytics, you can analyze API usage by location through two heatmap types:
- Density heatmap
- Metric heatmap
Get Started
To get started with Moesif Basic Insights in WSO2 API Manager and Bijira, follow these steps:
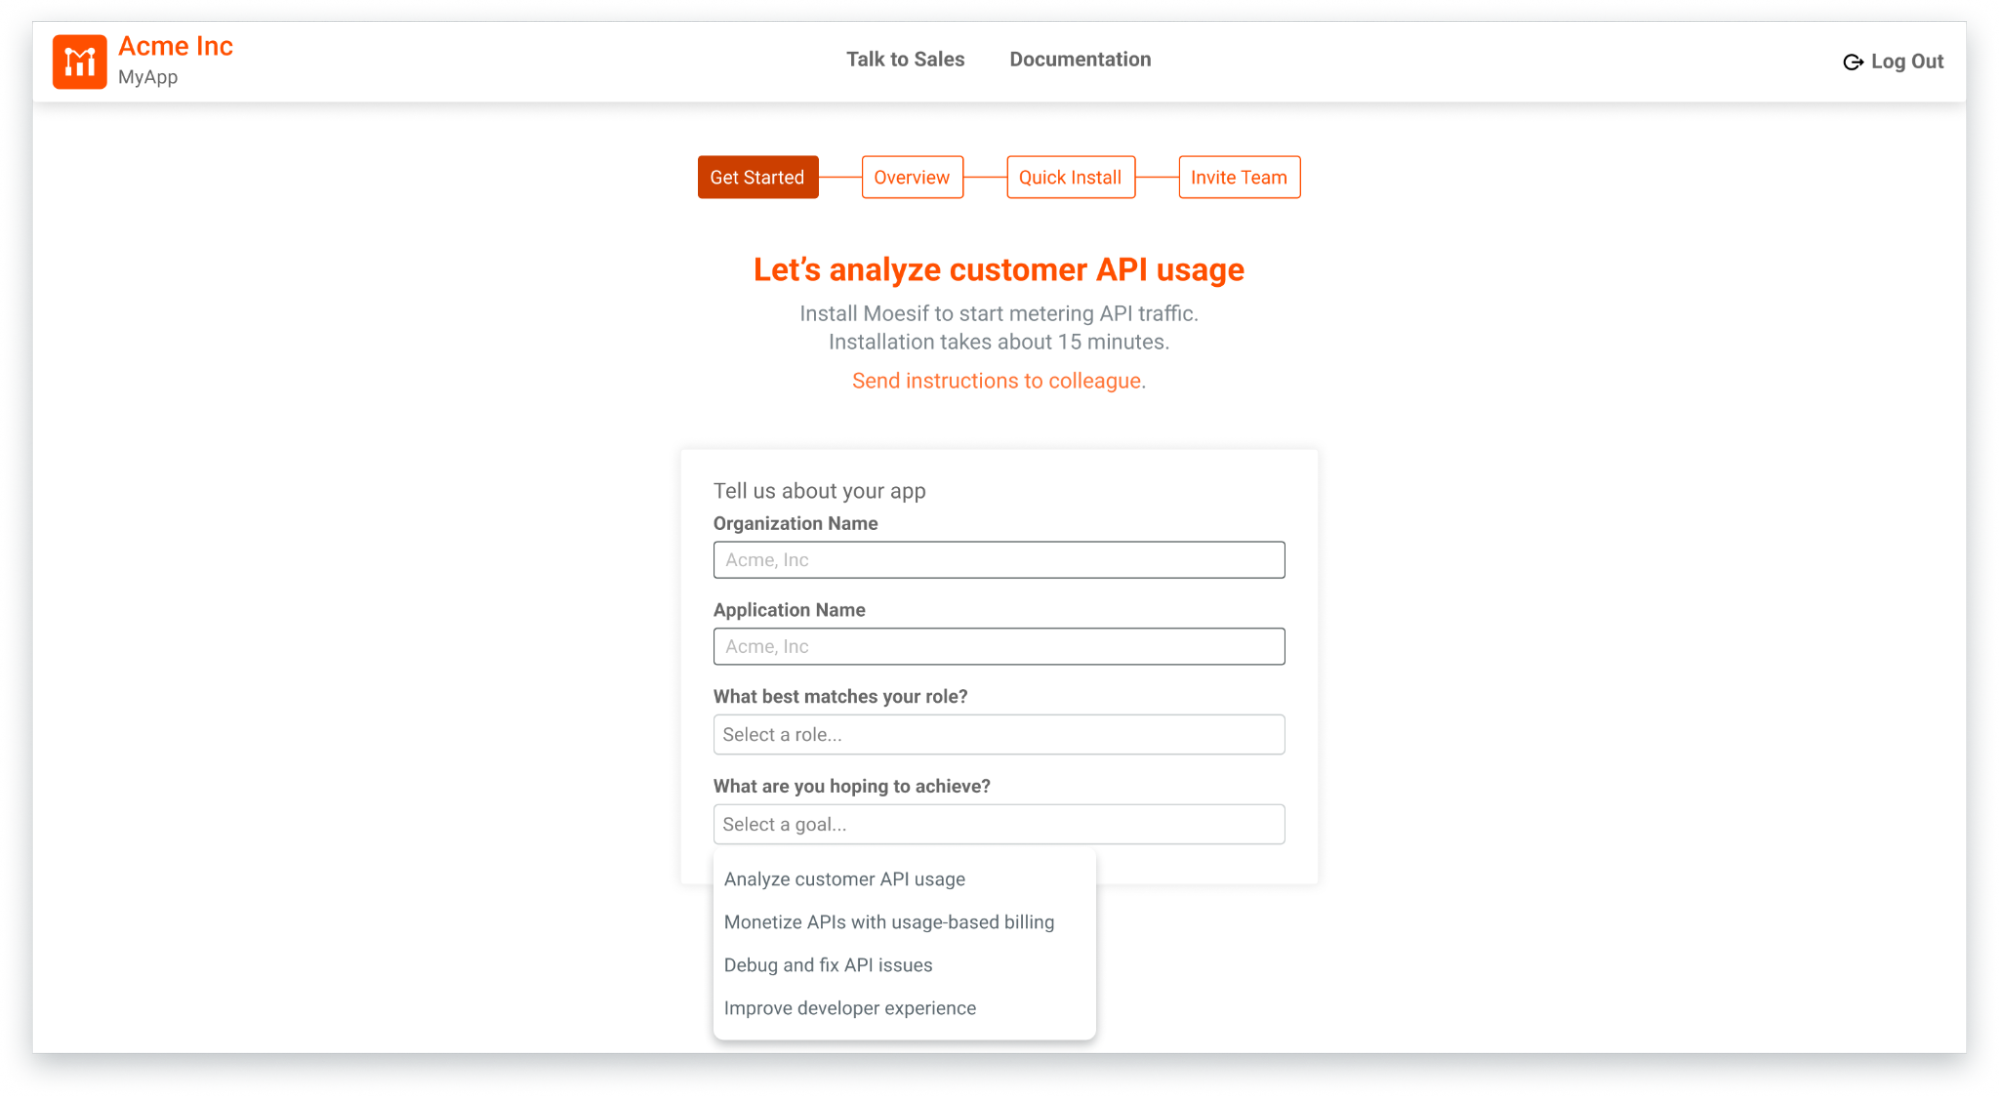
- Go to Moesif Basic Insights web app and sign up. Then follow along the onboarding process.
![Sign-up and onboarding screen in Moesif Basic Insights. Onboarding screen in Moesif Basic Insights during first-time sign-up.]()
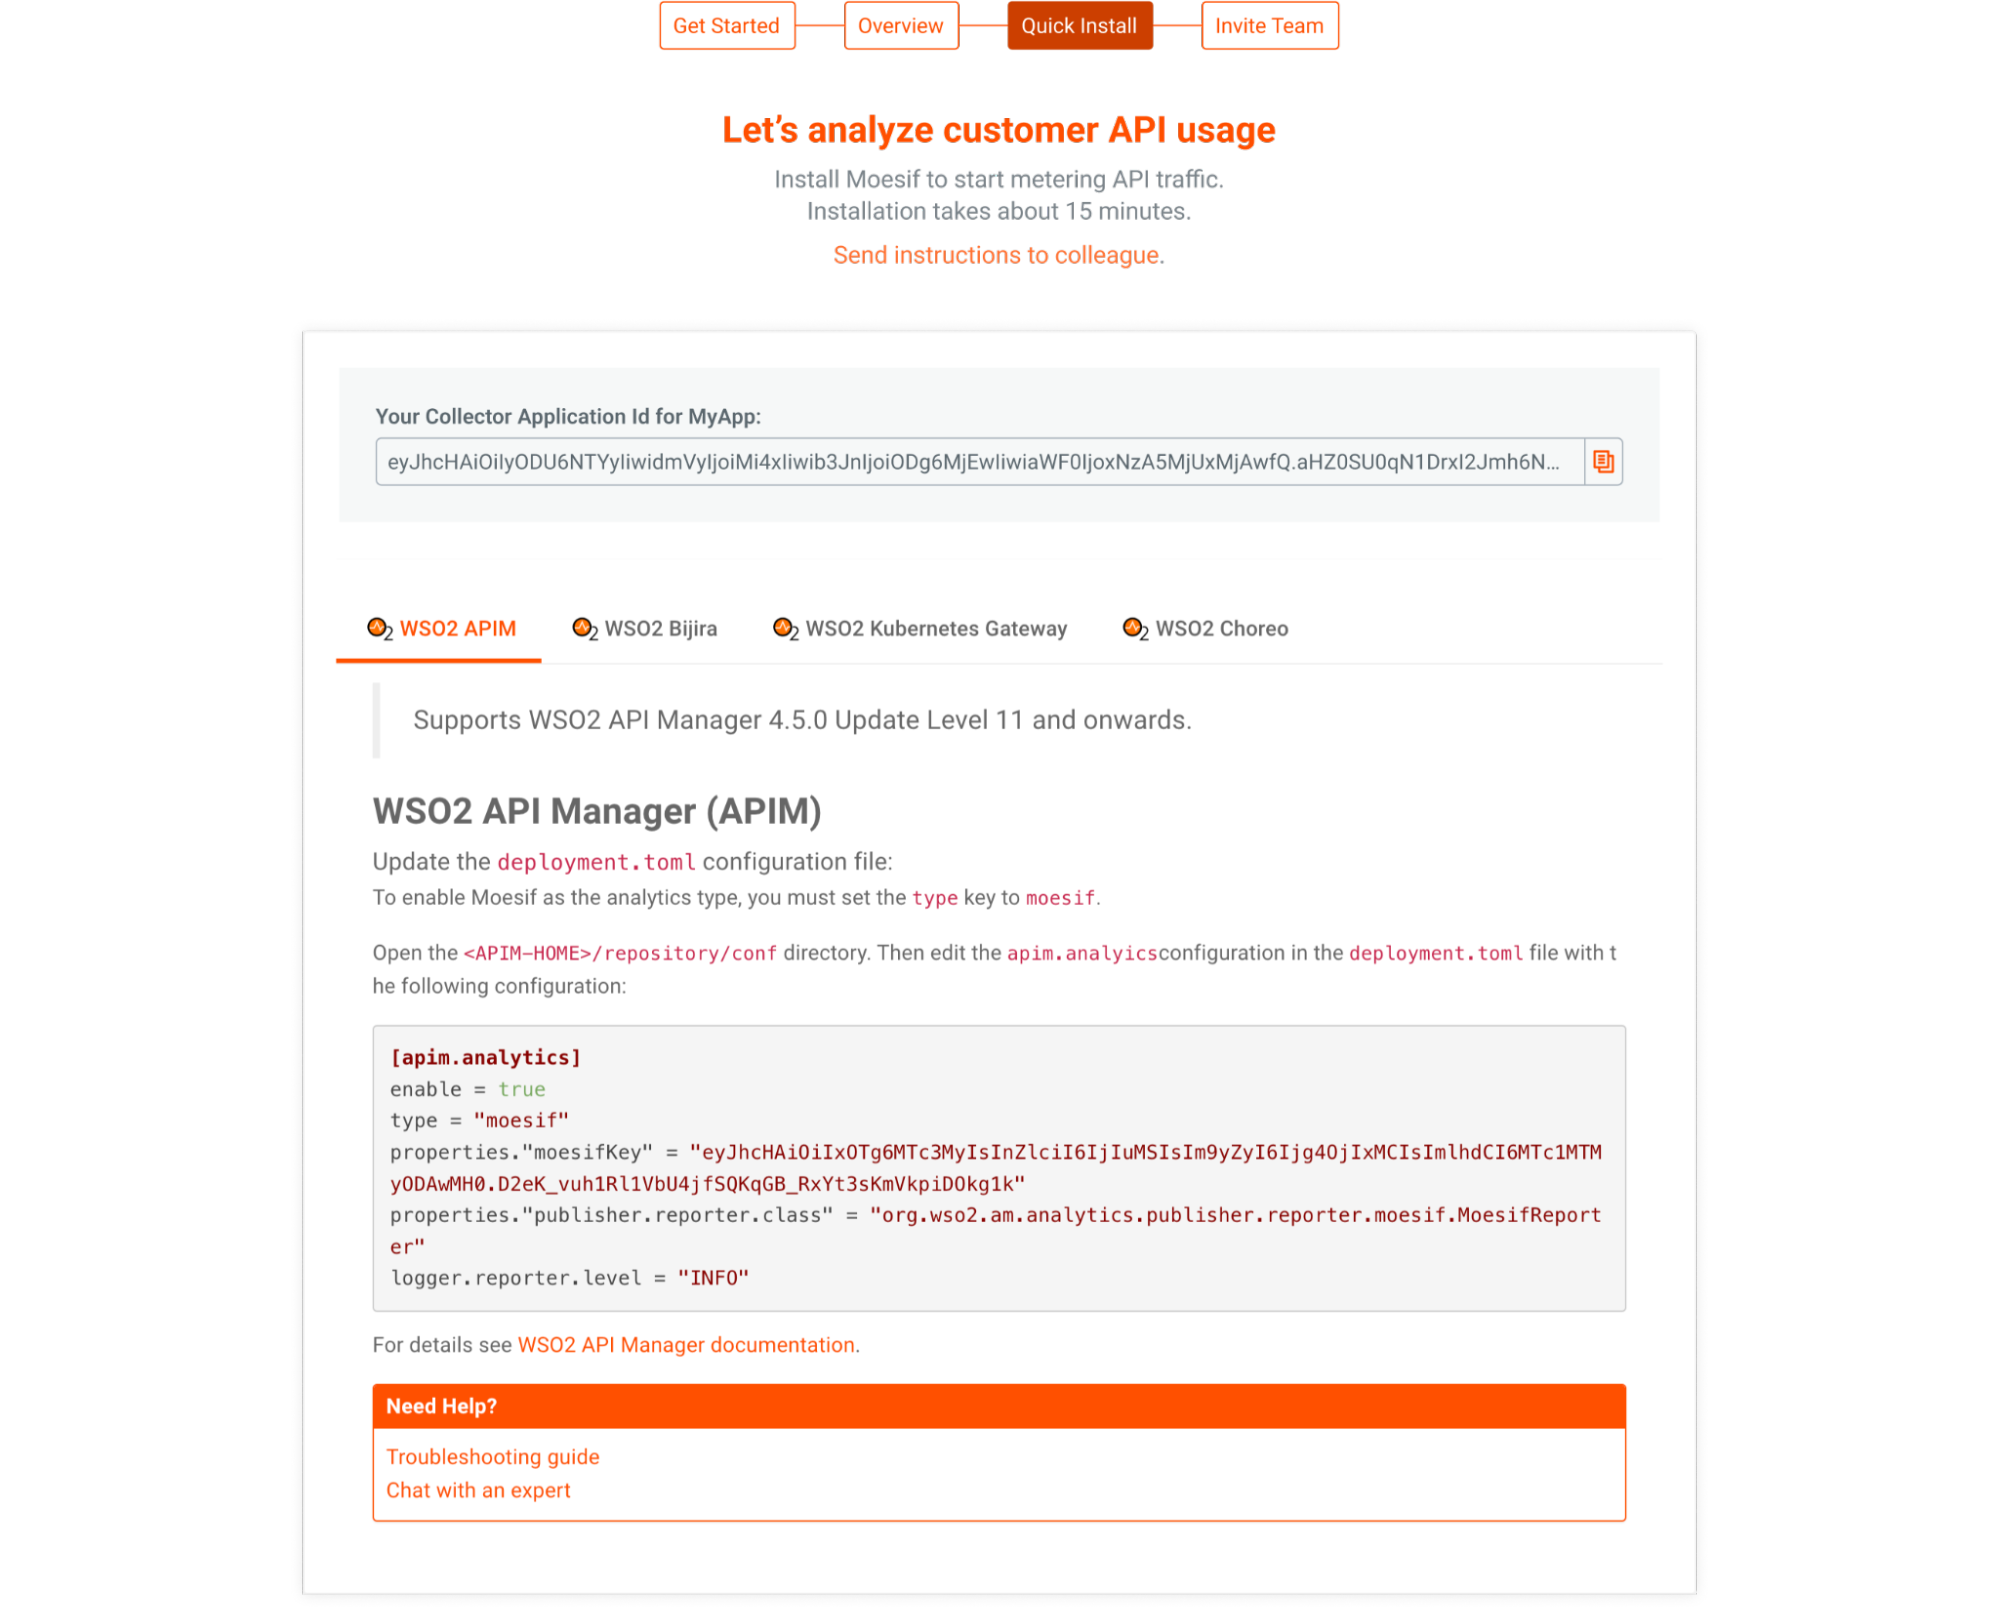
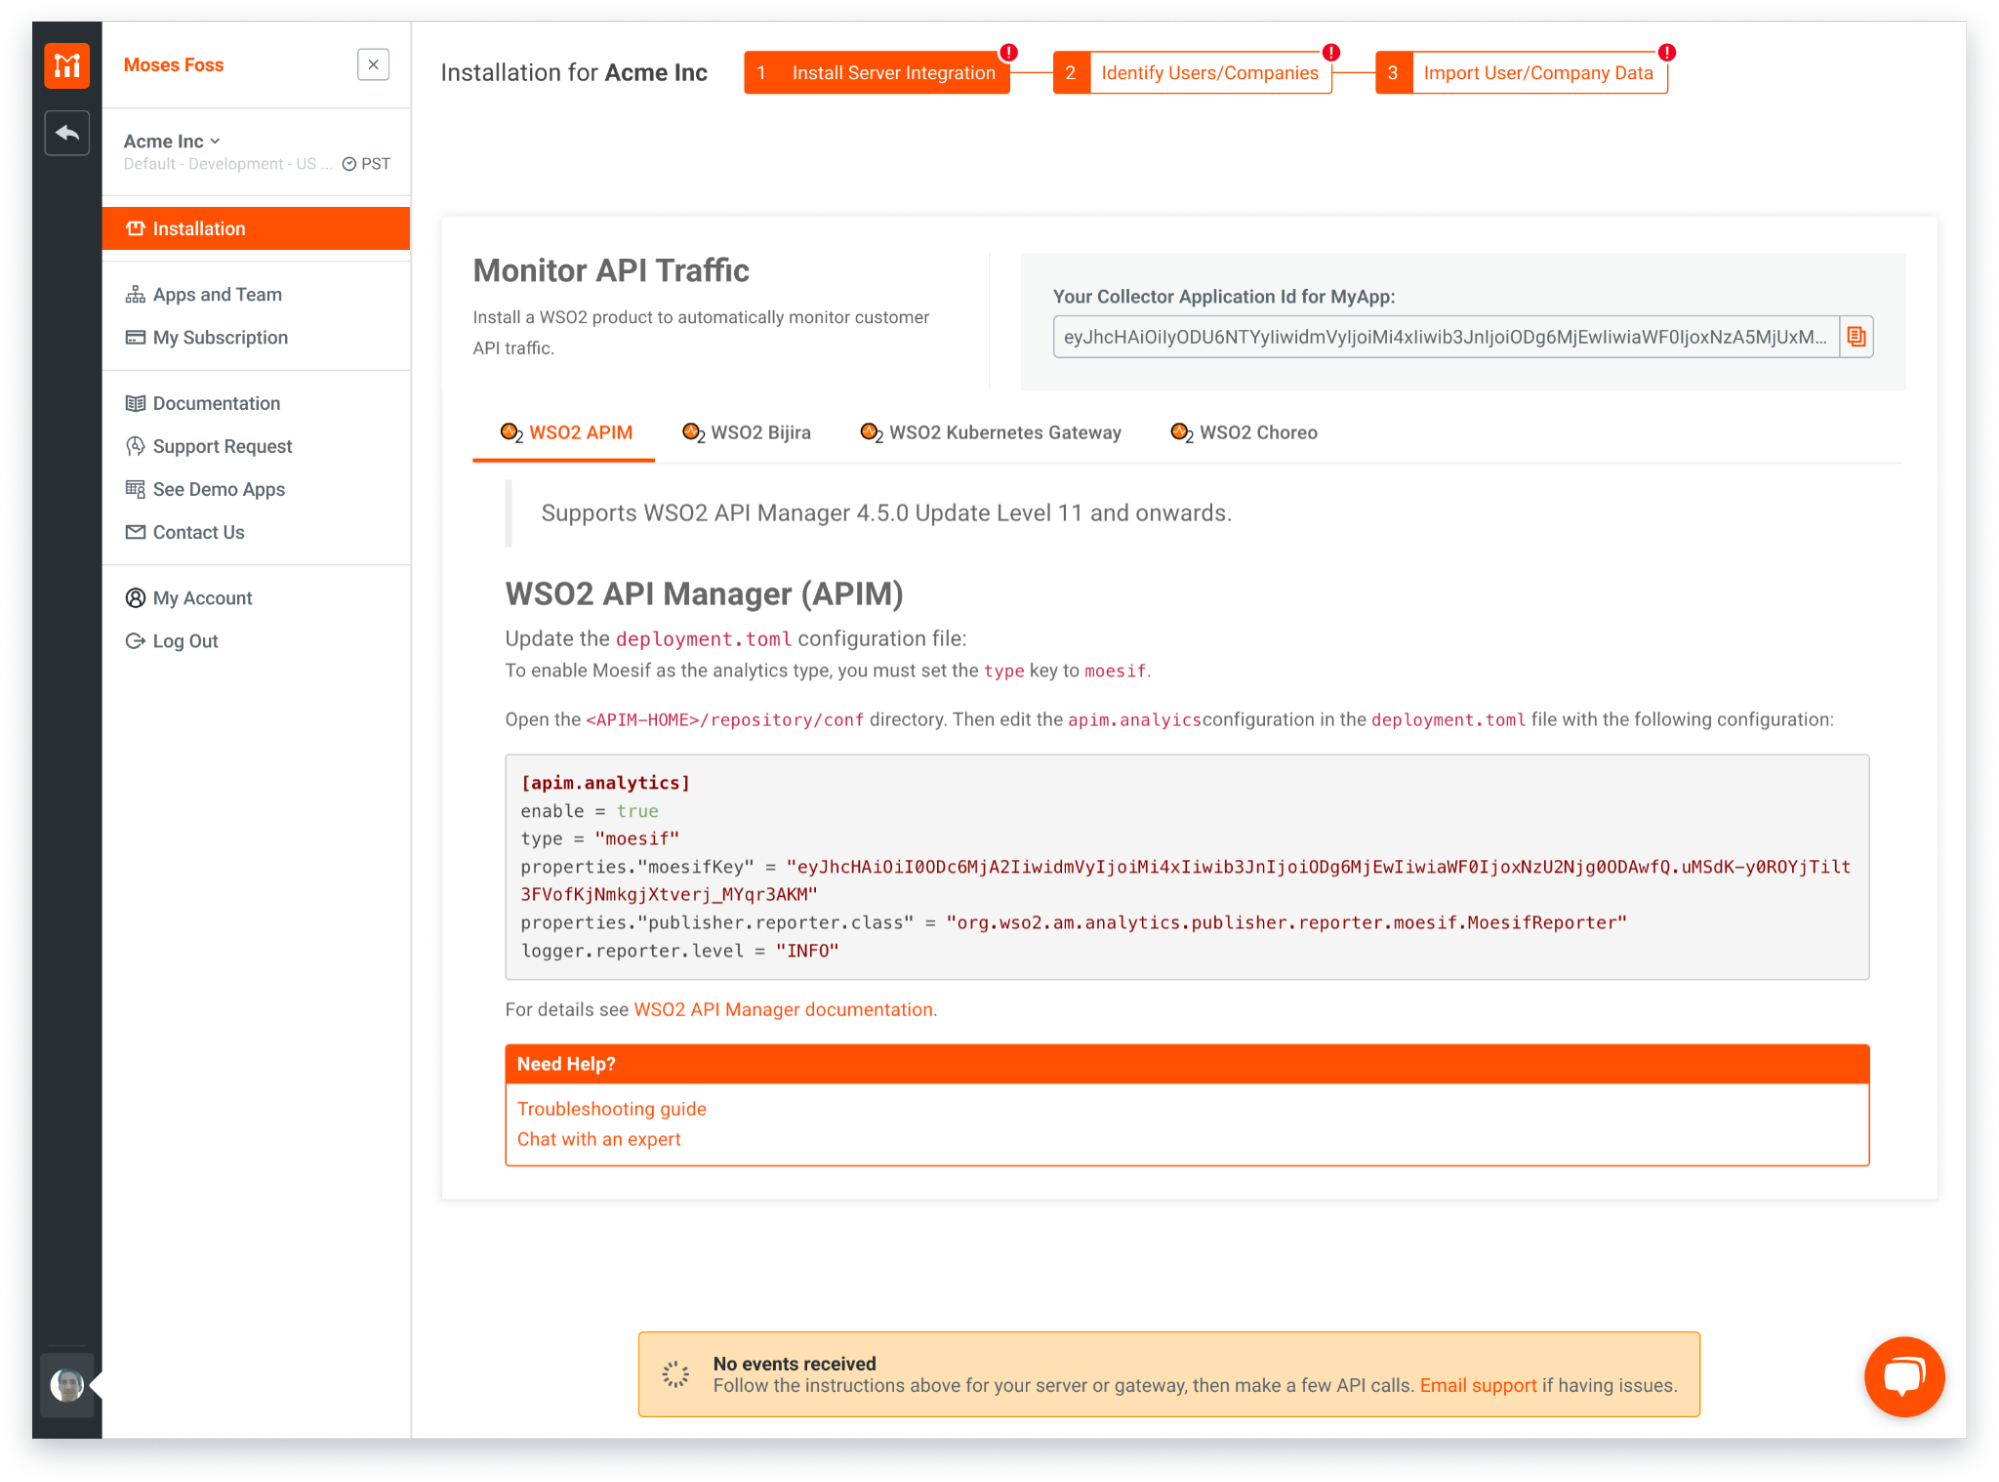
- Follow the installation instructions for WSO2 API Manager and Bijira in the Quick Install screen. For WSO2 API Manager, update the
deployment.tomlfile of your WSO2 API Manager instance accordingly. For more information about the installation process, see the integration docs for WSO2 API Manager and Bijira.
![Integration screen in Moesif Basic Insights to integrate with WSO2 API Manager and Bijira. Integration screen for WSO2 in Moesif Basic Insights.]()
- After successful integration, Moesif starts receiving API traffic from API Manager and Bijira. The installation screen shows a confirmation banner that it has started receiving event data.
- Optionally, set up customer identification.
- Invite team members to collaborate in the last step.
You can configure your installation, import customer data, and set up customer identification anytime by following these steps:
- Select the account icon to access your organization and app settings.
- Select Installation.
Access More of the Moesif Platform
As your API program matures and becomes more critical to your business, you will require more clarity as your questions evolve from what your API usage is to why it is so. Upgrading to a paid plan empowers you to go deeper and thereby refine your strategy to grow.
By upgrading to Moesif Enterprise, you can gain access to more features, including:
- Advanced API and customer behavior analysis
- API monetization
- Configurable workspaces and dashboards to organize analytics
- Advanced and custom API monitoring and alerting with anomaly detection
- AI–powered insights through AI Explain
- Embeddable metrics
Go Beyond Basic Metrics to Deep Behavioral Analysis
While Basic Insights contributes high-level trends, Moesif Enterprise allows you to dig into the complete user journey to understand both the traffic and the behavior behind it. That means having definitive answers to business questions that directly impact your product strategy:
- Which specific customer segments are adopting the new AI features?
- What API usage patterns correlate with customer retention versus churn?
- How can we link specific API errors to individual user actions for faster, more effective troubleshooting?
Configurable workspaces can keep everything organized across different analysis dimensions and business units. Federating that with advanced alerting and AI-powered insights allows you to adopt a proactive, data-driven strategy.
Turn Your APIs and AI Usage Into Revenue Streams
One of the most powerful capabilities of Moesif Enterprise is the tooling to monetize your APIs. You can create new revenue sources based on actual product usage, thanks to the strong foundation of Moesif’s high-dimensional, high-cardinality analytics. With industry-proven and AI-ready API monetization features, you can:
- Monetize your AI and API products:
- Implement usage-based and outcome-based billing
- Monetize MCP servers
- Implement usage-based pricing for AI agents
- Create, manage, and experiment with complex pricing plans with different tiers and features
- Provide customers with self-service developer portal and embeddable analytics workspaces to track their own usage and costs, improving transparency and user experiences
How to Upgrade
To add the complete Moesif Enterprise feature suite to your existing WSO2 subscription, reach out to your WSO2 account manager.


