Creating and Using Templates
This guide assumes you are familiar with Dashboards and Workspaces. Before following the instructions for each of the integration types, make sure you have a chart ready to embed.
Integration Types
To embed charts and metrics that Moesif generates for your API, consider your use case and choose a suitable integration type. To tailor to different requirements, Moesif supports the following integration types for embedding metrics:
- Static Embed
- Embed Template
- Search API
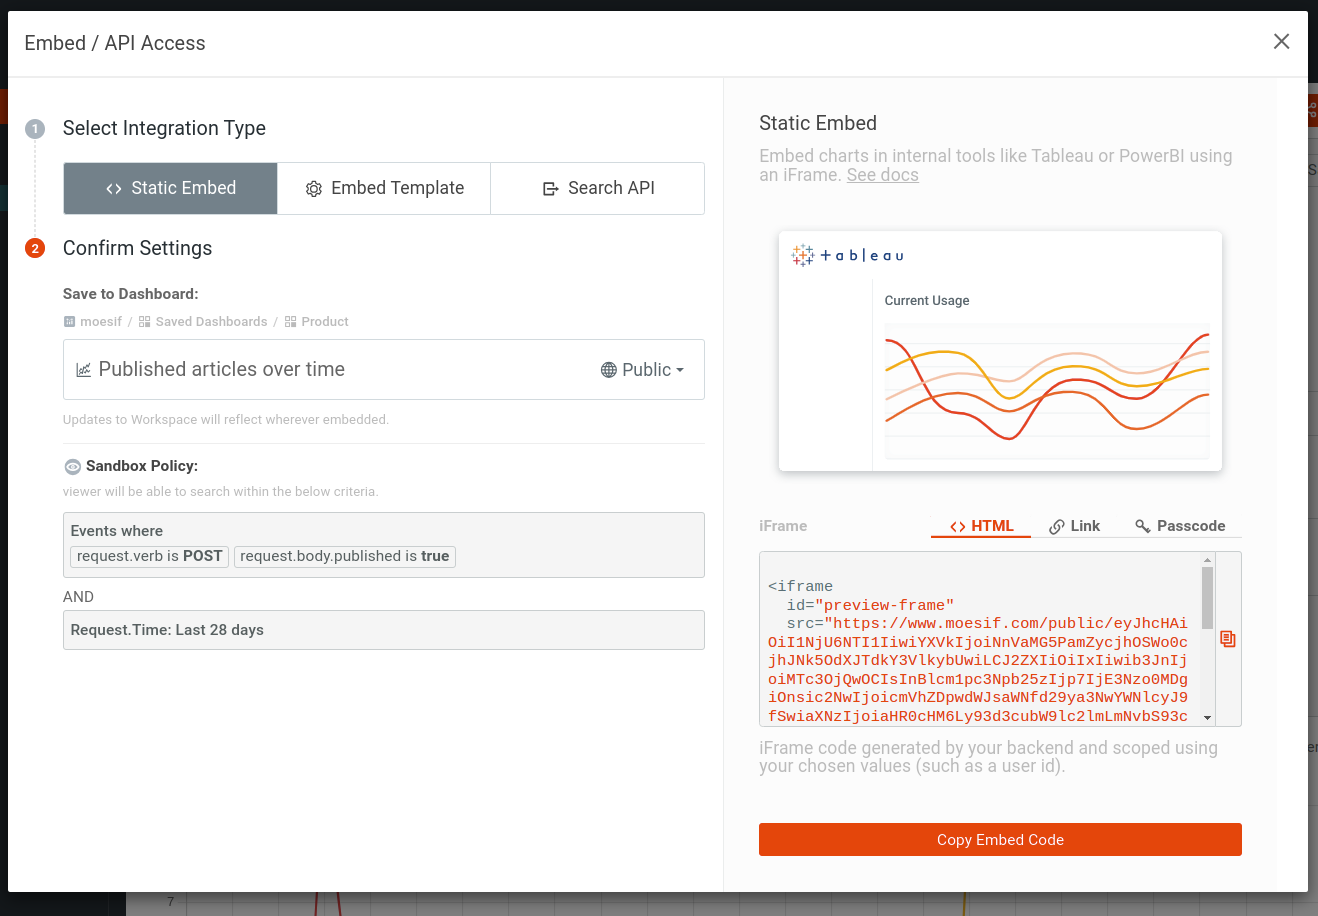
Static Embed
Static Embed allows you to embed charts in any HTML page, user-facing applications, and internal tools like PowerBI or Tableau with just a single code snippet. Static Embed generates public links in the following formats:
- An
<iframe>element that you can insert in HTML pages. - A secure public link that you can share with anyone.
- A passcode-protected link.
The public links make it trivial to embed metrics in your website and other applications. However, the sandbox policy has some limitations since the static nature of the embed requires that Moesif knows the filters ahead of time. The charts in a static embed don’t support dynamic filters. When the metric or filter remains consistent in your use case, a static-embedded chart using a public link may work better for these cases.
To use Static Embed, you must first set your chart’s sharing type to public.
For instructions on how to use Static Embed, see Use Static Embed.
Embed Template
Contrary to Static Embed, Embed Template is dynamic and contains dynamic fields you can programmatically fill in. This allows a more customized approach to rendering charts and metrics where the chart can accurately represent users based on each user or company’s corresponding set of dynamic properties. For example, when a user logs in, the associated user ID can work as the dynamic property for rendering the chart, ensuring that the user sees only the data that applies to them. This enables secure sandboxing and more isolation between user data.
Integrating an embedded template requires implementing a backend component that can securely communicate with Moesif and generate links to embed charts using the dynamic properties. For instructions on how to use embedded templates, see Use Embed Template
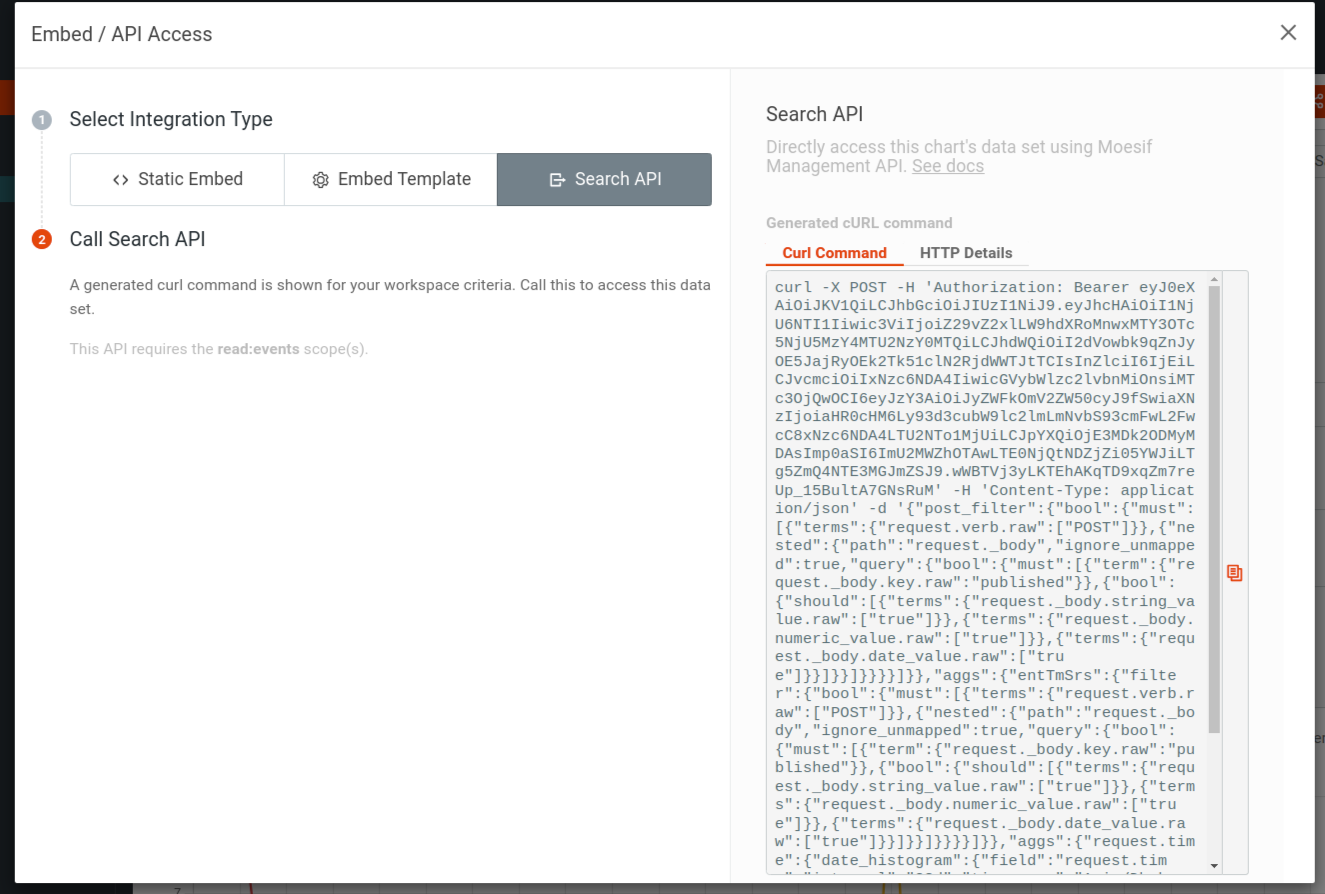
Search API
Search API gives you access to your chart’s data using Moesif’s Management API. You send a POST request to the Management API with your Management API key as the Bearer token and the search definition for the data you want to extract. This returns a JSON object containing the chart data that you can display in a more customized format. The search definition uses the Elasticsearch Query DSL.
Search API allows you to build custom solutions using your data, such as custom dashboards, reports, analytics, and so on. For instructions on how to use Search API, see Use Search API.
Choose The Right Integration Type
The following table summarizes the different aspects of the three integration types to help you choose the right one for your use case:
| Static Embed | Embed Template | Search API | |
|---|---|---|---|
| Type | Static in nature without any dynamic properties. | Contains dynamic properties that uniquely associate with each embed. | Provides access to raw chart data through API. |
| Shareable link | Yes. | No. | No. However, anyone can access the chart data with proper authentication credentials and authorization scopes. |
| Integration complexity | Very minimal as the frontend can integrate the embed using the generated links directly. | Integration requires work on both frontend and backend. | Depends on the use case of the chart data. |
| Sandboxing | Static and predefined. | Dynamic and programmatically adjusted during rendering. | Dependent on the search query and Management API key scopes |
| Use case | Embedding static charts for internal dashboards and presentations. | Securely embedding charts with dynamic or unknown criteria in customer-facing applications. | Building custom UI like dashboards, analytics pipelines, and visualization reports. |
Use Static Embed
To embed a chart using Static Embed, follow these steps from the chart window you want to embed:
- Select Embed / API from the chart header.
- Then select Static Embed.
- In the Confirm Settings section, confirm the settings of your embed. Remember that you must set your chart’s sharing type to Public to embed using Static Embed.
- The generated links are displayed in the right-hand pane under the three tabs HTML, Link, and Passcode. Select the tab you want and then select Copy or Copy Embed Code.
Configuring the Sandbox Policy
The sandbox policy dictates what criteria users can search within the chart. Any filters you have in place in your chart carry over to the static embed as constraints. To change this policy, return to the chart and configure it with the settings you want to set the sandbox policy with.
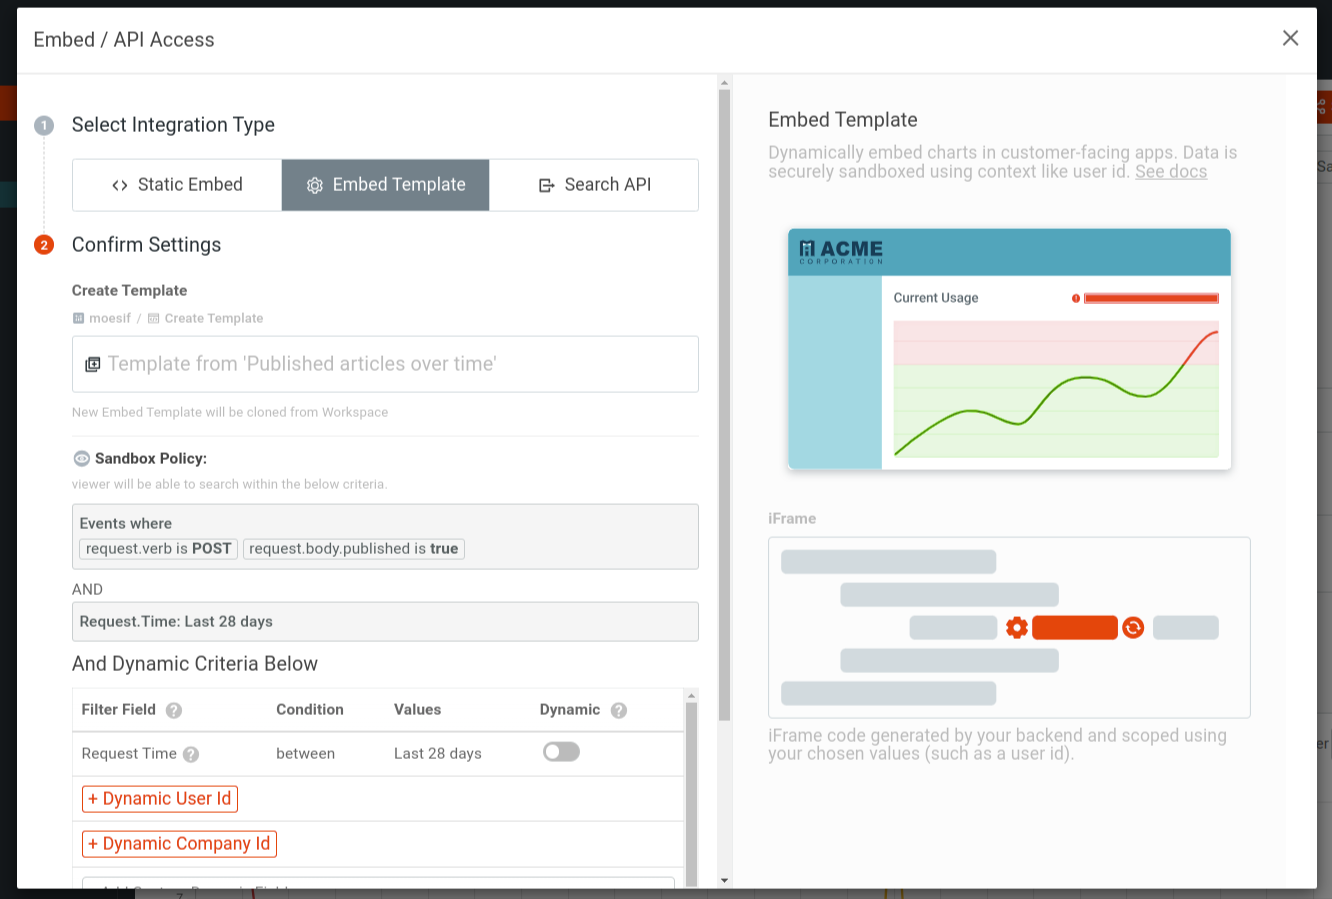
Use Embed Template
To use embedded templates, follow these steps:
- Select Embed / API from your chart window.
- Then select <> Embed Template.
-
Fill in the necessary details in the Confirm Settings section.
a. Enter a name for your new template.
b. Select your dynamic criteria.
c. You can choose to expose header and body keys of your API requests with the Expose Header and Body Keys toggle.
- Select Get Embed Code and confirm.
- The next dialog shows the instructions for integrating your new embedded template into your application. The following sections discuss these steps in detail.
For a step-by-step guide on how to use an embedded template using Node.js and Express, see Creating and Using Embedded Templates.
Generate Workspace Tokens
Create a new endpoint in your backend that programmatically sends requests to Moesif Management API for new workspace URLs using your dynamic values. For an example, see the server implementation in Moesif API dashboard embed example on GitHub.
Moesif generates a cURL command for you after selecting Get Embed Code. You can use this command to send a request to the Moesif workspace API with your dynamic values.
curl -X POST 'https://api.moesif.com/v1/portal/~/workspaces/WORKSPACE_ID/access_token?expiration=2025-01-28T10:16:15.762Z' -H 'Authorization: Bearer 'MANAGEMENT_API_KEY' -H 'Content-Type: application/json' --data-binary @- << EOF

{
 "template": {
  "values": {
   "user_id": "USER_ID"
  "company_id": "COMPANY_ID"
  }
 }
}
EOF
This command specifies two dynamic property values: a user_id and a company_id.
The workspace API returns a workspace access token scoped to the dynamic values:
{
  "_id": "WORKSPACE_ID",
  "token": "WORKSPACE_ACCESS_TOKEN",
  "url": "WORKSPACE_URL"
}
The response also contains your template workspace ID and the workspace URL.
Display the Chart
Use the workspace URL Moesif sends you in the preceding step to display the chart in your application UI. Since the dynamic properties scope the workspace access token and workspace URL, the user is authenticated and can access the chart safely. For example, the following snippet uses HTML and the <iframe> element to display the chart, setting the src attribute to the workspace URL:
<iframe
  id="preview-frame"
src="https://www.moesif.com/public/WORKSPACE_ACCESS_TOKEN/ws/WORKSPACE_ID?embed=true"
  name="preview-frame"
  frameborder="0"
  noresize="noresize"
>
</iframe>
Replace WORKSPACE_ACCESS_TOKEN and WORKSPACE_ID with your workspace access token and workspace ID respectively.
Configuring the Sandbox Policy
The sandbox policy dictates what criteria users can search within the chart. For an embedded template, the sandbox policy consists of the following elements:
- Any filters you have in place in your chart. They carry over to the embedded template as constraints.
- Any dynamic field you set when creating the embedded template.
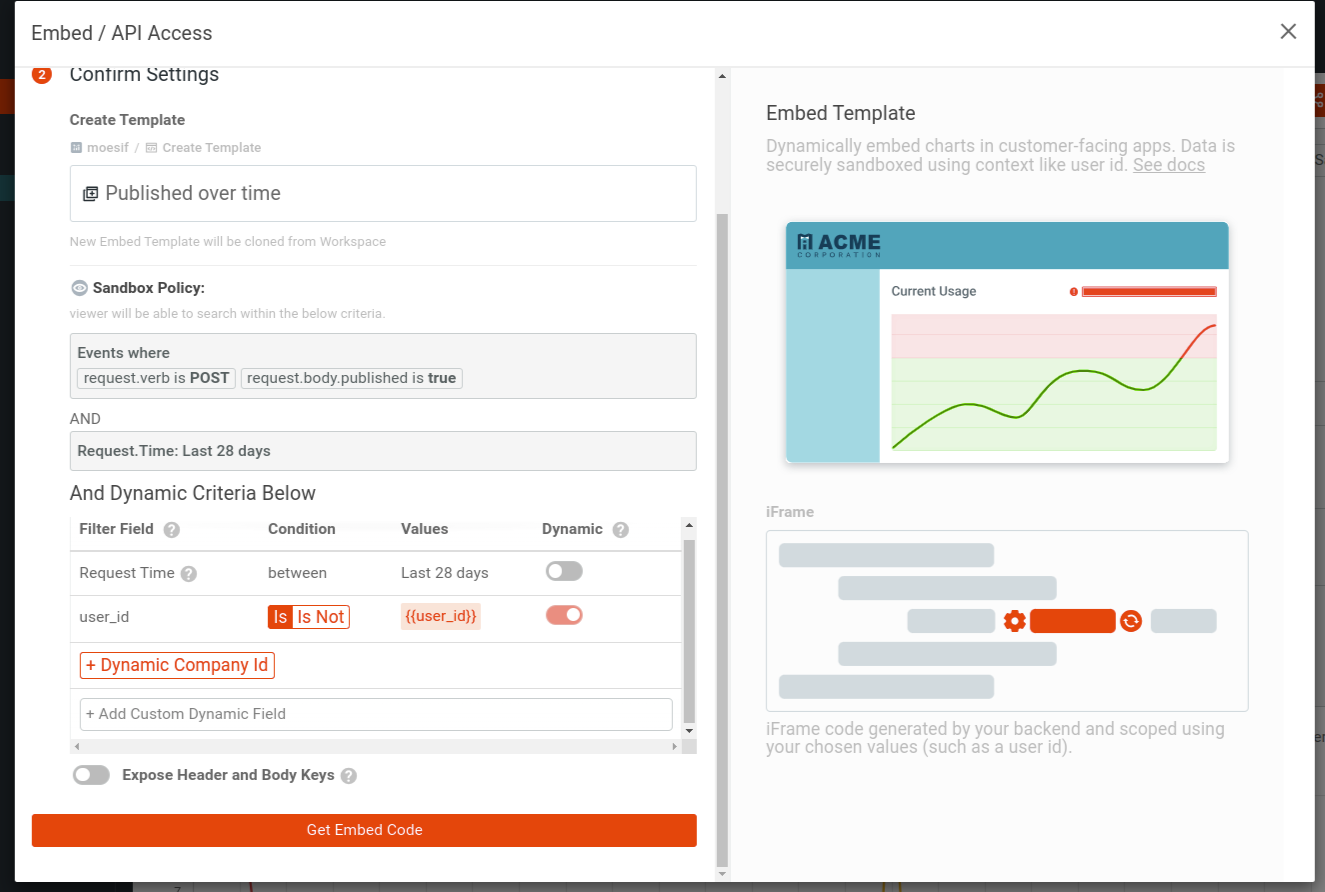
Configuring Dynamic Criteria
To create an embedded template, you must specify at least one dynamic property.
Moesif offers two builtin dynamic properties that you can use when creating the template:
- Dynamic user ID
- Dynamic company ID
You can also add custom dynamic fields by selecting Add Custom Dynamic Field.
Moesif always sets the request time constraint as part of the sandbox policy. You can choose to make it dynamic with the Dynamic toggle. If you set the Request Time constraint to Dynamic, the Values column shows two values from and to that Moesif expects. These correspond to the request time period in ISO 8601 format. You must specify these values when you generate workspace tokens in your backend. For example, with cURL:
curl -X POST -H 'Authorization: Bearer MANAGEMENT_API_KEY' -H 'Content-Type: application/json' -i 'https://api.moesif.com/v1/portal/~/workspaces/WORKSPACE_ID/access_token'
  -d '{
  "template": {
    "values": {
      "user_id": "USER_ID"
    }
    "from": "2023-07-16T02:52:39Z",
    "to": "2023-07-16T02:52:39Z"
  }
}'
For a Node.js implementation of it using Express, see the Moesif API dashboard embed example on GitHub.
If you set a dynamic field, you cannot use the same field as a filter in the embedded chart. For example, let’s say you’ve added the Request.User Agent field as a custom dynamic field. Using that dynamic field value, Moesif now expects to generate workspace URLs and tokens to render your embedded chart. Therefore, Moesif doesn’t allow you to use the Request.User Agent field as a filter in the embedded chart.
Adding Custom Dynamic Fields
To add a custom dynamic field, select + Add Custom Dynamic Field. From the menu, select the property you want. The Values column shows you the value Moesif expects for a custom dynamic property. Specify this value when you generate workspace tokens in your backend.
Exposing Header and Body Keys
By default, header and body keys remain hidden for privacy and security. Enable this option if you want users to filter on the header and body keys of API requests. Keep in mind that all users see the same keys.
Display Options
For embedding charts in a customer-facing portal, the default options can prove sufficient. For more information, contact Moesif support.
You can add the following URL parameters to the <iframe> element to customize for a look that fits your business requirements. The following example specifies the embed and hide_header display options as query parameters in the src attribute’s URL.
<iframe
  id="preview-frame"
  src="https://www.moesif.com/public/em/ws/{WORKSPACE_ID}?embed=true&hide_header=true#{WORKSPACE_ACCESS_TOKEN}"
  name="preview-frame"
  frameborder="0"
  noresize="noresize"
>
</iframe>
The following table explains the different display options available:
| Name | Type | description |
|---|---|---|
embed |
boolean | When set to true, enables embed mode. This adjusts to an embed-friendly layout. Always set this to true when embedding a chart in an <iframe> except for rare cases. |
hide_header |
boolean | By default, embed mode includes a small header containing filter dropdowns and chart name. To hide all elements besides the chart itself, set this to true. Since the filters are hidden, make sure any filters are added when you initially create the template. |
show_daterange |
boolean | If you set hide_header to true, but you still wish to show the date range select that was part of the header, set this to true. |
show_metadata |
boolean | By default, embed mode hides the event metadata. You can override this behavior to show event metadata by setting this to true. |
show_users |
boolean | By default, embed mode hides the user information. You can override this behavior to show the user information by setting this to true. For example, if you have a use case where your customers want metrics on their end users, you can set show_users and show_user_filters to true while keeping show_companies and show_company_filters at false. |
show_companies |
boolean | By default, embed mode hides the user filters. You can override this behavior to show user filters by setting this option to true. |
show_user_filters |
boolean | By default, embed mode hides the user filters. You can override this behavior to show user filters by setting this option to true. |
show_company_filters |
boolean | By default, embed mode hides the company filters. You can override this behavior to show company filters by setting this option to true. |
primary_color |
string | You can set the primary_color parameter to a URL encoded hex value that matches your brand colors—for example, ?primary_color=%2332CD32. The primary color controls any brand-colored buttons, links, the color of the first metric in the chart, among other elements. |
color_array |
array | When your chart plots multiple metrics such as due to a group by, color_array defines the secondary colors for the chart. This is a URL encoded string that contains a comma separated array of color hashes. The first index specifies the color for first metric in the chart, the second index specifies the color for the second metric in the chart, and so on.For example, if you want the following color hashes: #ff0000, #00ff00, #0000ff in this order, set color_array to ?color_array=%23ff0000%2C%2300ff00%2C%230000ff. This also controls the color of status codes in the event logs. 1xx errors have the first index’s color, 2xx errors have the second index’s color, and so on. |
chart_font_color |
string | You can set the chart_font_color parameter to a URL encoded hex value that matches your brand colors such as ?primary_color=%2332CD32. This modifies the colors of the chart axis labels and chart axis ticks. |
chart_font_family |
string | Specifies the font family for the chart scale label, and ticks. It follows CSS font-family options. If a font is not available, the chart uses the default font family. |
chart_axis_font_size |
boolean | Font size in pixel values (px) for both X-axis and Y-axis ticks. |
chart_label_font_size |
boolean | Font size in pixel values (px) for both X-axis and Y-axis labels. |
chart_x_axis_label |
string | The text for the title of the X-axis. For example, # of People or Response Choices. |
chart_y_axis_label |
string | The text for the title of the y-axis. For example, Percentage or Count. |
hide_chart_axis_label |
boolean | If true, hides both X-axis and Y-axis labels. |
hide_chart_legend |
boolean | If true, hides chart legend. |
hide_event_selection |
boolean | For Event Log view only. If true, hides the checkboxes for selecting events and any buttons that act upon selected events. |
drawing |
object | If the embedded view is a Time Series chart or Segmentation chart, you can add an additional line to represent a threshold. For more information, see Drawing. |
time_zone |
string | Customize time zone for the chart. For example, to set to America/New_York, set url query param (url encoded) like this: time_zone=America%2FNew_York. Most IANA time zone names are supported. To see full list, print this out in Javascript: console.log(Intl.supportedValuesOf('timeZone')); |
Tip on controlling iframe size
By default, iframe’s height is only 150px, so that is typically too short. We leave to the customer to control the iframe size, as there are many approaches and needs. Below is one technique: creating a wrapper for the iframe to use css to control the aspect ratio.
<div class="iframe-wrapper" style="position: relative; width: 100%; padding-bottom: 56.25%; /* 16:9 aspect ratio */">
    <iframe src="url" style="position: absolute; top: 0; left: 0; width: 100%; height: 100%; border: none;"></iframe>
</div>
You can adjust either width, padding-right, or padding-bottom values of the iframe-wrapper.
Drawing
You can add static markers to your chart to represent a plan quota or SLA agreement. For example, a line across the chart at a specific threshold so that users can trace their usage against their quota.
Use the drawing parameter to draw a static marker. You must define and format the options for the drawing as a query parameter. You must attach it to the embed URL in the same way you attach the display options.
For example, the following JavaScript code shows how to add a line to a time series showing a threshold:
import qs from 'qs';

const queryParams = {
  drawing: {
    value: number, // required
    name: 'name of the label', // required.

    // below are optional:
    type: 'line',
    borderWidth: 5,
    borderColor: 'rgba(255, 51, 181, 0.3)',
    backgroundColor: 'rgba(255, 51, 181, 0.3)',
    pointRadius: 0,
  }
}

// format it into query string
qs.stringify(queryParams, { format: 'index' });

// and append to the embed url.
Use Search API
To use Search API, from the chart you want to access through the Search API, follow these steps:
- Select Embed / API from the chart header.
-
Select Search API.
Moesif generates a cURL command for your workspace criteria that you can use immediately to access the chart data. Moesif also gives you the HTTP request details so you can use HTTP clients like Postman.
- Select the Curl Command tab for the cURL command and the HTTP Details tab for the HTTP request details.
Search Definition
The search definition Moesif generates uses the Elasticsearch Query DSL. To access the search definition, see the HTTP request body from the HTTP Details tab or the generated cURL command’s -d (or --data) argument value.
This search definition accurately represents your desired report according to your chart’s filters and settings. You can quickly go back to your chart window, reconfigure, select Embed / API, and then select Search API to update your search. If you need help building a query for your business requirements, contact us.
The Search API sends your request to the Management API’s events search endpoint. For more information, see the Management API searchEvents documentation.