Visualize API Usage with GeoJSON in Moesif Heatmap Analytics
This guide demonstrates how to leverage Moesif’s geographic heat maps and GeoJSON support for API analytics in geolocation-based APIs.
Overview
APIs that operate on location—for example, weather, mobility, or delivery—often receive structured geographic data from customers. These APIs work with explicit latitude-longitude coordinates, polygons, or region IDs as part of their payloads. Moesif’s GeoJSON-based heatmaps allow you to transform that geospatial data into rich visualizations about your API’s usage and more.
This guide shows you how you can visualize customer-supplied geographic data in GeoJSON format in Moesif heatmaps. You will learn how to use geo heatmaps to observe API usage across regions, identify high-latency zones, and track usage patterns across custom business territories like delivery areas, partner zones, or field assets.
Learning Objectives
- Learn about GeoJSON and why it’s useful for geo-based APIs.
- Plot geographic heatmaps using location data.
- Configure Moesif to recognize and visualize GeoJSON fields from event payloads.
- Interpret geographic heatmaps to inform product, infrastructure, and revenue decisions.
Audience and Background Knowledge
This guide is for engineers, product managers, and analysts working with geo-based APIs. This includes weather services, logistics platforms, mapping applications, IoT networks, or any service that processes or delivers geographically tagged data. You will find this guide especially useful if your API accepts customer-supplied coordinates or region shapes and you want to visualize this traffic across the actual geographies that matter to your business.
A working knowledge of the following Moesif concepts and tools is helpful, but not strictly required:
- Dashboards and workspaces
- Event types—API calls and custom actions
Familiarity with JSON and APIs will allow you to get more out of this tutorial.
Background
IP geolocation may provide a convenient fallback to estimate where users are. However, if location is a first-class input in your API, inferred IPs introduce ambiguity, compliance risks, and analytical blind spots.
Geo-based APIs typically receive structured geographic input directly from end users. These inputs may come as coordinates (lattidue-longitude), region names, or even custom shapes that represent delivery zones or sensor boundaries. You need to visualize how users interact with those specific locations, not wherever their IP happens to resolve.
Rather than approximating a location using network-derived data, Moesif can visualize metrics like event activity using GeoJSON shapes. If your users send latitude-longitude coordinates, or if your service responds with geographic boundaries, you can tag these locations as GeoJSON and let Moesif render them directly on a map. This allows you to:
- Observe where customers are consuming your API—at the precision of their input.
- Track usage by service region or operational zone.
- Understand regional traffic patterns, performance issues, or monetization opportunities—based on business-defined geography.
Product teams, analysts, and platform engineers can use this feature to align API metrics with real-world territories, like franchise regions, sales territories, or sensor fields in IoT. GeoJSON support in Moesif heatmaps gives your teams a way to overlay API usage on the actual geographies their business operates in. You do not need to rely on or store personally identifiable information like IP addresses.
This feature bridges the gap between how your users experience your API and how you make sense of that usage spatially.
Before You Begin
To complete this tutorial, make sure you meet the following prerequisites:
- An active Moesif account under an Enterprise plan so you can use GeoJSON in heatmap analytics.
- You have integrated Moesif with your system through one of the server integration options.
- You have API traffic flowing into Moesif with location data in valid GeoJSON format. The data must be available to Moesif in one of the following ways:
- As a field in the request or response body
- As a query parameter
Why Use GeoJSON for Business-Centric Geo Analysis
When you’re building APIs that rely on geographic input, every request from your customer includes spatial context that defines what the request is about. Moesif aims to provide the means to visualize, aggregate, and connect that data to business outcomes.
GeoJSON is a standard for encoding geographic data using JSON. It supports spatial types like Point, LineString, and Polygon, as well as FeatureCollection objects that group multiple geometries. Take for example querying a forecast for a specific point or requesting a delivery quote for a polygonal service area. You can log these inputs in GeoJSON format and pass them to Moesif to create geo heatmaps.
GeoJSON maps show what geographic location each request is about, unlike IP-based maps that show where users are connecting from. This distinction matters in use cases such as these:
- Your API isn’t tied to the caller’s location—for example, a customer requests weather info for a city they’re not in.
- You need to analyze demand, performance, or revenue across target geographies, not network origin.
- Your business logic operates on real-world territories, like agricultural fields or service zones, that don’t align with standard boundaries like countries or ZIP codes.
Once you have a GeoJSON field in API payload or query parameter, you can choose that field in Moesif heatmap analytics to plot metrics based on the geometry defined in that field. For example, you may have a Point defined in the location request body field:
{
  "type": "Point",
  "coordinates": [-73.93524, 40.73061]
}
Moesif will plot API calls at that exact coordinate.
GeoJSON-based heatmaps let you perform true region-aware analytics, providing a direct path to investigating high-value business questions:
- Which forecast regions drive the highest query volume in my weather API?
- Which delivery zones have the longest response times for cost estimation?
- Which partner-defined service areas are underused, overused, or misconfigured?
You can’t answer these questions by network location alone. They depend on visualizing the data points your customers send you. Moesif’s GeoJSON turns those embedded shapes into first-class analytics primitives you can filter and interpret visually.
GeoJSON also provides better privacy posture. By relying on declared, business-purpose location inputs, you can maintain geographic observability without collecting potentially sensitive user data—especially important in industries where regulatory compliance may pose concerns.
Use Cases of Geographic Heat Maps Across Industries
In logistics and delivery Platforms, with Moesif’s geo heatmaps:
- Operations teams can find out the most frequently-queried delivery zones, and compare that to fulfillment data.
- Product managers can monitor adoption in new regions.
- Engineering teams can correlate latency hotspots with complex service regions.
Delivery APIs often involve multiple layers of geographic input. Visualizing each of these as distinct GeoJSON shapes and creating separate heatmaps for them in Moesif can provide layered business intelligence by geography.
Mobility and transportation APIs, like ridesharing and rentals, typically log start and end locations as points. Moesif’s heatmaps can help visualize pickup or dropoff frequencies. It also becomes easier to detect unusual usage patterns by geography. For example, you may notice spikes in cancelled trips or high wait times concentrated in a few zones.
Geospatial intelligence APIs—like weather, air quality—are inherently location-centric. Heatmaps in Moesif can:
- Highlight the most frequently-queried regions to get insight into customer focus and data demand.
- Support tiered pricing models by geography.
- Observe query success and error rates by region in combination with Moesif’s Live Event Log.
For example, a weather API can leverage GeoJSON heatmaps to understand if rural or high-risk areas are receiving accurate forecasts at scale.
Instrument GeoJSON in Moesif
This section discusses how to instrument your GeoJSON data so they become available to Moesif for rendering geographical heat maps.
Use Valid GeoJSON
Moesif expects your geographic data to follow the GeoJSON standard, which defines geospatial shapes as structured JSON objects. Here are some common geometry shapes you might use in API analytics:
Point
A Point can represent a single coordinate—for example, a forecast query:
{
  "type": "Point",
  "coordinates": [125.6, 10.1]
}
Polygon
Polygon is a closed shape with one or more boundaries—for example, a delivery zone:
{
  "type":"Polygon",
  "coordinates":[
    [
      [
        100.0,
        0.0
      ],
      [
        101.0,
        0.0
      ],
      [
        101.0,
        1.0
      ],
      [
        100.0,
        1.0
      ],
      [
        100.0,
        0.0
      ]
    ]
  ]
}
Feature
A Feature wraps other shapes and their properties:
{
  "type": "Feature",
  "geometry": {
    "type": Point,
    "coordinates": [125.6, 10.1]
  },
  "properties": {
    "region_id": "zone-3"
  }
}
FeatureCollection
FeatureCollection allows you to list multiple shapes—for example, for multi-zone requests:
{
  "type": "FeatureCollection",
  "features": [
    {
      "type": "Feature",
      "geometry": { "type": "Point", "coordinates": [-0.1278, 51.5074] },
      "properties": {
        "location": "London, UK",
      }
    },
    {
      "type": "Feature",
      "geometry": { "type": "Point", "coordinates": [2.3522, 48.8566] },
      "properties": {
        "location": "Paris, FR",
      }
    }
  ]
}
How to Include GeoJSON in API Event
Moesif automatically detects GeoJSON fields and makes them available in the UI if you include them in the following manner in API events:
- As a query parameter—for example,
?location={...} - In request or response body
The GeoJSON object must be a valid, parsable JSON. Make sure that the field names are consistent and intuitive.
You don’t need any separate or extra instrumentation apart from using one of Moesif’s server integrations.
Validate GeoJSON
To make sure that Moesif renders heatmaps correctly with GeoJSON, we recommend that you pay attention to the following:
- Follow the RFC 7946 spec for all GeoJSON fields.
- Specify coordinates in longitude, latitude order (do not put latitude first).
- Close polygons by using the same first and last coordinate.
If you’re automating or using an internal tool to generate GeoJSON, you can use a map viewer to verify the structure and that it renders as expected.
Create a GeoJSON Heatmap
This section walks you through how to create a heatmap, select a GeoJSON field, and visualize metrics across locations using available filters and workspace utilities.
Step 1: Create a New Heatmap
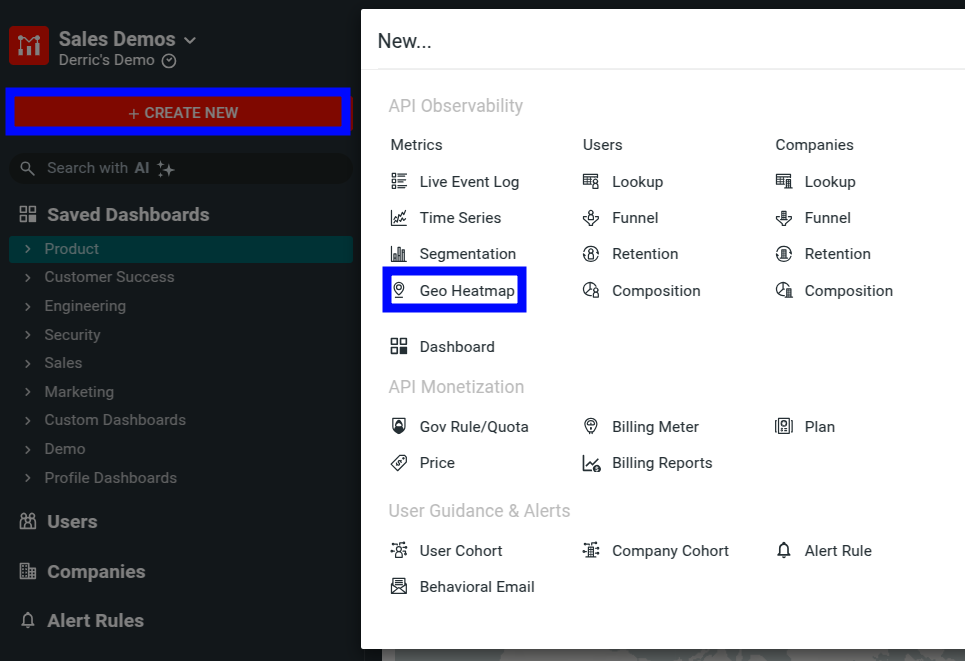
- Log into Moesif web portal.
- Select + Create New.
- Select Geo Heatmap from the API Observability section.

This opens a new heatmap workspace. By default, the heatmap plots data in a density heatmap using inferred IP addresses.
Step 2: Specify a GeoJSON Field
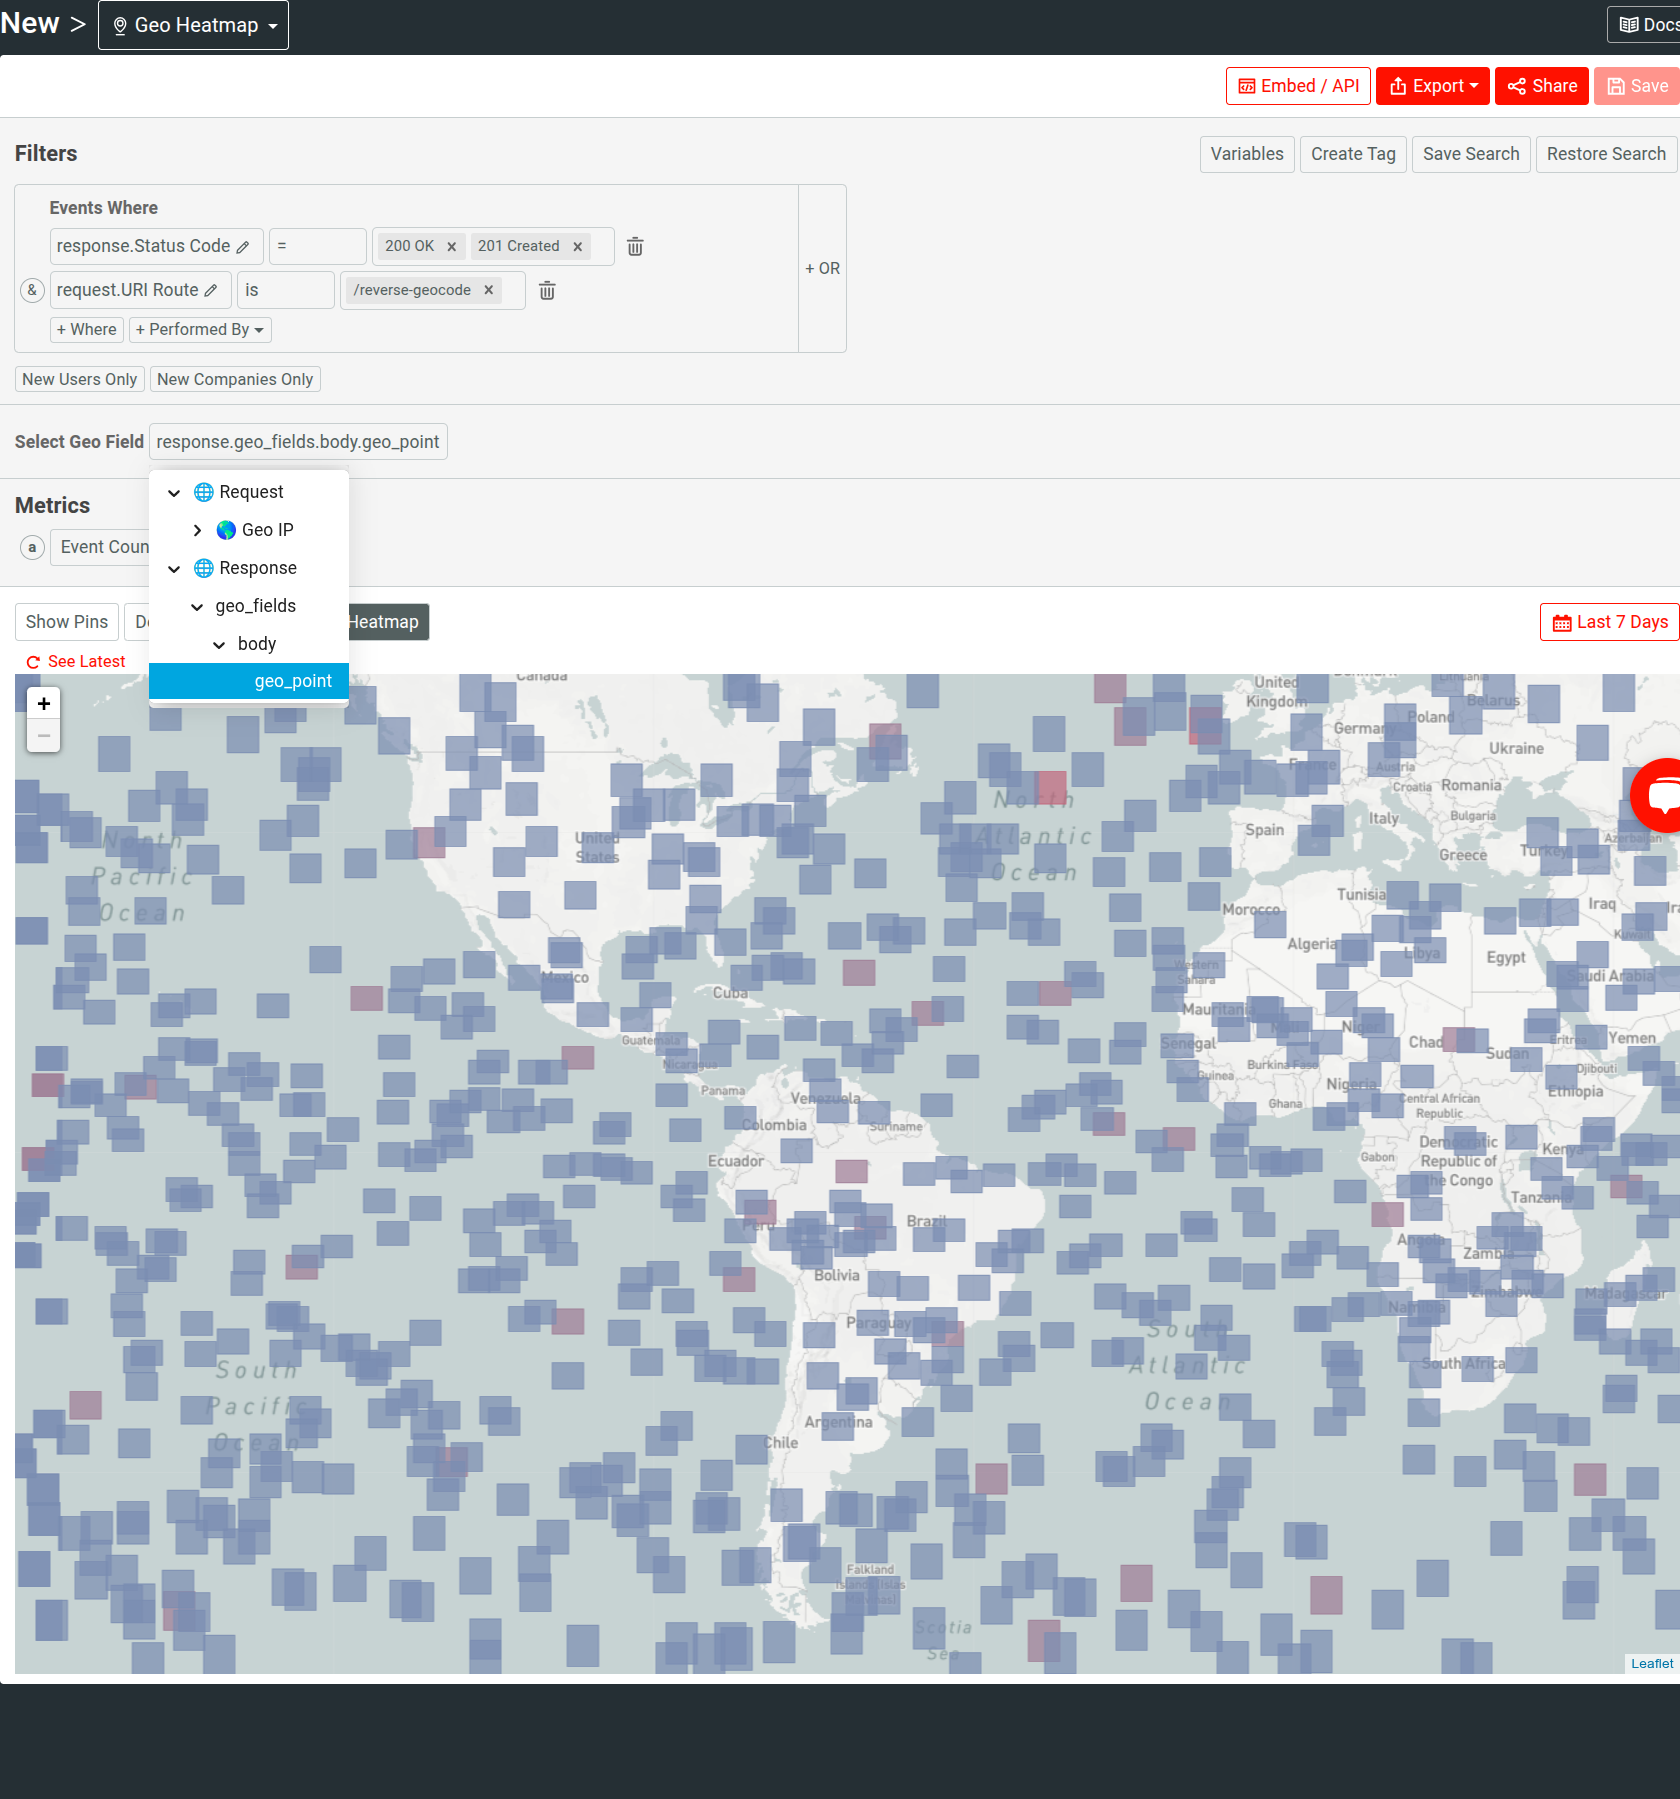
If your event data includes GeoJSON fields, select Select Geo Field to open the field selector and then specify a field. For example, the following figure selects the geo_point field:

Step 3: Specify the Metric
Moesif plots the Event Count metric by default, visualizing how many events occurred at each GeoJSON shape or point. In a heatmap, you can only define one metric at a time.
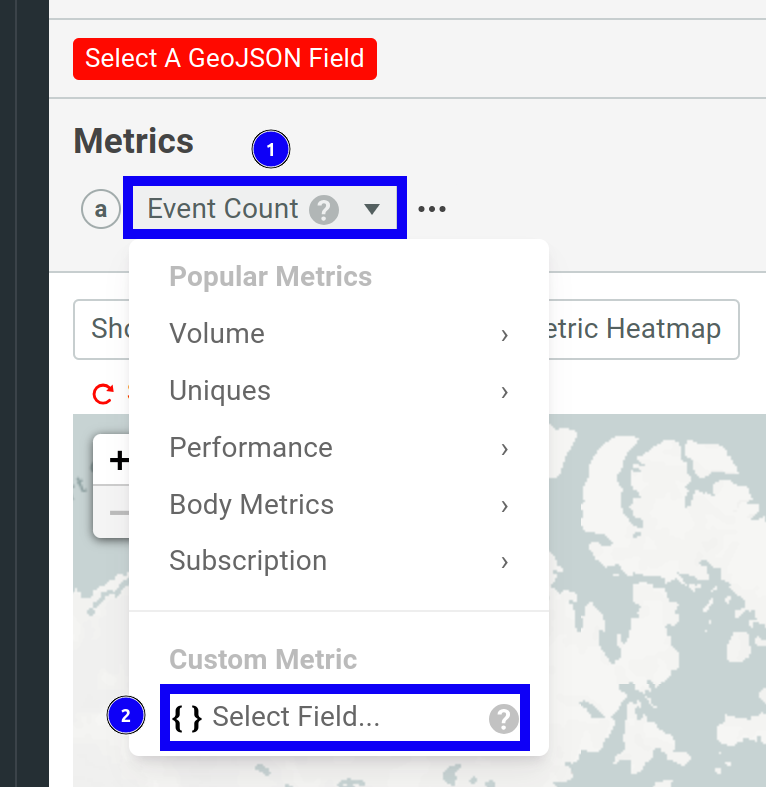
To change the default metric, open the menu in the Metrics pane. It has several predefined metrics available in different categories, for example:
- API usage
- Uniques like unique users or companies
- HTTP payload metrics like request and response body counts
You can also define custom metrics—for example, to analyze specific fields in payload.
To define a custom metric, follow these steps:
-
Select Select Field in the menu:
![Defining a custom metric in a Geo Heatmap workspace in Moesif. Defining a custom metric.]()
- Select an event data field from the list—for example, Duration (Milliseconds). You can also write a script that computes your desired event field.
- Select how to compute the metric. For example, for the Duration (Milliseconds) field, you can select
avgto plot the average elapsed duration of API requests over time.
Step 4: Customize and Configure the Heatmap
Specify Filters
Specify the filters in the Filters pane to tell Moesif what API events to include in the analysis. The preceding example, for instance, considers only successful requests to the /api/query endpoint.
To chain multiple filter conditions together, use + Where or + OR.
To include only new customers in the analysis who have made their first API call in the analysis time period, select New Users Only or New Companies Only.
To create heatmaps based on specific customer cohorts, select Performed By. You can choose from the existing cohorts, or create inline cohorts directly in the heatmap.
Select Heatmap Type
Moesif supports two heatmap types:
- Density heatmap
- Metric heatmap
By default, Moesif plots the density heatmap.
Enable Location Pins
Select Show Pins to activate location markers on the map. Then select a pin to see the specific metric value in that location. You can zoom in and out of the map and interact with these pins to more precisely interpret and investigate the heatmap.
Select Analysis Time Span
Moesif performs the heatmap analysis for the past 7 days by default. To change it, open the time span menu.
You can select from one of the builtin time spans, including subscription billing periods. For more precise control, use the relative date range or absolute date range options in the menu.
Step 5: Save the Heatmap
- Select Save.
- Choose a name for your chart.
- Select a dashboard to save the chart to. You can add to an existing dashboard or create a new one.
- Select Save to confirm.
Next Steps
- See Geo Heatmap docs.
- Explore server integration options.
- Learn how to organize your analytics into dashboards and workspaces.
- Learn how to share your heatmaps and embed in external solutions.
- Invite team members to collaborate.
